Plants where utilities are measured per line, and faults are fixed before they stop one.
Process water, compressed air, HVAC and plant air on one platform. Aqueduct reads alongside plant SCADA and historians, acts through your CMMS, and verifies at the meter.
Measure utilities per line, and fix faults before they stop one.
Compressors and pumps serviced before they stop a line
- Vibration and sound
Vibration and acoustic sensors pick up a new sound signature on critical assets well before a breakdown.
- Energy drift
An asset drawing more power for the same output is flagged as an early sign of wear.
- Maintenance scheduled first
The finding routes into your CMMS, so maintenance is scheduled before the failure reaches production.
Idle load, leaks and drift found asset by asset
- Per-asset baselines
Compressed air, chillers and HVAC are baselined against production and weather, not a monthly total.
- Peaks sequenced
Where control is enabled, with owner approval, loads are sequenced so large motors do not start together.
- Single line view
A live single line shows grid, generation and every feeder, so losses and overloads have a location.
Supply, process, cooling and discharge in one balance
- One plant balance
Supply, process, cooling and discharge reconcile live, so a loss shows up in hours, not at month end.
- Alongside SCADA
Aqueduct reads plant SCADA and historians, and control of the process stays where it is today.
- Real production air
Particulates and VOCs are read while lines run, not on a quiet weekend with production stopped.
Running a plant, before and after Aqueduct
- A compressor failure is the first sign of a compressor problem.
- Utility costs are one number spread across every line.
- Compressed air leaks hiss away through every shift.
- Air quality is measured on a weekend when lines are stopped.
- Maintenance runs on the calendar, not on asset condition.
 The Aqueduct way
- Vibration and energy drift schedule maintenance before the failure.
- Utility costs are measured per line and per asset.
- Compressed air leaks show up as idle load against baseline.
- Air quality is measured while production is running.
- Maintenance is scheduled by the early signs each asset shows.
What manufacturing units teams are up against.
Water, energy, air and operations carry equal weight. Each one runs the same loop: monitor, measure, identify, act, verify.
Water: Process water per line
Supply, process, cooling and discharge in one balance.
Energy: Compressed air and HVAC, baselined
Idle load, leaks and drift found per asset.
Air: The real curve during production
Particulates and VOCs while lines run, not on a quiet weekend.
Operations: Stops failures before they happen
Vibration, sound and energy drift caught early, maintenance scheduled in time.
Problem, solution, impact.
How Aqueduct resolves each problem for manufacturing units, and what changes when it does.
Supply, process, cooling and discharge in one balance.
A live water balance across meters and sub-meters localizes the loss, routes the fix and confirms it closed at the meter.
Loss found from the balance, not the bill, and every fix verified.
Idle load, leaks and drift found per asset.
Weather-normalized baselines per building and asset show the waste in money; schedules and setpoints adjust where control is enabled.
Savings stated in money and confirmed at the meter, not estimated.
Particulates and VOCs while lines run, not on a quiet weekend.
Air quality per zone, overlaid with occupancy, with ventilation raised when it matters and verified back in range.
Targets held during occupied hours, with the energy cost counted.
Vibration, sound and energy drift caught early, maintenance scheduled in time.
Faults diagnosed in plain language and routed into your CMMS with the fix; early signs of failure schedule maintenance first.
Fewer reactive call-outs and closures confirmed by the equipment.
One incident, from first signal to verified fix.
An illustrative example of the flywheel on a typical site.
Utility meters, compressor and chiller points, plant air sensors.
A baseline per line, shift and asset.
Compressor C-2: rising vibration, a new sound signature, energy drift.
Maintenance scheduled through your CMMS before it fails.
Vibration and energy back to baseline. No unplanned stop.
Four connected products on one data layer.
A line should never stop for a failure the plant could have heard coming.
Talk to our teamReplace what should be replaced. Connect the rest.
- Utility monitoring
- Energy management
- Water management
- Plant air quality monitoring
- CMMS and EAM
- SCADA and historians, read only
- ERP for cost allocation
Three equal ways in: keep your BMS, replace it, or build Aqueduct in at design stage.
The questions each seat asks first.
“Will it prevent an unplanned stop?”
“Does it work with our CMMS?”
“Can I show the real exposure curve?”
Standards and regulations we supply evidence for.
We supply the measured inputs. You run the program and file the report.
Where teams put it to work
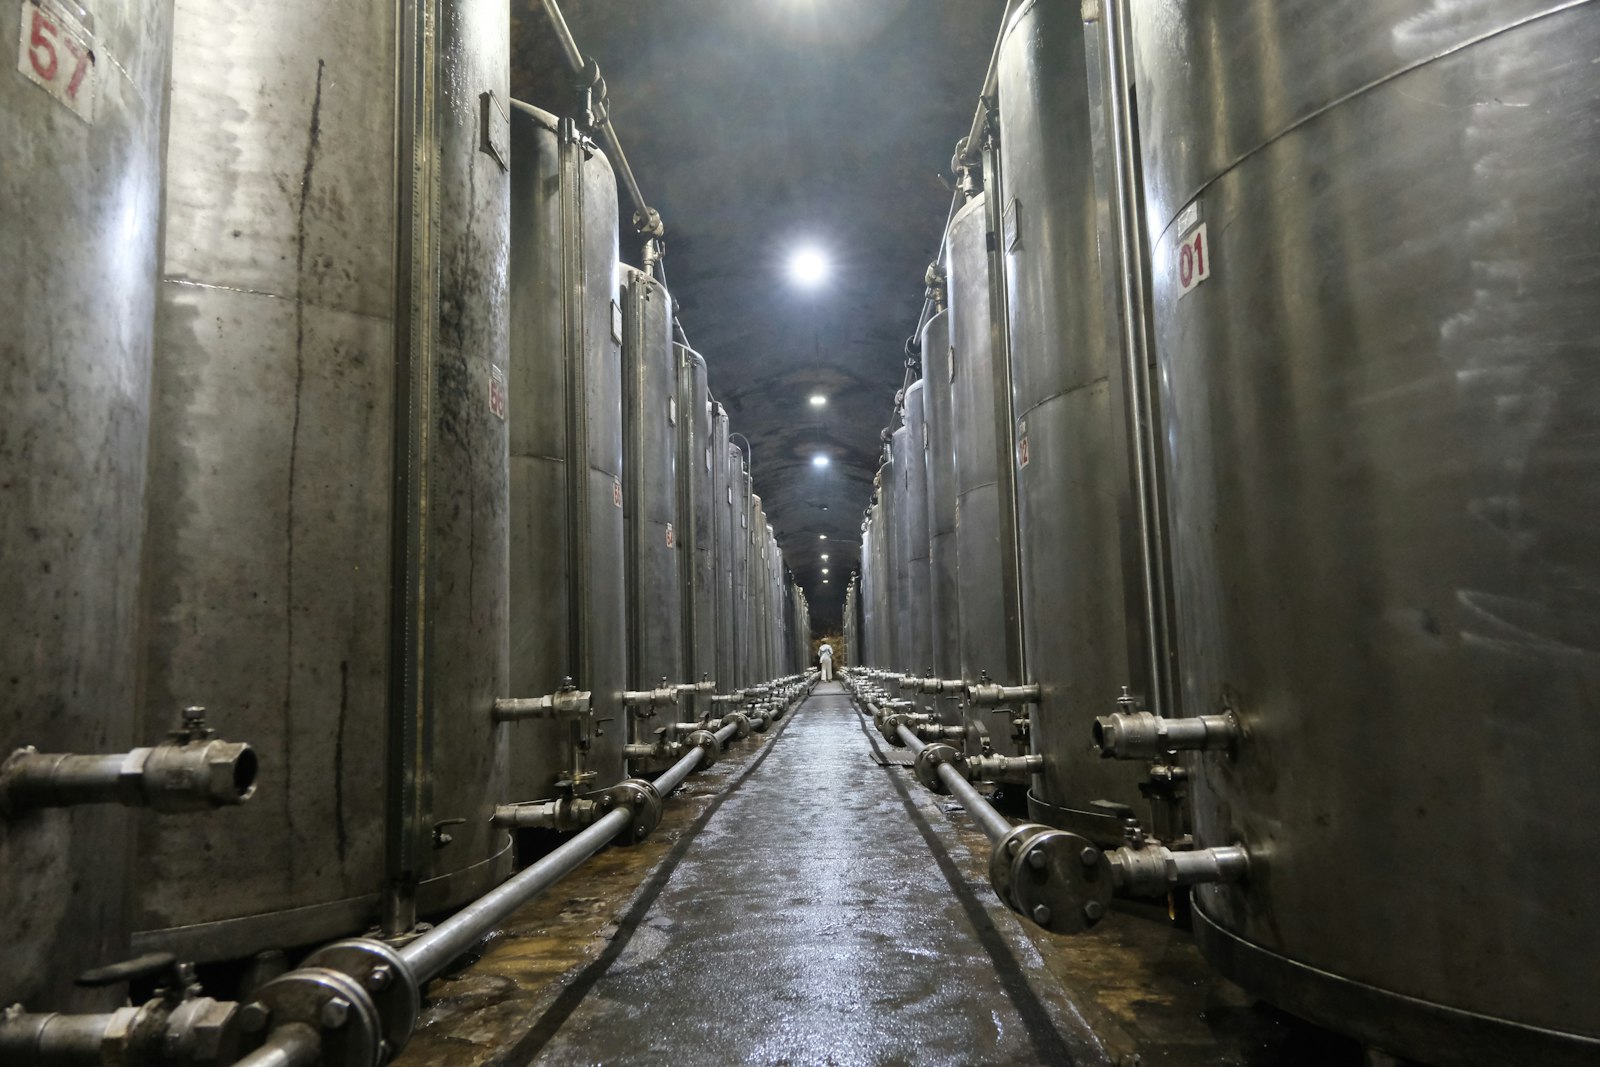
Stops failures before they happen
Rising vibration, a new sound signature and energy drift schedule maintenance through your CMMS, so failures become planned work.
Learn more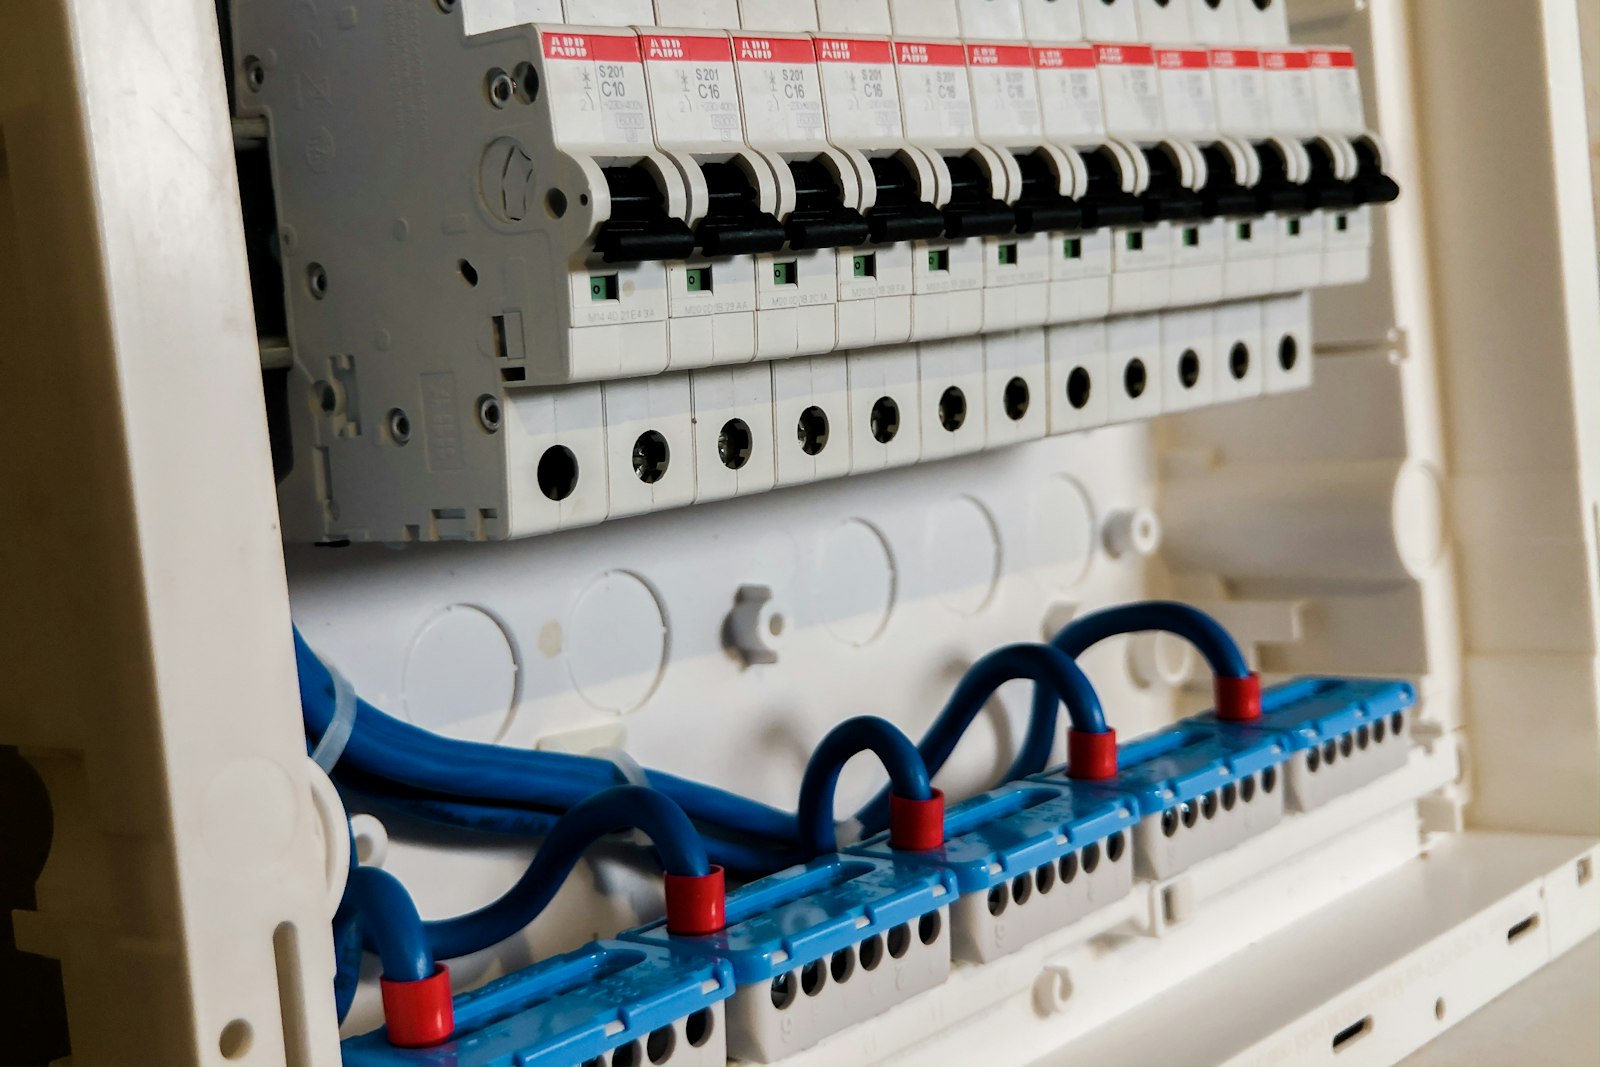
Every feeder on one single line
Grid, generation and distribution shown live, with power factor and loading per feeder, so electrical losses have an address.
Learn more
The real air curve during production
Particulates and VOCs tracked by zone while lines run, with exposure recorded in zone hours rather than a single reading.
Learn moreGuides for FMCG and process plants
Three guides to the utilities that drive cost on a plant floor.
FMCG campuses
Water, power, steam and air measured per business unit, ranked by use per tonne or litre.
Learn moreCompressed air and steam
Leak load, specific power, failed steam traps and condensate return, priced per month.
Learn moreProcess water and utilities
A live process water balance to ZLD, with power factor and maximum demand per feeder.
Learn moreHow a manufacturing rollout runs
Start with one high intensity unit, prove it, then scale.
Survey one unit
Map meters, panels and taps, check wireless coverage and pull 12 months of water and power bills.
Plan and sign off
A sensor list, gateway layout and water balance model go to the plant team for sign off.
Meter without stopping production
Non intrusive flow, pressure, level and power sensors go in through partners in phases.
Go live and verify
The digital twins go live, first losses are named and priced, and each fix is verified at the meter.
Scale in waves
Each new unit follows the same template until the whole site sits on one portfolio.
A 300-acre FMCG manufacturing campus on Aqueduct
8 business units, from grain milling and dairy to beverages, edible oils and personal care, scoped to start with one pilot plant.
Read the FMCG campus case study
One live view of water and energy across 8 business units, starting with the beverages plant.
Learn morePredictive maintenance
Early signs of failure on compressors, pumps and fans, scheduled through your CMMS.
Learn moreNine utility systems, and what each one hides.
A plant measures yield to several decimal places, then receives its utilities as one number on a monthly bill. Click a system to see where loss sits, what gets metered and what Aqueduct does with it.
Process and service water
Leaks, tank overflows, idle draw and hoses left running. The loss is never reported because nobody calculates a balance.
Intake by source, flow per unit and per line, tank levels.
aQ WaterGuard balance where unaccounted loss is an explicit term, ranked by unit and per unit of output.
Electrical distribution
Power factor penalties and demand peaks are found on the invoice weeks after the event that set them.
Incomer, transformer and feeder load, power factor, demand interval data.
Peaks traced to the feeders and loads that caused them, and power factor exposure flagged before billing.
Steam and boiler fuel
Failed traps pass live steam, condensate goes to drain, and blowdown runs on habit.
Fuel input, steam flow, condensate return, feedwater make-up, blowdown.
One thermal balance from fuel to condensate, so a failing trap or lost return shows up as a gap.
Compressed air
Leaks run around the clock and cannot be heard over a production floor.
Compressor kW, flow, header pressure, off-shift demand.
Off-shift demand used as the leak signature, with each leak survey valued in kWh and money.
Cooling and chilled water
Fouling erodes efficiency slowly; tower make-up and blowdown are rarely metered.
Chiller power, delta T, flow, tower make-up and blowdown.
kW per ton trended against load and weather, with tower water in the site balance.
RO and water treatment
Reject goes to drain, and recovery falls as membranes foul without anyone tracking it.
Feed, permeate and reject flow, conductivity, pressure.
Recovery and fouling trended per train, with reject available as a measured reuse source.
Effluent, ETP and STP
Shock loads arrive with no known cause; reuse is reported without a meter behind it.
Inflow and outflow, reuse volume by end use, key quality points where installed.
Load events correlated to the upstream line that caused them, and reuse quantified by destination.
Solar and captive generation
Self-use against export is not managed in real time, and avoided cost is not booked.
Generation, self-consumption, export, grid import.
Generation valued in money and carbon against grid import for the ESG ledger.
Plant air and environment
Conditions in halls and warehouses are assumed, and ventilation runs to a fixed schedule.
CO2, PM2.5, VOC, temperature and humidity per zone.
aQ AirSafe records the real exposure curve during production, against the ventilation energy it costs.
The utilities that leak the most and alarm the least.
of a compressor's output can be lost to leaks in a poorly maintained system
Source: Fact Sheet 7: Compressed Air System Leaks, Compressed Air Challengeleakage is the expectation for a well maintained compressed air system
Source: Fact Sheet 7: Compressed Air System Leaks, Compressed Air Challengeof installed steam traps may have failed in a system not maintained for three to five years
Source: Inspect and Repair Steam Traps, Steam Tip Sheet 1, US DOEof traps leaking is the expectation with a regular inspection program
Source: Inspect and Repair Steam Traps, Steam Tip Sheet 1, US DOEFive equations that turn a plant into a system you can audit.
Threshold alarms on single sensors produce noise that plants learn to ignore. A balance is different: a leak, a stuck valve, an unlogged washdown and a fouled exchanger all show up as an equation that stops adding up.
Supply equals use plus loss
Supply equals process plus utilities plus RO feed plus fire plus unaccounted loss. When that last term rises, something changed, whether or not anyone wrote a rule for it.
- Intake by source: municipal, borewell, tanker, recycled
- Consumption per unit and per line
- Loss as a named, trended term
- Measured
- flow at intake, unit boundaries and major users
- Target
- your loss baseline per unit
- Aqueduct
- aQ WaterGuard twin, reconciled continuously
Fuel in, steam out, condensate back
Boiler fuel should match steam delivered plus known losses, and condensate return should hold its ratio. A drop in return or a rise in make-up points to traps, leaks or condensate going to drain.
- Fuel to steam efficiency per boiler
- Condensate return ratio per area
- Blowdown against feedwater quality
- Measured
- fuel, steam flow, condensate, feedwater, blowdown
- Target
- your return ratio and boiler efficiency
- Aqueduct
- thermal gap valued in fuel, water and chemicals
The incomer equals the feeders
The feeders must add up to the incomer, less known transformer and distribution losses. An unexplained gap is an unmetered load or a fault, and it shows up on the single line diagram.
- Electrical single line, live
- Peak demand per feeder
- Power factor per board
- Measured
- incomer, transformers, feeders, MCCs
- Target
- your contract demand and power factor
- Aqueduct
- aQ EnergySmart single line with peaks traced
Air generated equals air used
With lines stopped, demand should fall close to zero. What remains is leakage, and it can be valued every night without a single ultrasonic survey.
- Off-shift demand as the leak signature
- Specific power per compressor
- Header pressure against what the users need
- Measured
- compressor kW, flow, pressure
- Target
- your off-shift baseline
- Aqueduct
- leak cost per night, ticketed for repair
Recovered water, counted by destination
STP output, RO reject, cooling blowdown and condensate are all recoverable and often claimed without a meter. The ledger counts each source and where it went.
- Reuse by source and by end use
- Recovery trend per RO train
- Volumes ready for disclosure
- Measured
- treated outflow, reject, blowdown, return
- Target
- your reuse commitment
- Aqueduct
- reuse that holds up to an assurance question
The engineering is identical everywhere. The evidence each market asks for is not.
Summarized for orientation, not legal advice. In each case Aqueduct supplies measured records; the reporting entity, assurer or authority does the rest.
| Market | What is being asked | What Aqueduct supplies |
|---|---|---|
| United States | ISO 50001 energy performance indicators and DOE Better Plants reporting, both built on sub-metered data | Line and plant level energy and water, normalized per unit of output |
| UAE | Demand reduction under Dubai's Demand Side Management strategy, with cooling and desalinated water at the center | Cooling and water allocated by zone and process, per asset |
| India | BRSR Core intensity metrics with reasonable assurance, the Carbon Credit Trading Scheme, and pollution board discharge returns | One measured source feeding the filing, the annual report and the carbon obligation |
| All markets | Water disclosure frameworks such as GRI 303 and CDP Water | Withdrawal, consumption, discharge and reuse by source, with timestamps |
One unit, one quarter, then the campus in waves.
Pick a self-contained, high intensity unit with one supply, one discharge and one energy feed. A clean first balance is what earns the second unit. On a 300-acre FMCG manufacturing campus, that is how every unit came to be compared on one standard.
Survey and balance model
Walk the pilot unit: meters, panels, air lines, boilers, cooling and reuse loops. Twelve months of bills loaded. The balance model and sensor list come back for your sign-off. Production never stops.
Phased metering
Clamp-on flow meters, current transformers and surface temperature sensors fitted. PLC and SCADA data read where it exists. Any inline meter waits for a planned shutdown.
Twin live, first losses named
The unit's balances reconcile. Leaks, idle draw, failed traps and peaks are named, valued and ticketed into your CMMS.
Expand and automate
The next highest intensity units join. Smart Controls take on pumps, VFDs and AHUs where control is enabled, with owner approval. Then one campus view, ranked per tonne or per liter of output.
Utilities with an owner, a number and a daily report.
Plant manager
Utility cost per unit of output by line and shift, next to the production numbers you already run on.
Utilities engineer
Water, thermal, electrical and air balances that show where the gap opened and when.
Learn moreMaintenance manager
Failing compressors, traps and pumps found early by aQ PredictIQ and scheduled through your CMMS.
Learn moreEHS lead
The real exposure curve in production halls, and discharge records ready for the pollution board.
Learn moreSustainability lead
Water and energy intensity and reuse volumes that trace back to meters, ready for assurance.
Learn moreCFO
Losses stated in money with a payback, and savings confirmed at the meter against a weather-normalized baseline.
Learn moreProven in live sites across sectors.
Anonymized results, verified at the meter.
sites in 21 countries run on Aqueduct.
and 9 clinics in one of India’s top hospital chains.
US airport running water intelligence on Aqueduct.
of commercial real estate under Aqueduct.
Features that matter here
Common questions
No. Aqueduct works alongside SCADA and historians. It reads their data; control stays with SCADA.
Both, and they are different. FDD finds, diagnoses and fixes faults that have happened. Predictive maintenance stops failures before they happen.
Yes, on-prem, with AI on NVIDIA infrastructure.
Losses that run when production does not: compressed air demand on a stopped line, water flow in an idle unit, a boiler holding pressure for nobody. Off-shift data is the cleanest signature a plant has.
No. Most flows can be read with clamp-on ultrasonic meters and current transformers without breaking a pipe or a circuit. Inline meters are used only where clamp-on is not viable, and they are fitted during a planned shutdown.
Yes. Each unit is normalized per tonne or per liter of output, so a small, intense plant cannot hide behind a large one and the efficient unit gets credit.
Each recovered stream, such as STP output, RO reject, condensate and blowdown, is metered at source and at destination. The reuse figure is then a sum of measured volumes, not a design assumption.
Yes. CIP circuits, refrigeration, boilers and process water are instrumented as one system. A major dairy operation runs on Aqueduct, alongside other major dairy operations.
See Aqueduct on your own facility.
Bring a site, a utility bill or a question. We will show you where the loss is.