Data centers where cooling, power and water are one picture.
Halls, chiller yards and electrical rooms on one platform. PUE and WUE from measured inputs, cooling faults fixed early, and water for cooling accounted for.
See cooling, power and water as one picture, and fix drift before an incident.
CRAC, chiller and pump drift caught before it becomes an incident
- Drift against baseline
Each cooling unit is compared with its own baseline, so slow drift is caught before inlet temperatures rise.
- Early signs of failure
Vibration, sound signature and energy drift on pumps and chillers schedule maintenance before the failure.
- Routed with the cause
Findings arrive in your CMMS with the likely cause and fix, and close when temperatures confirm it.
IT load, cooling and losses per hall, continuously
- Live single line
Utility supply, generators, UPS and feeders are drawn live, with loading and power factor on each.
- Measured, not modeled
PUE is calculated from metered IT and facility load, not from a design spreadsheet.
- Peak demand watched
Peak demand is tracked per hall, so new capacity is planned against measured headroom.
Make-up, blowdown and cycles accounted for per tower
- Tower balance
Make-up, blowdown and evaporation reconcile per cooling tower, so water loss has a tower and a cause.
- WUE from meters
Water use effectiveness is calculated from metered cooling water, ready for monthly reporting.
- Thermal envelope
Inlet temperature and humidity by aisle are tracked against the recommended envelope, around the clock.
Running a data center, before and after Aqueduct
- A CRAC unit drifts for weeks until an aisle runs hot.
- PUE is calculated once a quarter from a spreadsheet.
- Cooling tower water is one line on the utility bill.
- Electrical, mechanical and water data sit in separate tools.
- Maintenance waits for the vendor's next scheduled visit.
 The Aqueduct way
- CRAC drift is caught against baseline before the aisle warms.
- PUE is calculated continuously from measured inputs.
- Cooling water is reconciled per tower, with WUE from meters.
- Power, cooling and water sit on one platform.
- Early signs of failure schedule maintenance before an incident.
What data centers teams are up against.
Water, energy, air and operations carry equal weight. Each one runs the same loop: monitor, measure, identify, act, verify.
Water: Cooling water you can account for
Make-up, blowdown and cycles per tower. WUE from meters.
Energy: PUE from measured inputs
IT load, cooling and losses per hall, continuously.
Air: Thermal conditions by aisle
Inlet temperature and humidity against the recommended envelope.
Operations: Cooling faults before they become incidents
CRAC, chiller and pump drift caught early.
Problem, solution, impact.
How Aqueduct resolves each problem for data centers, and what changes when it does.
Make-up, blowdown and cycles per tower. WUE from meters.
A live water balance across meters and sub-meters localizes the loss, routes the fix and confirms it closed at the meter.
Loss found from the balance, not the bill, and every fix verified.
IT load, cooling and losses per hall, continuously.
Weather-normalized baselines per building and asset show the waste in money; schedules and setpoints adjust where control is enabled.
Savings stated in money and confirmed at the meter, not estimated.
Inlet temperature and humidity against the recommended envelope.
Air quality per zone, overlaid with occupancy, with ventilation raised when it matters and verified back in range.
Targets held during occupied hours, with the energy cost counted.
CRAC, chiller and pump drift caught early.
Faults diagnosed in plain language and routed into your CMMS with the fix; early signs of failure schedule maintenance first.
Fewer reactive call-outs and closures confirmed by the equipment.
One incident, from first signal to verified fix.
An illustrative example of the flywheel on a typical site.
Power meters, CRAC and chiller points, aisle sensors, tower meters.
Baselines per hall and per cooling asset.
CRAC-2 drifting from baseline; cold aisle 3 inlet rising.
Ticket routed with the cause. Setpoints adjusted where control is enabled.
Inlet back in the envelope. Energy per unit of IT load confirmed.
Four connected products on one data layer.
Cooling, power and water should be one picture, because they fail together.
Talk to our teamReplace what should be replaced. Connect the rest.
- BMS
- Energy and power monitoring
- Water management for cooling
- DCIM
- CMMS
- Electrical power monitoring systems
Three equal ways in: keep your BMS, replace it, or build Aqueduct in at design stage.
The questions each seat asks first.
“Will it warn me before a cooling fault becomes an incident?”
“Are PUE and WUE measured or estimated?”
“Can it be specified into the next hall?”
Standards and regulations we supply evidence for.
We supply the measured inputs. You run the program and file the report.
Where teams put it to work
Cooling faults before incidents
CRAC, chiller and pump drift found against baseline and routed with the cause, so a warm aisle never reaches the customer.
Learn more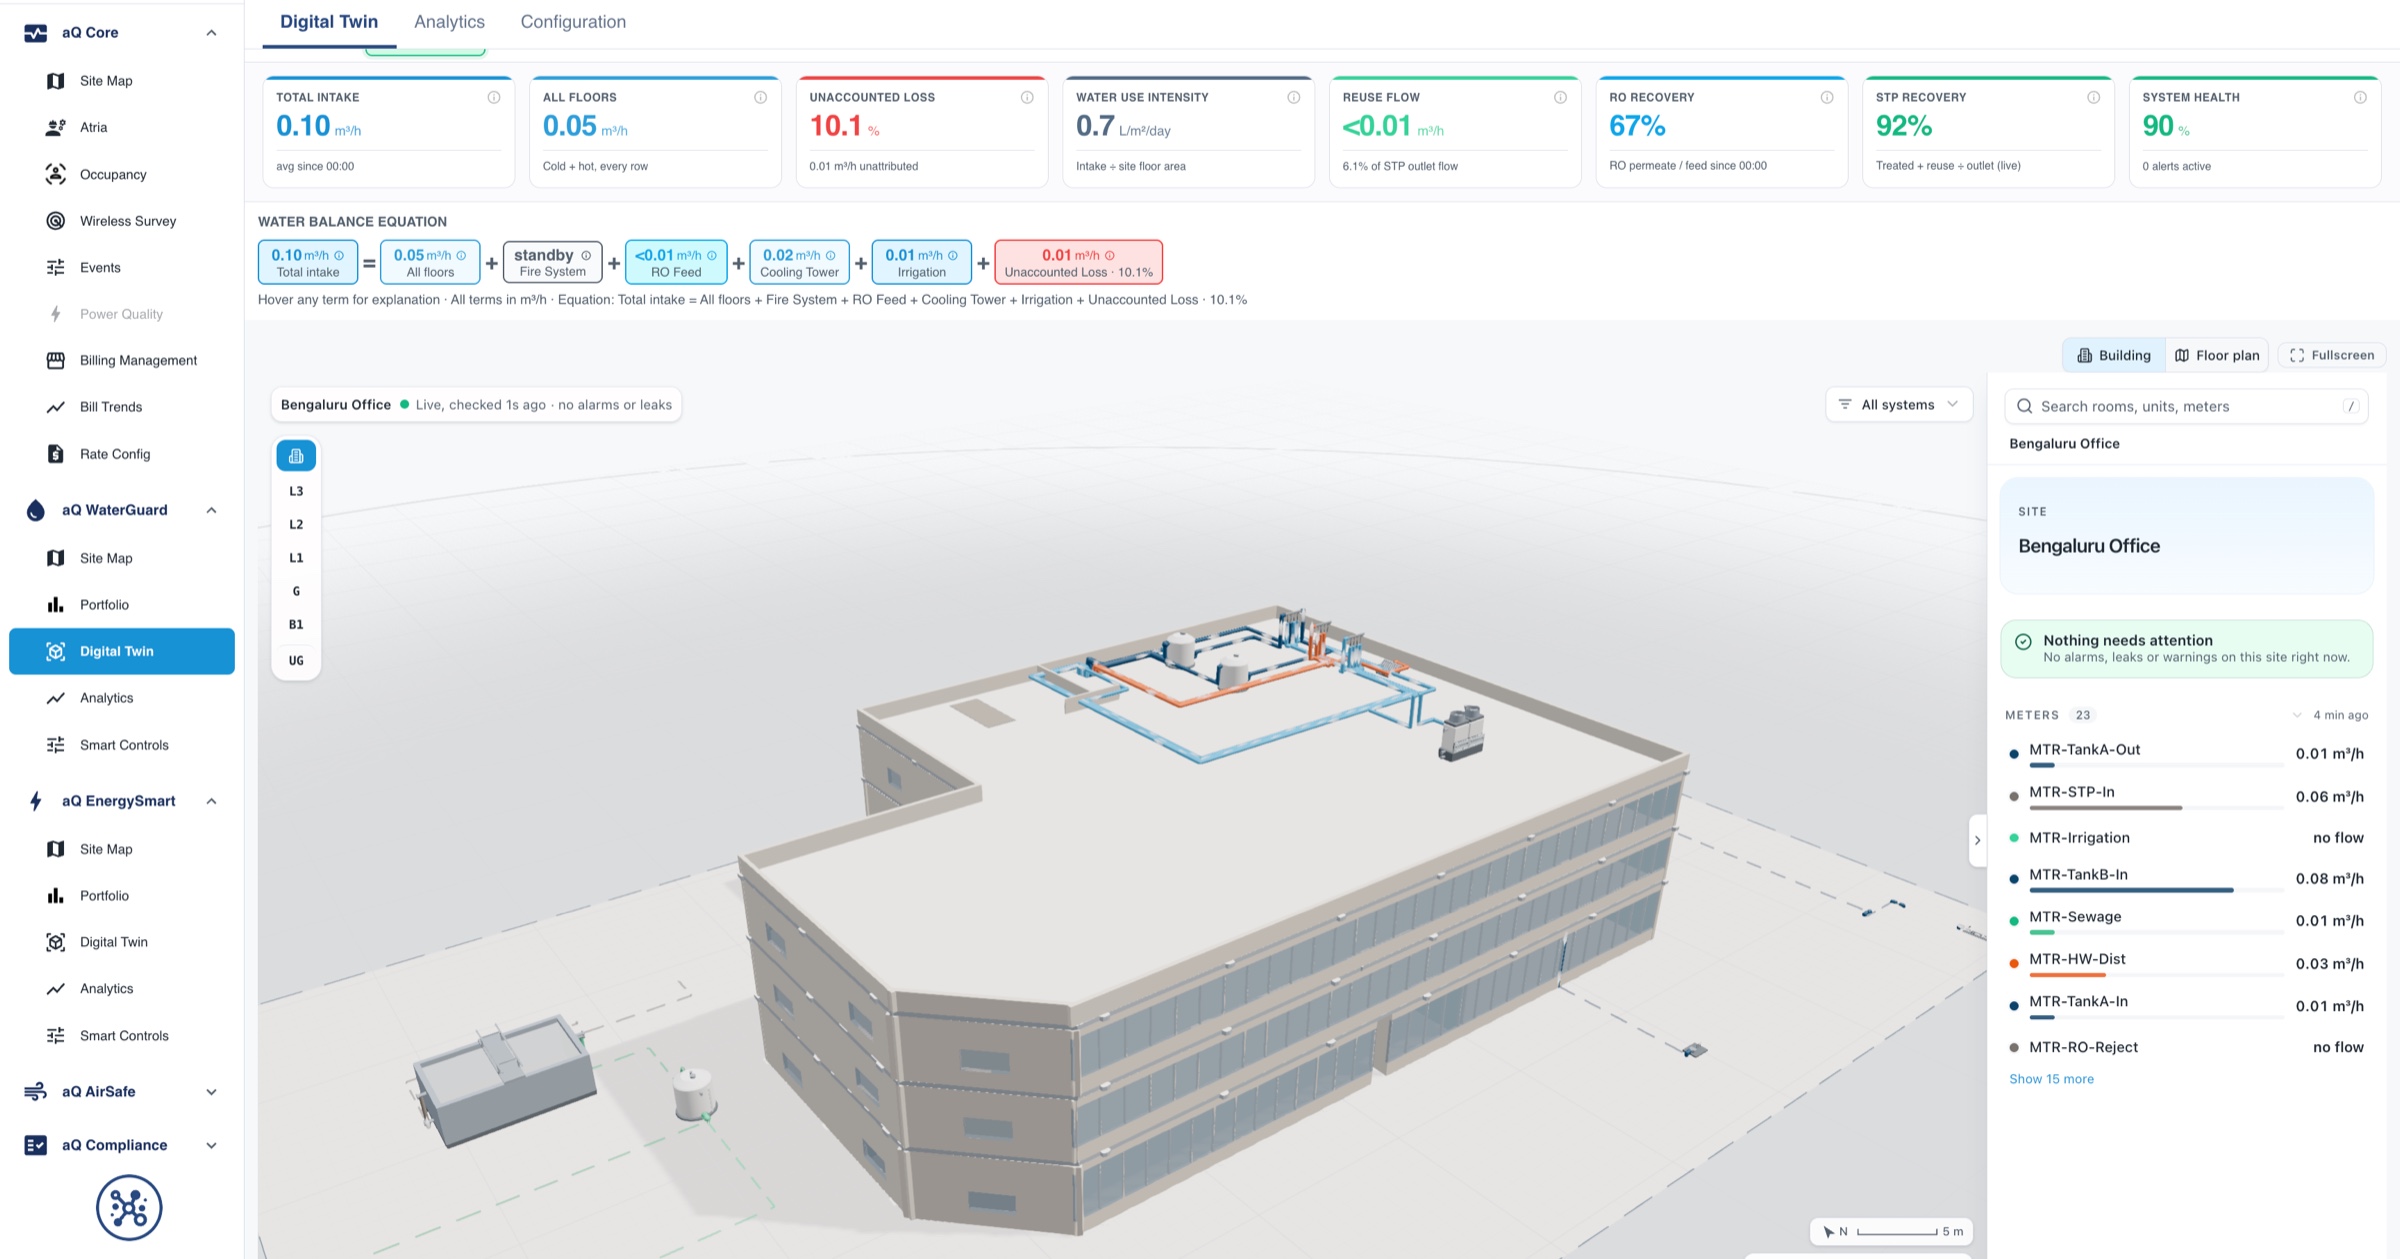
Headroom from measured load
IT and facility load measured per hall, so capacity decisions rest on real peak demand rather than nameplate ratings.
Learn more
WUE and PUE you can defend
Water and energy metrics from meters, exported monthly for reports and certifications, with the method behind every number.
Learn moreWhy measured efficiency now matters
of electricity used by data centers worldwide in 2024
Source: Energy and AI, International Energy Agencyprojected growth in data center electricity use by 2030
Source: Energy and AI, International Energy Agencyaverage annual PUE reported by operators in the 2024 survey
Source: Uptime Institute Global Data Center Survey 2024Where power, cooling and water are lost in a data center
Every unit of IT load carries overhead from the electrical chain and the cooling plant. These are the points we meter to make that overhead visible.
Utility incomer and switchgear
Transformer and distribution losses absorbed into total facility load, and power factor penalties nobody traces.
kWh, kW, kVA and power factor at each incomer and main switchboard.
Draws the live single line and separates distribution losses from load.
UPS
UPS running at low load, where conversion efficiency is worst, often because redundancy is sized for future halls.
Input and output energy per UPS module.
Calculates measured UPS efficiency and flags modules running inefficiently at low load.
PDUs and RPPs
IT load known only at the UPS, so per-hall and per-customer use is estimated.
Branch and PDU level energy, read from intelligent PDUs or added meters.
Attributes IT load to hall, row or customer, so partial PUE is real.
Generators
Test runs and block heaters drawing energy all year, rarely counted in facility overhead.
Run hours, test load and auxiliary energy.
Counts generator auxiliaries in the overhead and keeps the test record.
Chillers
Chillers staged conservatively, low chilled water temperatures held out of habit, and economizer hours missed.
Chiller energy with chilled water flow and temperatures.
Tracks delivered efficiency against load and weather, and flags drift.
CRAH and CRAC units
Units fighting each other on humidity, or running at full fan speed to cover a hot spot elsewhere.
Unit energy, supply and return temperatures, rack inlet conditions.
Compares each unit with its own baseline and finds units working against each other.
Cooling towers
Make-up and blowdown well above what evaporation needs, from low cycles or a stuck valve.
Make-up, blowdown and conductivity where available.
Reconciles each tower and calculates WUE from meters.
Pumps
Constant speed pumps or valves throttled against the pump, wasting energy every hour.
Pump energy and flow, with vibration on critical pumps.
Flags efficiency loss and early signs of mechanical failure.
White space conditions
Overcooling to protect against a few hot racks, so the whole hall runs colder than needed.
Inlet temperature and humidity by aisle and rack.
Shows the real inlet envelope, so setpoints can rise where it is safe.
Efficiency metrics, calculated from measured inputs
Each metric is only as good as the meters behind it. These are the inputs Aqueduct uses, so the number can be traced back to a device.
| Metric | How it is calculated | Measured inputs |
|---|---|---|
| PUE | Total facility energy divided by IT energy (ISO/IEC 30134-2) | Incomers and generators for total, UPS output or PDUs for IT |
| Partial PUE | Overhead for one hall or subsystem divided by its IT energy | Hall level cooling and electrical meters, PDU totals per hall |
| WUE | Site water used divided by IT energy (ISO/IEC 30134-9) | Cooling tower make-up, humidification and domestic water meters |
| CUE | Carbon from total facility energy divided by IT energy (ISO/IEC 30134-8) | Total energy by source, with the grid emission factor you report against |
| UPS efficiency | UPS output energy divided by input energy | Input and output meters per UPS module |
| Thermal envelope | Rack inlet conditions against the ASHRAE recommended range | Inlet temperature and humidity sensors by aisle |
One record for every team in the building
Data center teams work from different tools: DCIM for IT, BMS for mechanical, EPMS for electrical. Aqueduct puts the utility picture in one place without replacing any of them.
Facility engineering
The team needs cooling faults caught before an aisle warms, and electrical issues before they trip anything.
- Drift per unit against its own baseline
- Faults routed into the CMMS with the likely cause
- Fix verified when conditions and energy return to baseline
- Measured
- cooling, electrical and environmental points
- Target
- stable conditions at the lowest overhead
- Aqueduct
- fault detection, diagnosis and verified closure
Capacity planning
New deployments need measured headroom in power and cooling, not nameplate figures.
- Peak demand per hall and per UPS
- Cooling headroom from delivered load
- Trends that show when a hall will run out
- Measured
- peak kW per hall, cooling load
- Target
- safe headroom for the next deployment
- Aqueduct
- headroom from measured peaks, not design values
Sustainability and reporting
PUE, WUE and carbon figures go to customers, investors and regulators. They need to trace to a meter.
- Continuous PUE and WUE, not quarterly spreadsheets
- Energy by source for carbon reporting
- Exports for annual and customer reports
- Measured
- energy and water at every input
- Target
- reported figures that survive an audit
- Aqueduct
- supplies measured evidence for each metric
Colocation customer reporting
Colocation customers ask for their own energy and environmental data. Measured per-customer use makes the report and the bill agree.
- IT energy per customer from PDU data
- Environmental conditions in each cage
- One set of numbers for billing and reporting
- Measured
- per customer power and conditions
- Target
- transparent, agreed figures
- Aqueduct
- exports per-customer data to your systems
Finance
Large electricity bills with demand charges and complex tariffs need checking before they are paid.
- Bills validated against meters
- Overhead cost per hall stated in money
- Forecasts from weather-normalized use
- Measured
- consumption and demand
- Target
- accurate cost of overhead
- Aqueduct
- bill validation and savings in money
One hall first, then the campus
Data centers change cautiously. The rollout starts read-only, on one hall, with no change to live systems.
Read-only connection
Connect to BMS, EPMS and existing meters over BACnet, Modbus and SNMP, read-only. No control path is opened.
First hall, fully measured
Fill metering gaps on one hall so total, IT and cooling energy and water all trace to devices. Partial PUE and WUE start calculating.
Baselines and first findings
Each cooling unit, chiller and pump baselined against load and weather. Units working against each other and overcooled aisles are the usual first findings.
Act and verify
Findings routed to the CMMS. Setpoint changes are made by your team, and Aqueduct verifies the result. Aqueduct acts directly only where control is enabled, with owner approval.
Campus and portfolio
Further halls and sites added on the same model, so PUE and WUE compare like with like across the portfolio.
Proven in live sites across sectors.
Anonymized results, verified at the meter.
sites in 21 countries run on Aqueduct.
and 9 clinics in one of India’s top hospital chains.
US airport running water intelligence on Aqueduct.
of commercial real estate under Aqueduct.
Features that matter here
Common questions
No. Aqueduct integrates with DCIM. It covers the facility side: cooling, power distribution, water and air.
Yes. Build it in at design stage with architects and MEP engineers.
In your region, or on-prem on your own site.
No. Aqueduct runs read-only by default. It acts only where control is enabled, with owner approval, and every command is logged.
Yes. UPS systems, intelligent PDUs and many environmental sensors are read over SNMP, alongside BACnet and Modbus for mechanical and electrical plant.
From metered water: cooling tower make-up, humidification and other site water, divided by measured IT energy. Each tower is also reconciled so a loss has a location.
It shows where inlet conditions leave headroom to raise setpoints, and verifies the effect after your team makes the change. Where control is enabled, with owner approval, changes can be applied through Smart Controls with a logged command history.
Yes. IT energy and conditions can be attributed per customer from PDU and cage sensors, and exported for billing and customer reports.
See Aqueduct on your own facility.
Bring a site, a utility bill or a question. We will show you where the loss is.