LoRaWAN air quality sensors that measure every zone, indoors and out
A LoRaWAN air quality sensor is a battery or wired device that measures conditions such as temperature, humidity, CO2, VOC, PM2.5 and PM10 and reports them over long-range radio. Aqueduct reads these sensors by zone, overlays them with occupancy and turns sustained exposure into recommended actions. Bundles range from basic comfort to specialized gases, vaping and radon.
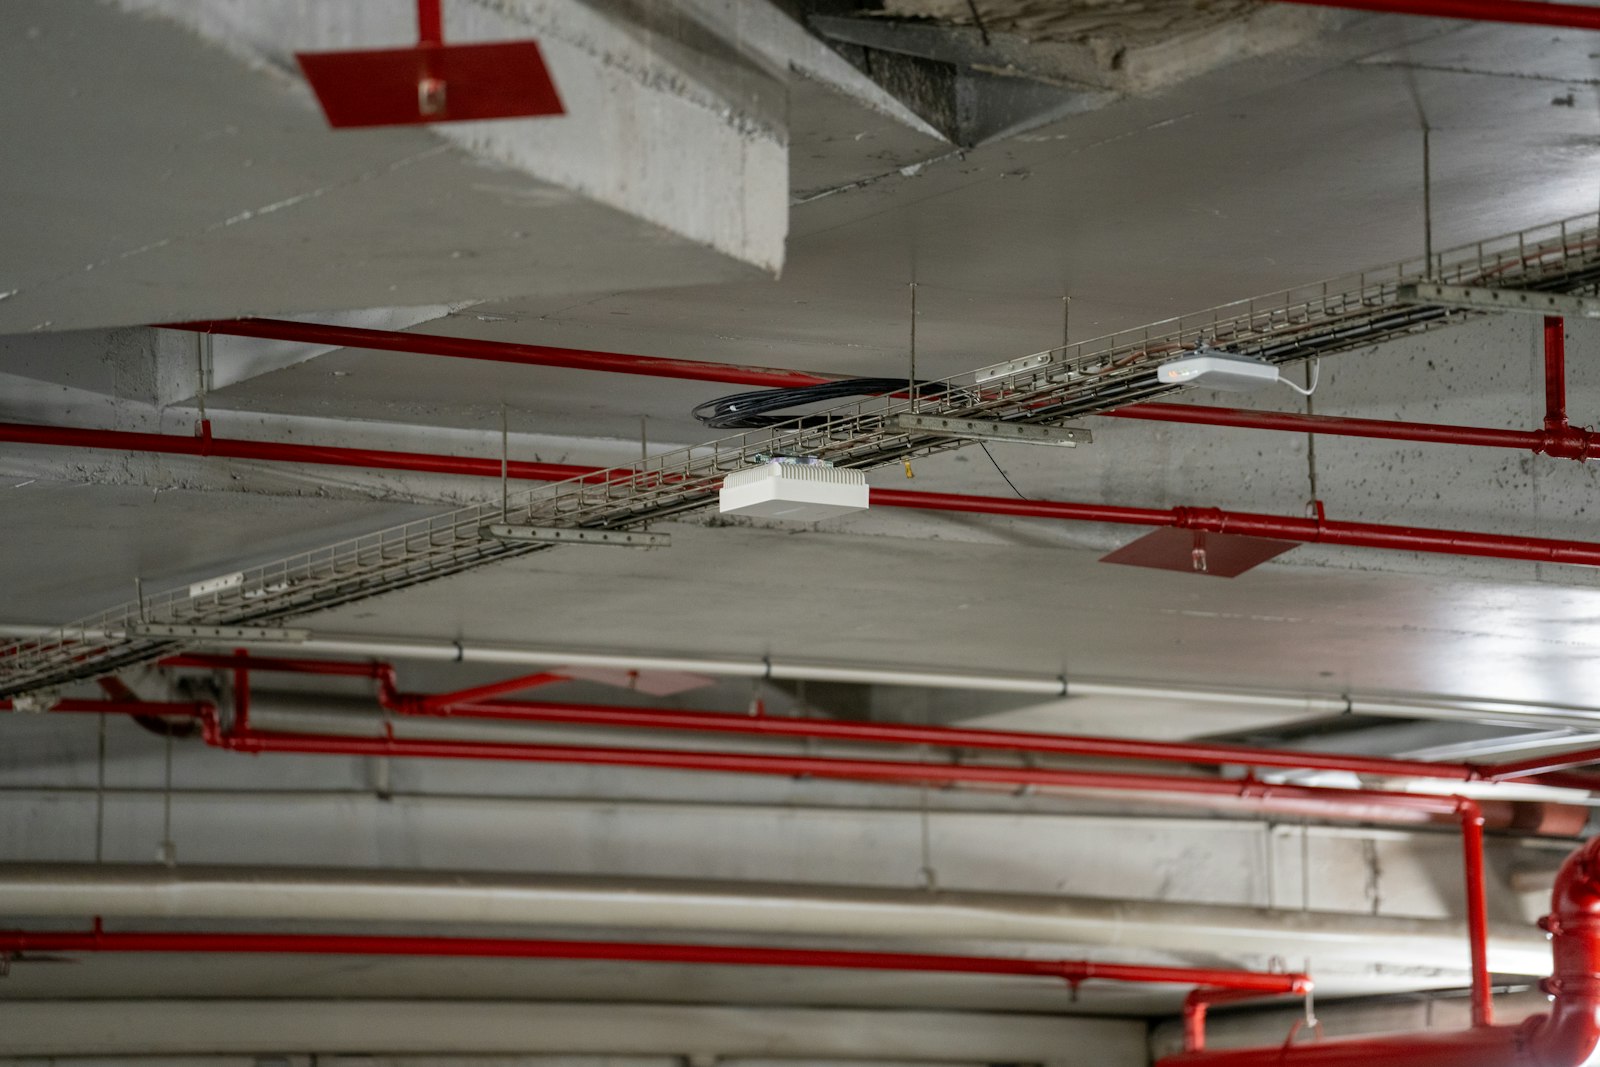
Measure the air people actually breathe, zone by zone, and act while it matters.
From basic comfort to specialized gases in one family
- Comfort first
Temperature and humidity give heat index, the most common comfort signal in any occupied building.
- Air quality basics
CO2, VOC, pressure, PM2.5 and PM10 cover ventilation, off-gassing and particulates in one device.
- Specialized gases
CO, NO2, O3, SO2, formaldehyde, H2S, ammonia and radon are added only where a site needs them.
Exposure tracked over time, not a single peak reading
- Zone-hours tracked
CO2 exposure is counted in zone-hours, because a level sustained over time is what harms occupants.
- Occupancy overlay
PIR occupancy or schedules show whether anyone was in the zone when the reading climbed.
- Min, max, average
Each zone shows its band over time, so short spikes are told apart from long excursions.

A plain-language finding with the fix behind it
- Standards referenced
Air health ratings cite the guideline behind them and explain why the zone was rated that way.
- Weather aware
Recommendations consider outdoor conditions, such as raising fresh air when outdoor air is mild.
- Control where enabled
Ventilation changes run through connected equipment only where control is enabled, with owner approval.
Air quality sensing, before and after Aqueduct
- Air is tested once a year on a quiet day.
- A handheld CO2 reading says nothing about who was there.
- Cleaning spikes and real problems look identical on a chart.
- Each sensor brand needs its own app and login.
- Complaints about stuffy rooms are the only alarm.
 The Aqueduct way
- Sensors report continuously while the building is actually in use.
- Occupancy overlays show whether anyone was breathing that air.
- Peak size and duration separate cleaning from persistent sources.
- Every sensor reports into one Aqueduct view of zones.
- Zone alerts and recommendations arrive before the complaints.
Air quality sensor bundles and data points
Data points are bundled by what devices in each category commonly report. The exact device is chosen per site.
| Device type | Data points |
|---|---|
| Occupant Comfort | Temperature, humidity |
| Occupant Comfort Plus | Temperature, humidity, CO2, PIR occupancy, sound |
| Air Quality, Basic | Temperature, humidity, CO2, VOC, pressure, PM2.5, PM10 |
| Air Quality, Vaping | Basic data points plus smoking, vaping and e-cigarette emissions |
| Air Quality, Air Pollutants | Basic data points plus CO, ammonia, hydrogen, ethanol, methane, propane, iso-butane |
| Air Quality, Bathroom Monitor | Basic data points plus bathroom odors (H2S, methane), sound, PIR occupancy |
| Air Quality, Radon | Basic data points plus radon |
| Air Quality, Specialized Gases | Basic data points plus CO, formaldehyde (CH2O), SO2, NO2, O3, H2S, NH3 |
| Outdoor Air Quality | Temperature, humidity, pressure, O3, CO, SO2, NO2, PM2.5, PM10 |
| Outdoor Weather Station | Temperature, humidity, pressure, wind direction, rainfall |
What each measurement tells you
CO2
The most used ventilation signal. Elevated CO2 in an occupied zone points to too little fresh air.
VOC
Off-gassing from paints, adhesives, furniture and cleaning products. Cleaning and renovation create recognizable spikes.
PM2.5 and PM10
Fine and coarse particles from smoke, combustion, dust, pollen and mold spores. PM2.5 reaches deep into the lungs.
Specialized gases
CO for garages and plant rooms, plus O3, NO2, SO2, formaldehyde, ammonia and hydrogen sulfide where a site needs them.
Sound level
Minimum, maximum and average decibels per interval, never audio. A flat pattern can reveal an alarm or running machinery.
PIR occupancy
Passive infrared detects people in the zone, so air readings are judged against whether anyone is breathing them.
Protocols and connection
| Item | Detail |
|---|---|
| Radio | LoRaWAN to an Aqueduct LoRaWAN gateway |
| Wired and IP options | Ethernet or Wi-Fi devices through an IP gateway |
| Typical send interval | Battery LoRaWAN sensors usually report every 5 to 60 minutes |
| Placement | Each sensor speaks for a zone, the area its coverage radius serves |

Healthy air is measured where people sit, during the hours they are there.
Talk to our teamFeatures and use cases these sensors power
Indoor air quality monitoring
Zone and site air health with plain-language recommendations.
Learn moreWhere they are used
Any space where people work, heal, learn or gather.
Where teams put it to work
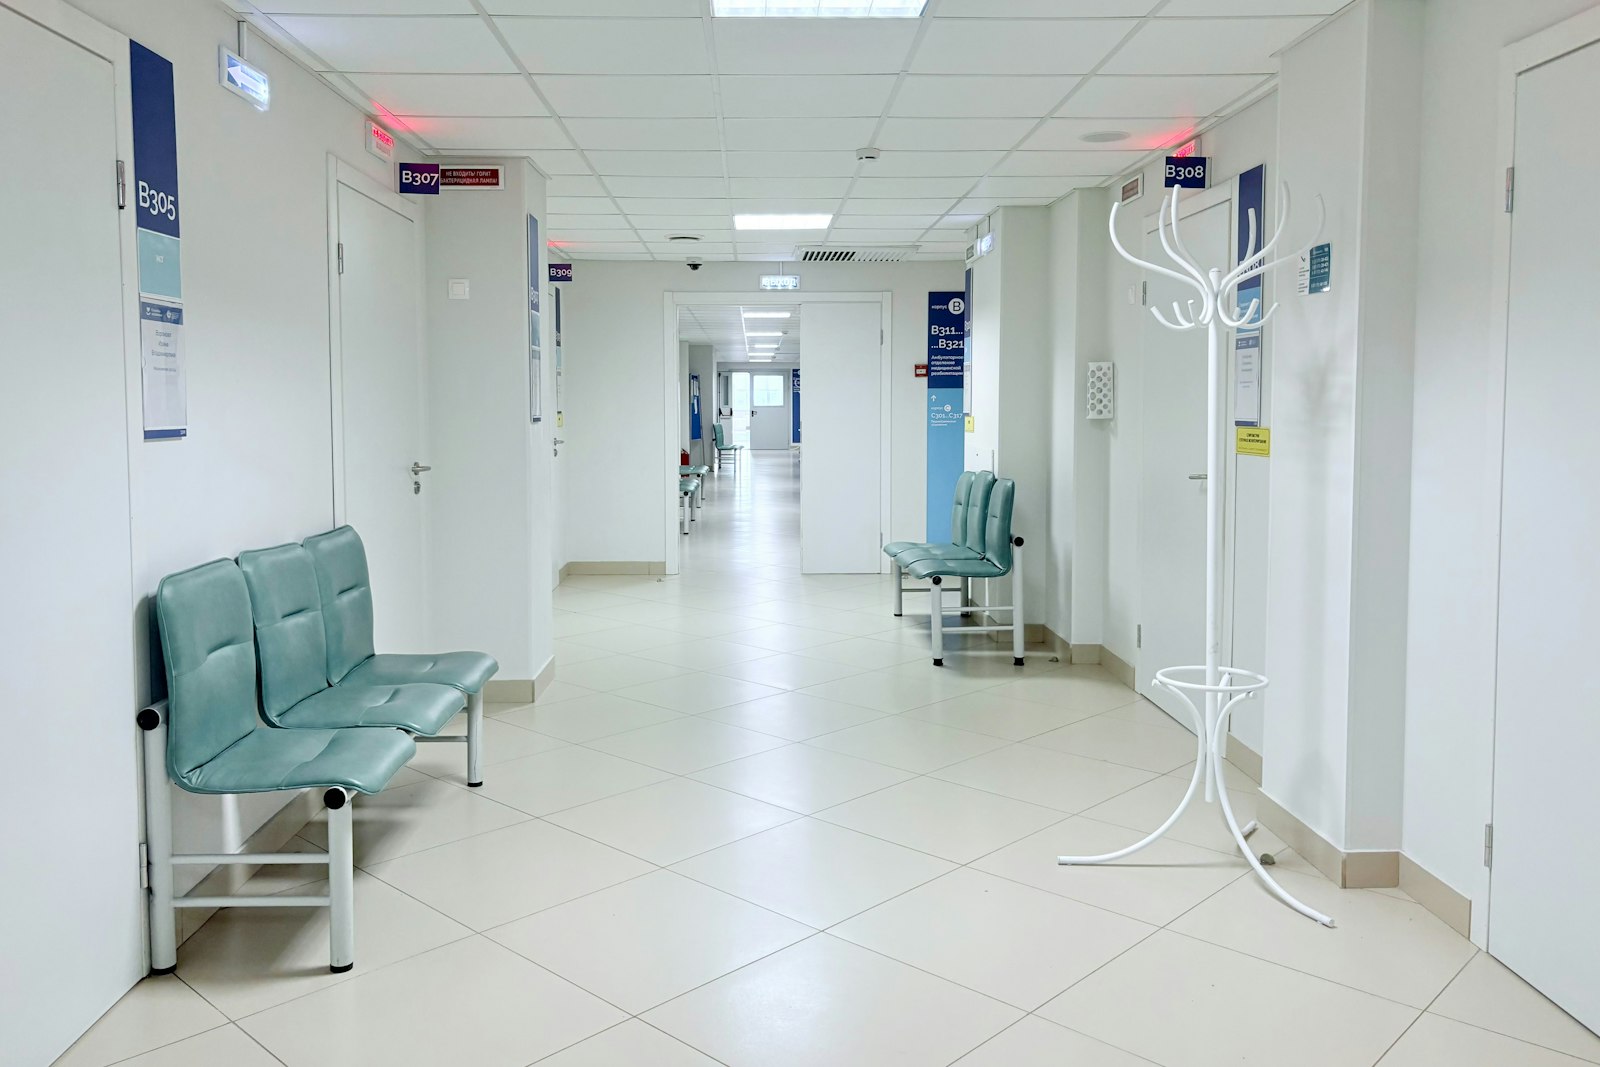
Continuous air evidence across wards and clinics
Zone sensors give infection control and facilities teams a continuous record of CO2, particulates and humidity, not a yearly snapshot.
Learn more
Ventilation checked in every occupied classroom
CO2 with occupancy shows which classrooms run short of fresh air during lessons, so ventilation fixes go where students are.
Learn more
Catch combustion gases at the loading dock
CO and CO2 sensors near docks reveal idling vehicles and poor extraction, and support ventilation changes where control is enabled.
Learn moreDevice agnostic, with leading manufacturers.
Exact make and model are selected per site. These are some of the manufacturers and standards Aqueduct works with.






sites in 21 countries run on Aqueduct.
and 9 clinics in one of India’s top hospital chains.
US airport running water intelligence on Aqueduct.
of commercial real estate under Aqueduct.
FMCG manufacturing campus.
operations run on Aqueduct.





Related
Common questions
It depends on the bundle. A basic Aqueduct air quality sensor reports temperature, humidity, CO2, VOC, pressure, PM2.5 and PM10, and specialized bundles add gases such as CO, NO2, O3, formaldehyde, H2S, ammonia or radon.
LoRaWAN is long range and low power, so battery sensors can cover a building or campus from a few gateways without running cable to every zone. Aqueduct also accepts Ethernet and Wi-Fi sensors through an IP gateway.
Yes. The vaping bundle adds smoking, vaping and e-cigarette emission detection to the basic air quality data points, and Aqueduct raises an alert by zone and site.
No. They measure sound intensity only and report minimum, maximum and average decibels per interval. No audio is recorded.
A CO2 reading in an empty room does not matter, the same reading in a full room does. Aqueduct overlays air data with PIR occupancy or schedules, and tracks exposure in zone-hours because duration matters as much as level.
Yes. Outdoor sensors report O3, CO, SO2, NO2, PM2.5 and PM10, and weather stations report temperature, humidity, pressure, wind direction and rainfall.
Aqueduct is device agnostic. The make and model is chosen per site from the hardware we work with, based on the data points needed and the radio plan. Installation runs through partners.
See Aqueduct on your own facility.
Bring a site, a utility bill or a question. We will show you where the loss is.