HVAC&R monitoring and control, from the chiller plant to the cold room
HVAC&R monitoring and control covers heating, ventilation, air conditioning and refrigeration equipment, from chillers and air handlers to cold rooms and compressors. Aqueduct meters and senses that equipment, finds faults and early signs of failure, optimizes energy against a weather-normalized baseline, controls over BACnet and Modbus where control is enabled with owner approval, and keeps evidence for temperature-critical spaces.
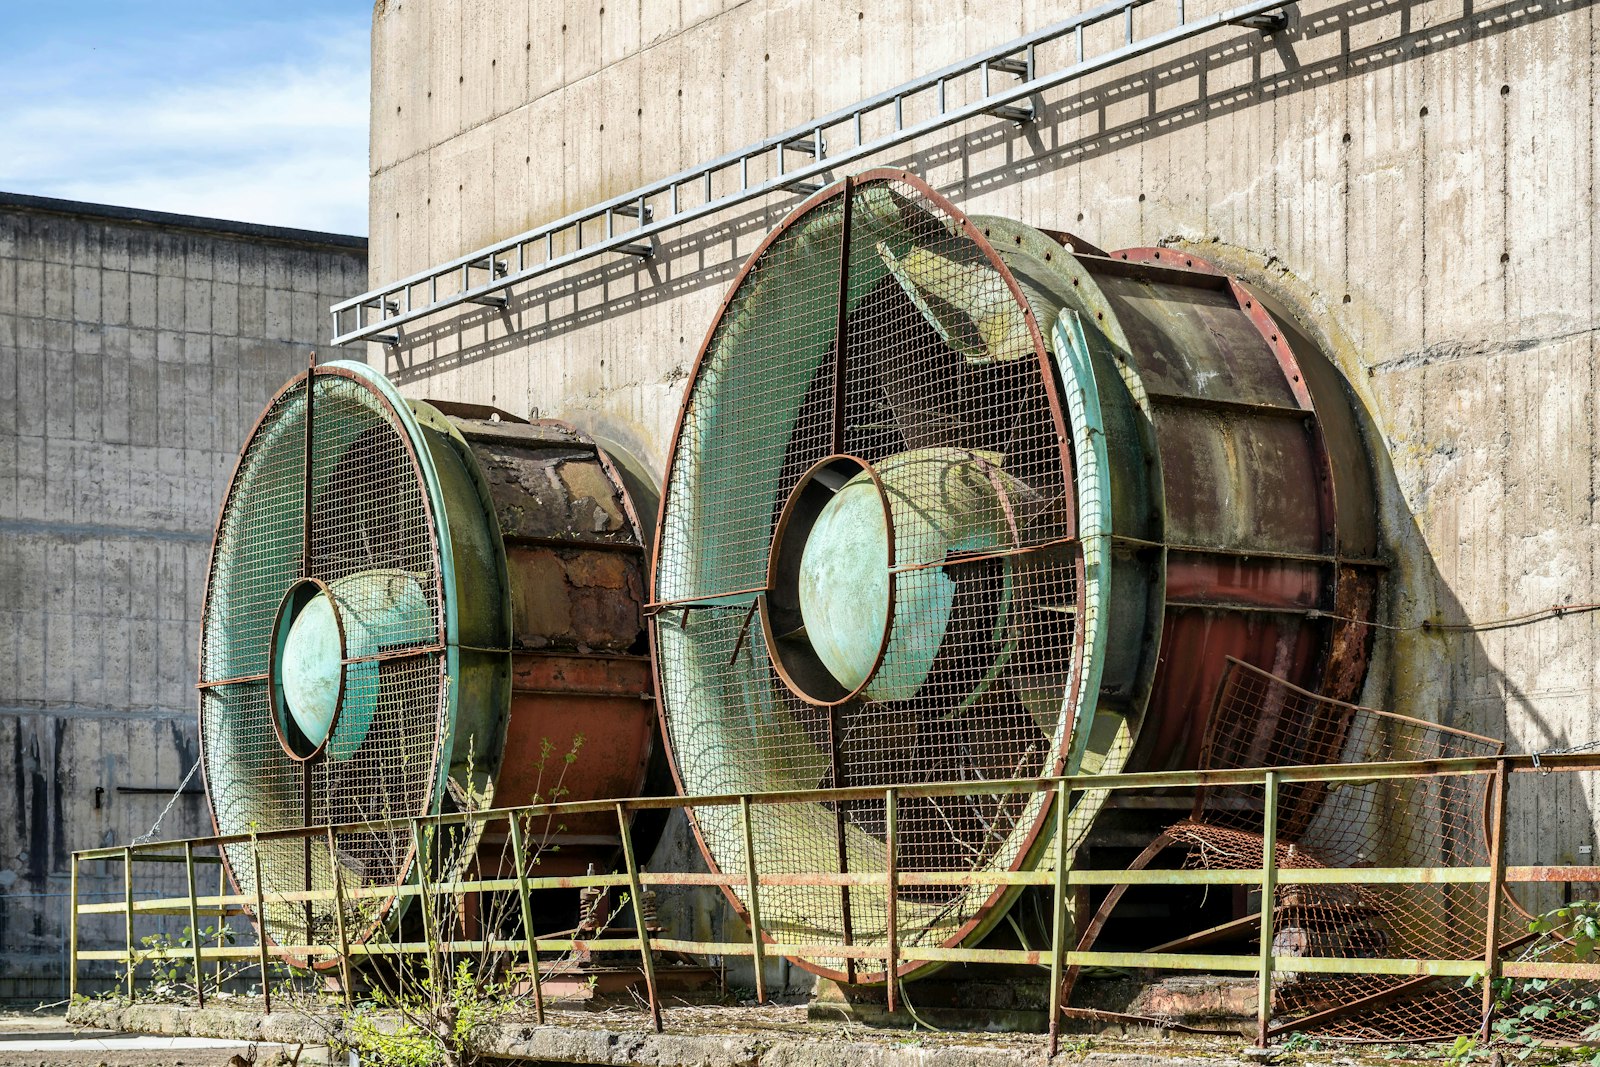
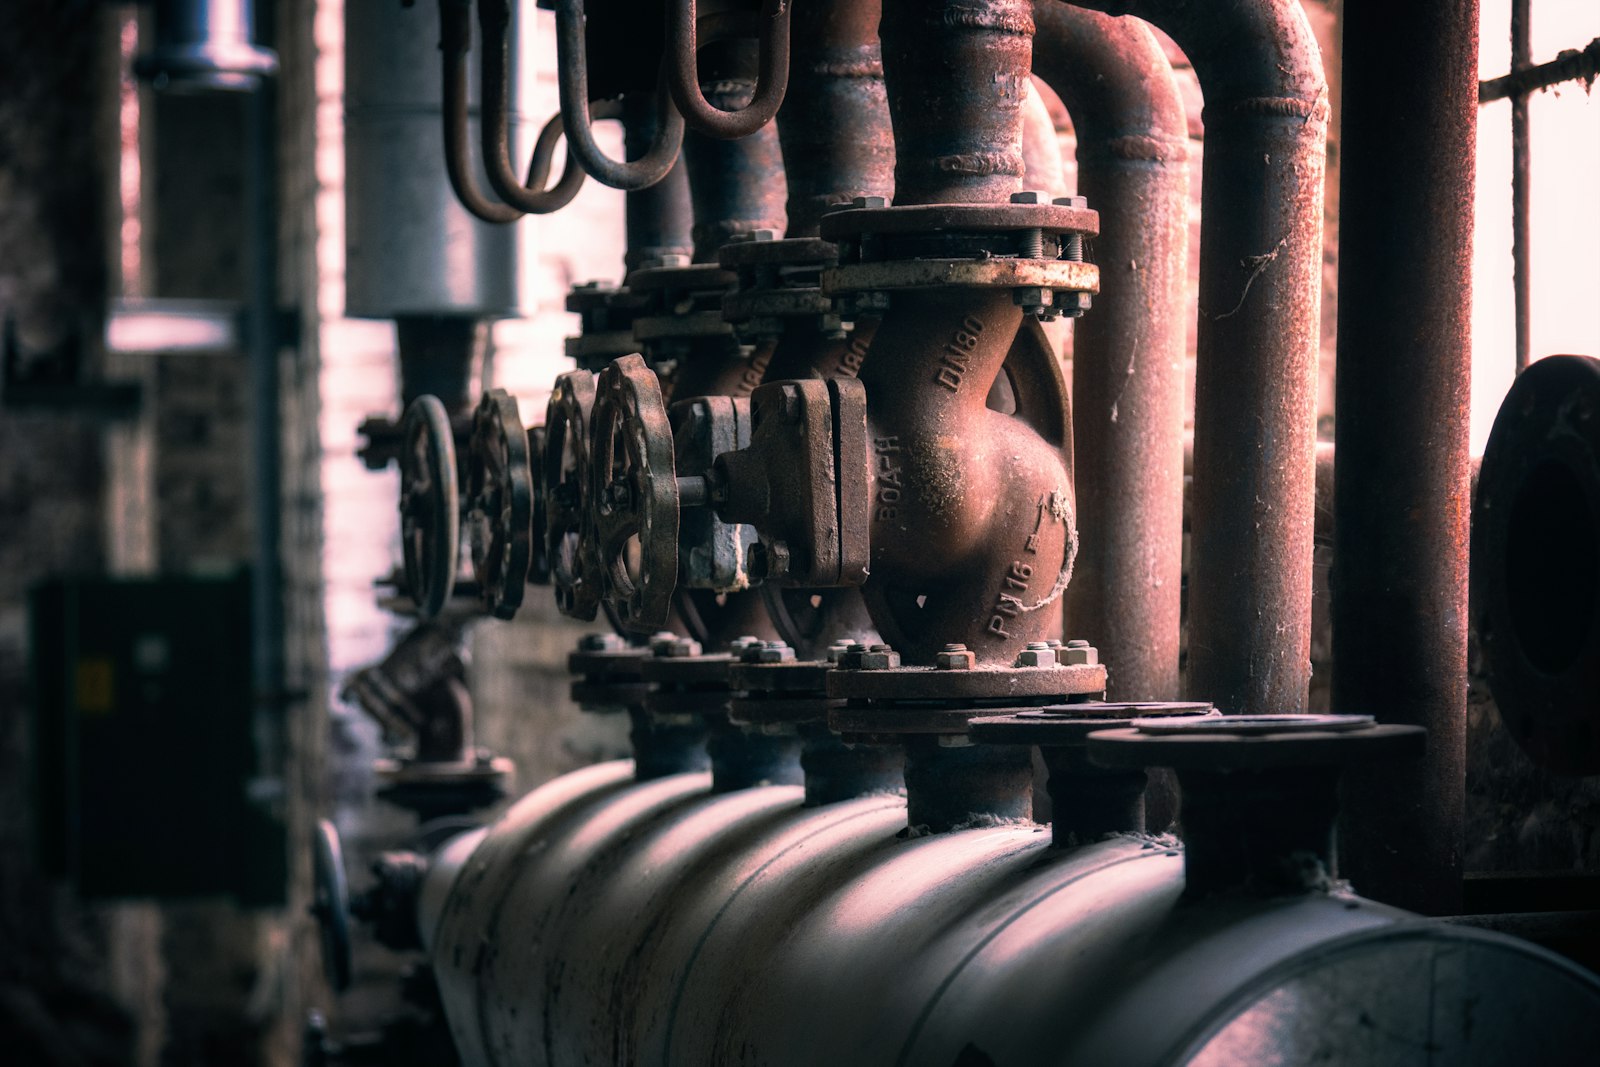
Every chiller, compressor and cold room measured, diagnosed and run to its load.
Chiller and refrigeration efficiency measured, not estimated
- kW per ton
Plant efficiency comes from electrical input against cooling output from BTU meters, per chiller where feeders allow.
- Low delta T
Chilled water temperature difference is trended against load, so the most common chronic fault shows as a trend.
- Cooling energy ratio
Refrigeration groups are compared on energy per unit of cooling under similar operating conditions.
Faults diagnosed and failures caught before the room warms
- Command against feedback
Failed starts, units left in manual and valves not following their command surface as a standing list.
- Early signs of failure
Compressor vibration, a new sound signature and energy drift schedule maintenance before the failure happens.
- Routed to your CMMS
Each finding goes to the responsible role and into your CMMS with the evidence and a recommended fix.
Equipment controlled with approval, records kept for audits
- BACnet and Modbus
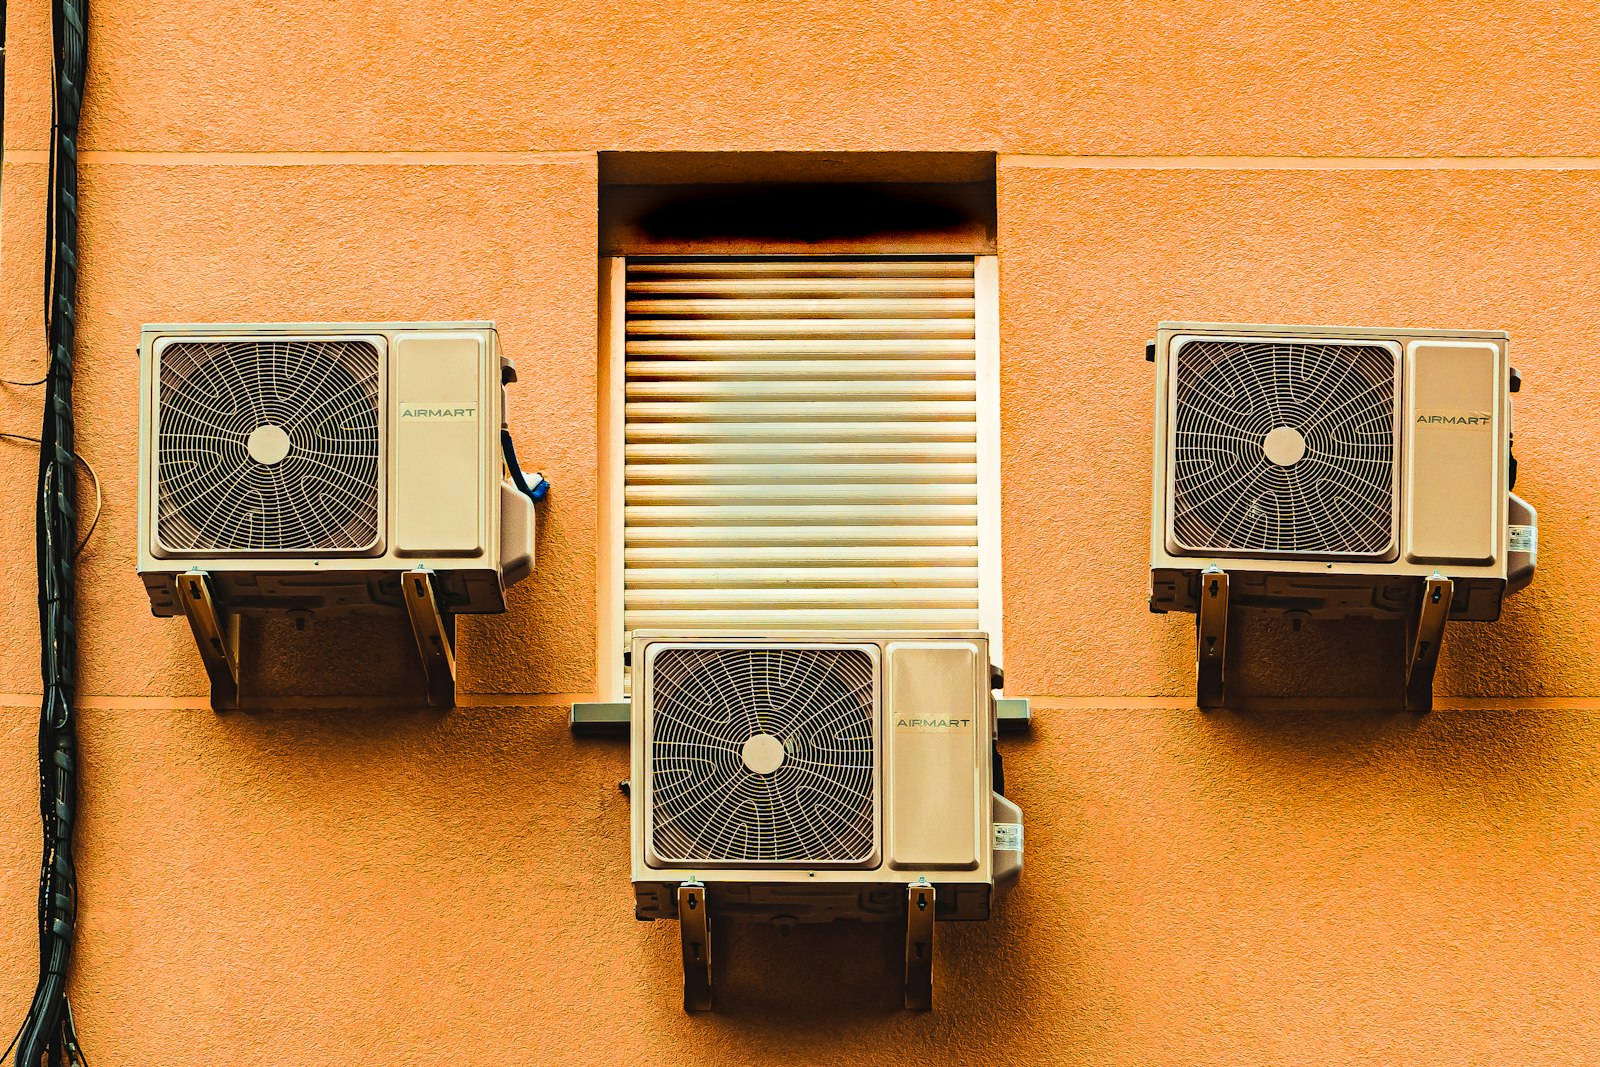
The field device network controller reaches chillers, AHUs, RTUs and VAV boxes where control is enabled.
- Lockout protection
Lockouts block new commands mid-action, protecting compressors and fans from short cycling and repeated starts.
- Continuous evidence
aQ Assurance keeps temperature and pressure records, deviations with closure and exports for any assessment period.
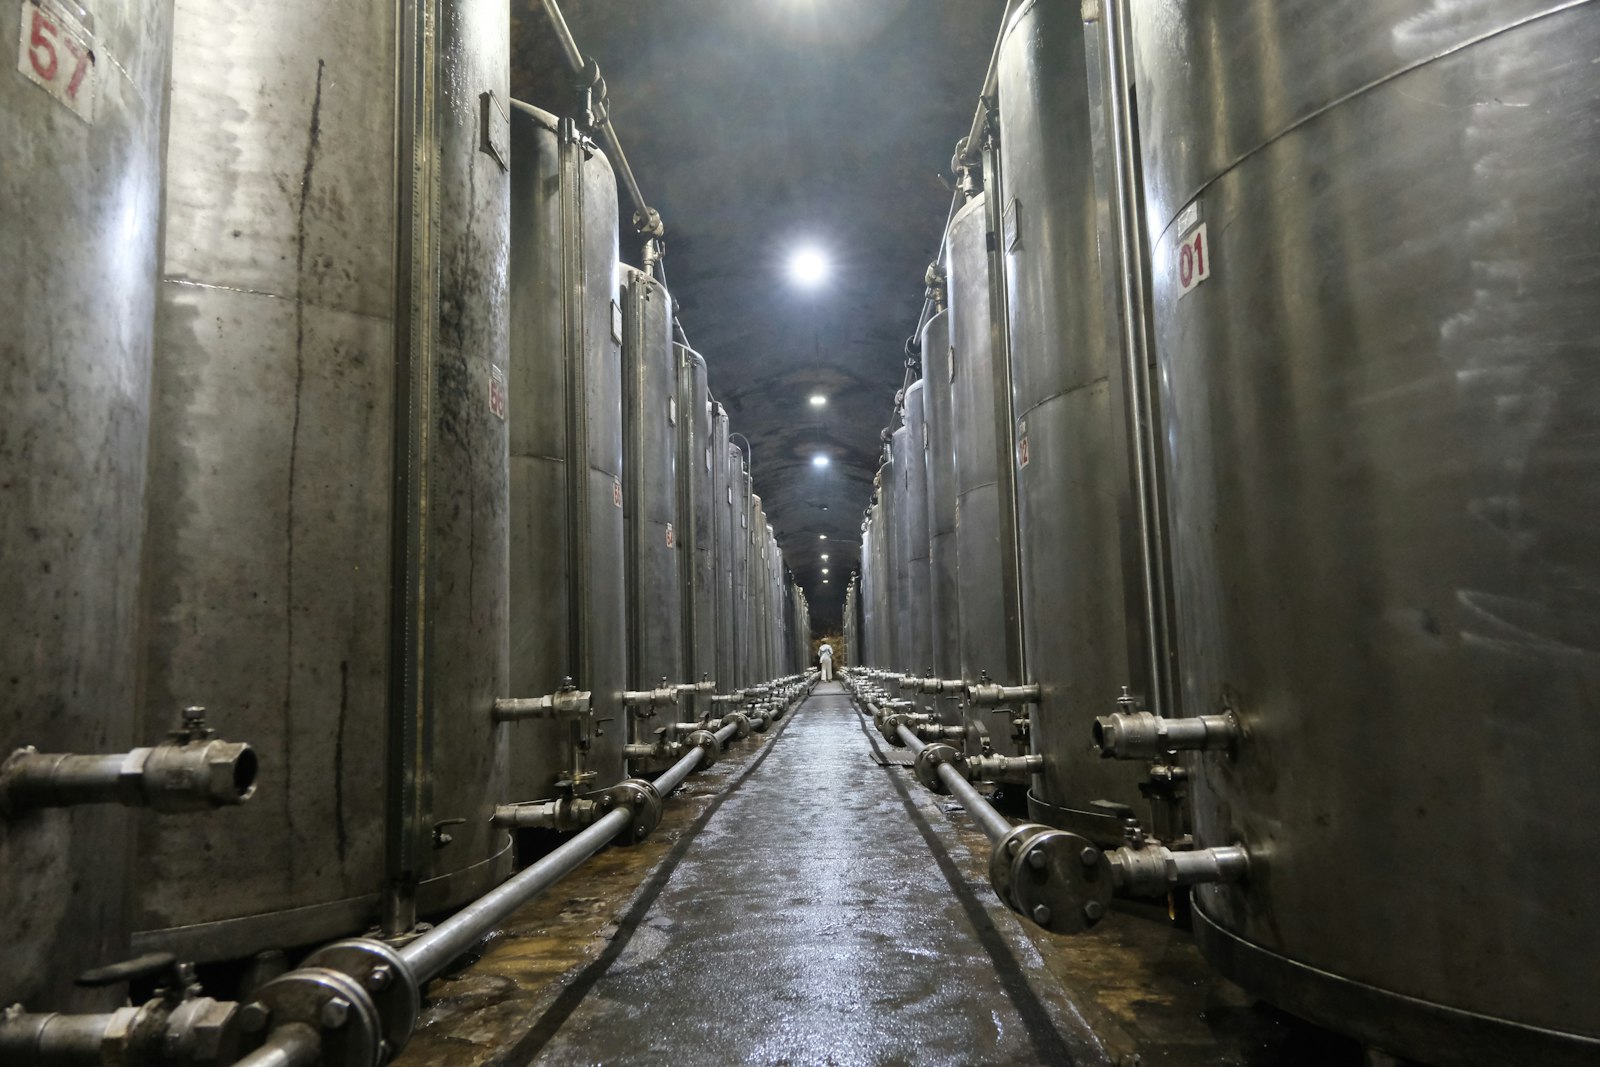
HVAC&R operations, before and after Aqueduct
- Chiller efficiency is a nameplate figure, not a measurement.
- Fouled condensers show up as a bigger electricity bill.
- A unit left in manual is found by a complaint.
- Compressors fail first, and the repair is the warning.
- Cold room records are manual readings taken between checks.
 The Aqueduct way
- kW per ton is measured from electrical input and cooling.
- Rising power at flat cooling flags poor heat removal early.
- Units left in manual sit on a standing list.
- Vibration and energy drift schedule maintenance before failure.
- Cold room temperature is a continuous record with every excursion.
HVAC&R equipment Aqueduct covers, and what is measured
Existing meters, BMS points and controllers are read where they exist. New sensors are installed through partners only where the site is blind.
| Equipment | Metered and sensed | What Aqueduct derives |
|---|---|---|
| Chillers and chilled water plant | Feeder kW and kWh, BTU meter flow and header temperatures, run, trip and auto or manual state | kW per ton, coefficient of performance, delta T, runtime balance |
| Cooling towers | Make-up water flow, TDS and pH, condenser water temperatures | Make-up use and water quality trends, approach where wet bulb is measured |
| AHUs and RTUs | Supply and return air temperature, return humidity, valve and damper position, fan status, filter alarm | Component states on the twin, command against feedback, setpoint attainment |
| VAV boxes | Zone temperature, damper position and setpoints over BACnet or Modbus | Comfort compliance and the zones driving each reset |
| Boilers and hot water | Heating status, hot water supply temperature, gas use in therms or cubic meters | Hot water reset opportunities and heating use against degree days |
| Refrigeration compressors and condensers | Discharge pressure, temperatures, condenser water flow, matched electrical input, vibration | Energy per unit of cooling, poor heat removal, early signs of failure |
| Cold rooms | Room temperature and humidity | Excursions with time and duration, linked to the plant serving the room |
Where HVAC&R goes wrong quietly
Most HVAC&R faults do not stop the plant. They make it work harder until something trips or a room drifts.
Low delta T
The most common chronic chilled water fault. Pumps move more water for the same cooling and the plant loses efficiency.
Poor heat removal
Fouled condensers or low condenser water flow push discharge pressure up, and compressors burn more power for the same cooling.
Plant left in manual
A unit left in hand after maintenance, or commanded on and not running, is noticed only when an area complains.
Excursions between checks
A cold room or critical space drifts between manual readings, and the record shows a log entry instead of what happened.
What Aqueduct finds in HVAC&R equipment
Faults found, diagnosed and routed. Early signs of failure caught before the fault.
Failed starts and uncommanded running
Start command against run status on chillers, pumps, air handlers and fans, with the time and duration.
Valves and dampers not following
Command against feedback finds a stuck, hunting or disconnected actuator before the area it serves overheats.
Setpoint deviation
A sustained gap between what a unit is asked to do and what it achieves, on air and chilled water.
Trip frequency
Repeated trips on one item flagged ahead of a failure, not after it.
Filter alarms left standing
Dirty filter alarms tracked with how long each has stood, so changes follow condition, not the calendar.
Vibration and sound signatures
aQ PredictIQ reads compressor vibration, a new sound signature and energy drift, and schedules maintenance before failure.
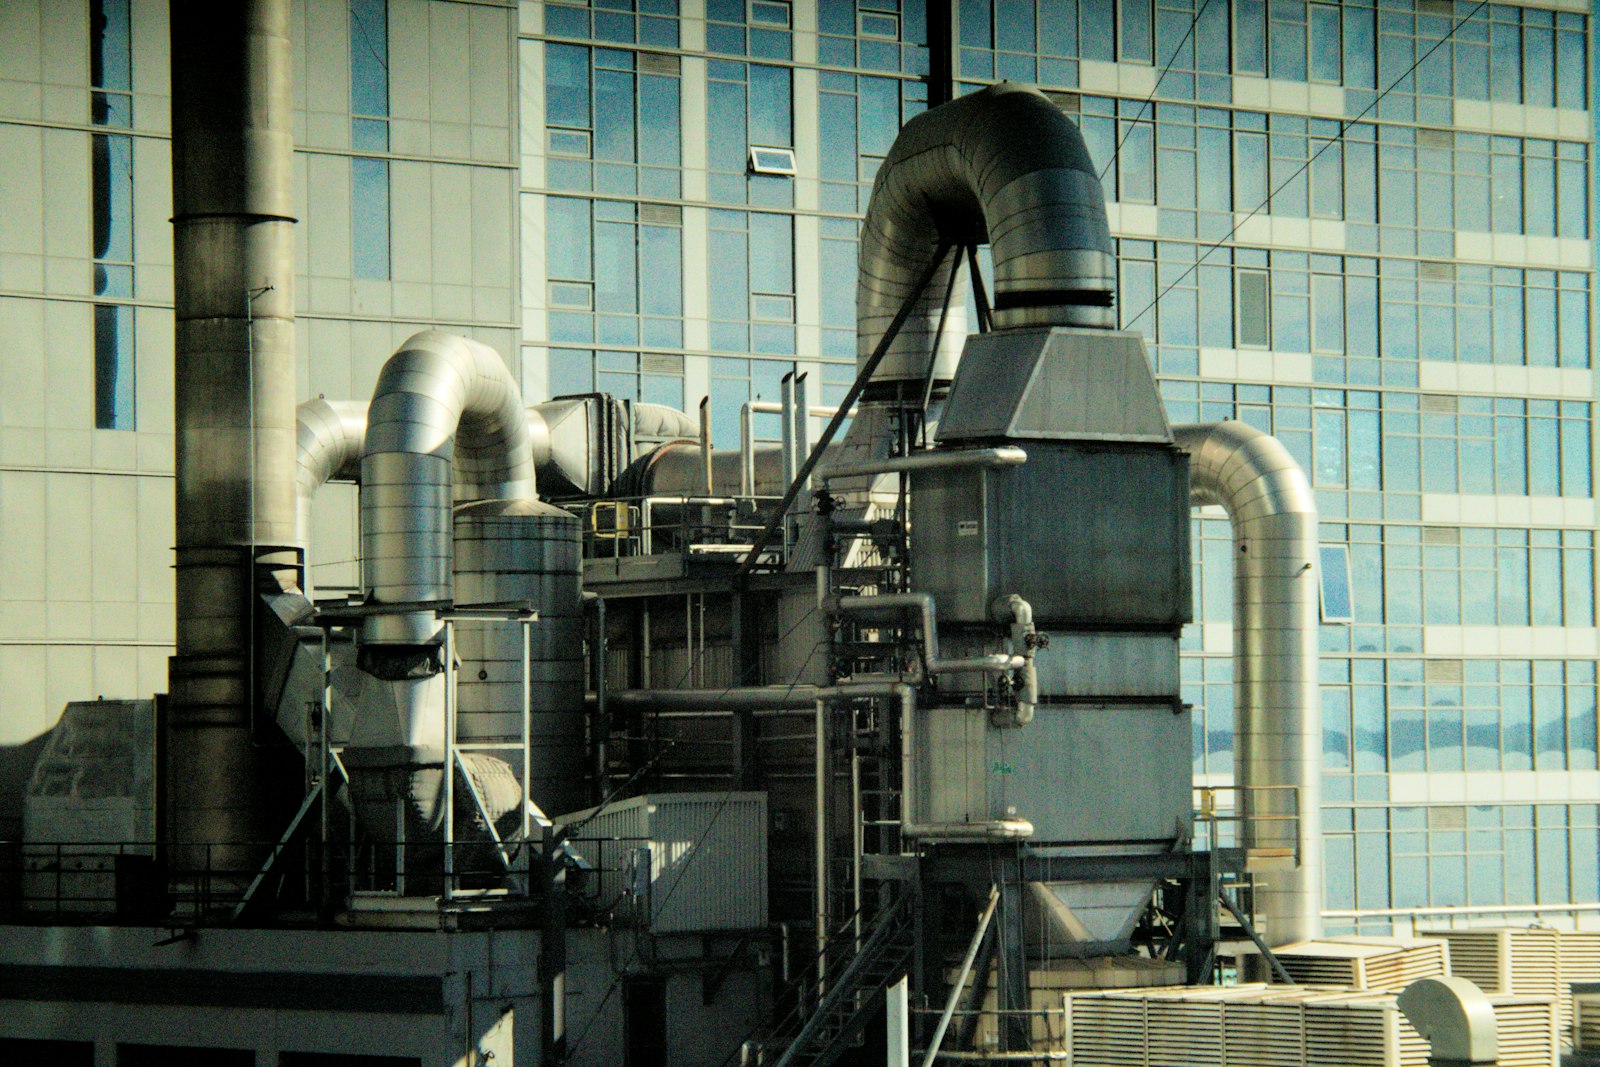
Cold chain reliability starts with every compressor and cold room measured continuously.
Talk to our teamHow HVAC&R control works in Aqueduct
Two routes to equipment, both used only where control is enabled with owner approval.
Field device network controller
Chillers, AHUs, RTUs and VAV boxes connect over BACnet IP, Modbus TCP or serial. The controller translates to MQTT for Aqueduct.
LoRaWAN relays
Simple loads such as exhaust fans, ventilation fans and lighting switch through LoRaWAN relay switches.
Desired and reported state
Each field device holds a desired and a reported state, so Aqueduct knows whether equipment did what it was told.
Lockouts and command history
Lockouts block new commands mid-action to prevent short cycling. Command history records whether every command executed.
Read-only where required
Hospitals and other critical sites can run read-only, with an outbound data path and nothing written to existing controls.
Problem, solution, impact
Where HVAC&R monitoring and control pays back.
Compressors working against fouled condensers.
Power and pressure trended against cooling output under similar conditions.
Chiller kW per ton tracked against its own baseline, with each saving verified at the meter.
Cooling towers fed make-up water nobody measures.
Make-up flow, TDS and pH tracked hour by hour.
Tower water use made visible, with blowdown and drift losses named and priced.
Faults found when a room gets warm.
Command against feedback rules route each fault to the responsible role.
Repairs routed to your CMMS and confirmed at the meter.
Evidence for temperature-critical spaces
aQ Assurance organizes measurements into a continuous record. Your team or your consultant files and certifies.
Where teams put it to work
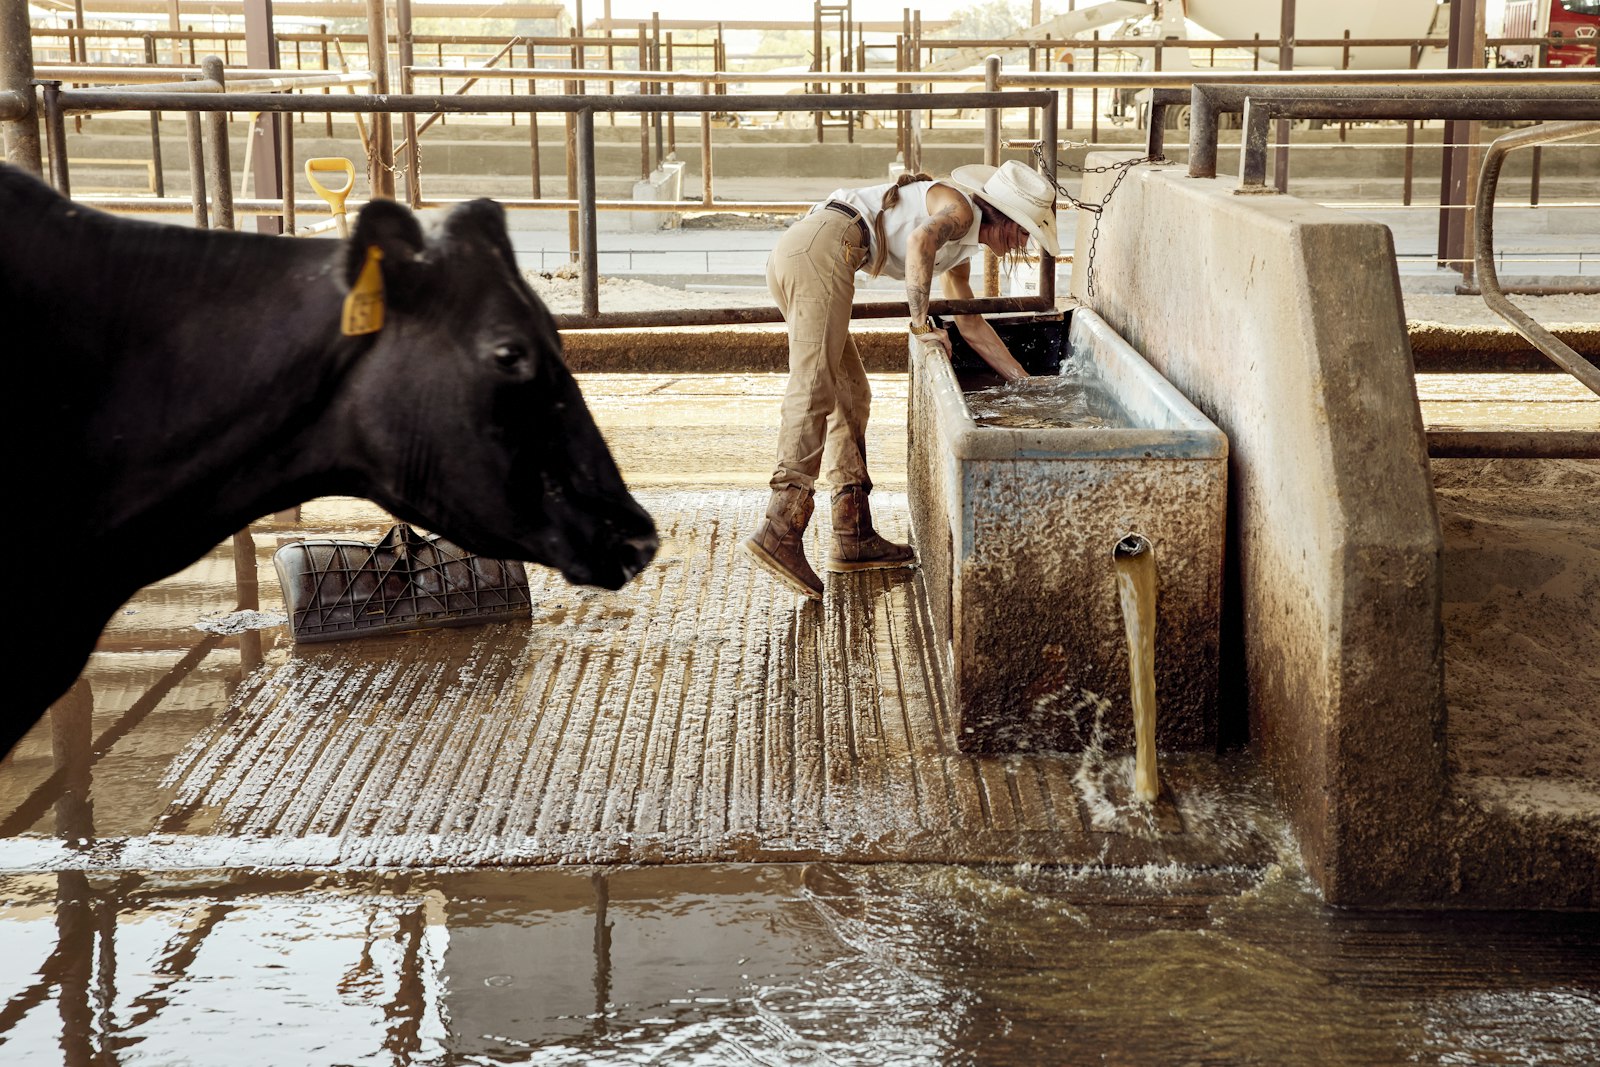
Refrigeration plants watched compressor by compressor
Major dairy operations run on Aqueduct. Compressor power, pressure and condenser water flow are read against cooling output, so heat removal problems are checked before product temperature moves.
Learn more
Chilled water and critical rooms on one record
A hospital chain with 22 hospitals and 9 clinics is a client. Chiller efficiency, air handler states and operating room pressure sit together, with read-only operation where required.
Learn more
Temperature-critical spaces with continuous evidence
Cold rooms and controlled spaces keep a continuous temperature record with deviations and closure, ready to export for your quality team or auditor to review and file.
Learn moreHVAC&R across the sites Aqueduct runs in
The equipment is similar everywhere. What matters, and what the record must show, differs by application.
Cold rooms and refrigeration plant
Product safety depends on room temperature, and electricity depends on the compressors and condensers keeping it there. Both drift slowly.
- Room temperature and humidity with excursion duration
- Energy per unit of cooling per refrigeration group
- Compressor vibration and sound signature
- Measured
- room conditions, discharge pressure, kW
- Risk
- excursions and compressor failure
- Aqueduct
- aQ Assurance record and aQ PredictIQ warnings
Clinical air systems
Operating and isolation rooms are held to temperature, humidity and pressure bands. Many hospitals run Aqueduct read-only alongside the existing BMS.
- Limits per room class
- Pressure cascades per suite
- Plant mapped to the rooms it serves
- Measured
- temperature, RH, differential pressure
- Risk
- excursions between rounds
- Aqueduct
- continuous record, read-only where required
Commercial HVAC
Waste comes from schedules, overrides and stuck components that keep comfort just acceptable.
- RTU and AHU component states
- Occupancy-driven rules where enabled
- Comfort compliance per zone
- Measured
- unit states, zone temperature, CO2
- Risk
- energy waste and complaints
- Aqueduct
- Smart Controls with command history
Critical cooling
Cooling availability comes first, efficiency second. Command against feedback and early warnings matter more than setbacks.
- Chiller and CRAH status against command
- Trip frequency
- Cooling energy against IT load
- Measured
- plant status and power
- Risk
- loss of cooling
- Aqueduct
- early warning and diagnosis
Gulf and tropical sites
Cooling is the dominant electrical load, and condensers degrade faster in dust and heat.
- kW per ton against wet bulb where measured
- Condenser performance trends
- District cooling consumption where supplied
- Measured
- plant efficiency and load
- Risk
- efficiency loss under peak heat
- Aqueduct
- plant efficiency against baseline
Why HVAC&R gets close attention
up to this share of a UAE building's electricity demand goes to cooling
Source: Heriot-Watt University: Retrofit options to reduce climate change impacts on UAE buildingsASHRAE 170 design temperature range for operating rooms
Source: ASHRAE Journal: Conditioning for the environment of critical care hospital operating roomsASHRAE 170 design relative humidity range for operating rooms
Source: ASHRAE Journal: Conditioning for the environment of critical care hospital operating roomsFrom read-only monitoring to control
Most sites start read-only. Control is added where it is enabled, with owner approval, once the data has earned trust.
Connect the plant
Chiller plant managers, BMS points and power meters connect over BACnet or Modbus through a field device network controller, read-only.
Fill the blind spots
BTU meters, cold room sensors and vibration sensors are installed through partners only where the site has no data.
Baseline and diagnose
Plant efficiency and asset baselines are learned. Faults and early warnings route into your CMMS.
Control where approved
Schedules, staging and setpoints are enabled unit by unit, with owner approval, lockouts and command history.
HVAC&R KPIs and what drift usually means
The KPIs to trend for each part of the plant, and the cause engineers check first when one moves.
| KPI | Equipment | Drift usually means |
|---|---|---|
| kW per ton | Chillers | Fouled condenser, poor staging or low delta T |
| Delta T against load | Chilled water loop | Coil valves open too far or bypass flow |
| Energy per unit of cooling | Refrigeration groups | Poor heat removal or refrigerant issue |
| Discharge pressure | Compressors and condensers | Condenser fouling or low condenser water flow |
| Make-up flow and conductivity | Cooling towers | Blowdown set wrong or a stuck float valve |
| Excursion minutes | Cold rooms | Door practice, defrost timing or plant capacity |
| Setpoint attainment | AHUs and RTUs | Stuck damper, valve or undersized capacity |
A refrigeration plant, point by point
Refrigeration faults rarely stop the plant. They raise lift, lengthen run times and warm the room slowly. These are the points where that starts, and what Aqueduct reads, from the rack controller over BACnet or Modbus or from added sensors where the site is blind.
Compressor rack
Too many compressors staged for the load, or one compressor short cycling while others idle.
Compressor status and stage, rack kW, starts per hour, vibration where fitted
Energy per unit of cooling per rack, short cycling and early signs of failure through aQ PredictIQ
Suction pressure
Suction held lower than the warmest case or room needs, raising lift on every compressor.
Suction pressure and saturated suction temperature
Shows headroom between suction temperature and what the loads actually require
Discharge pressure
High head pressure from a fouled condenser, failed fan or a fixed head pressure setpoint in cool weather.
Discharge pressure, condensing temperature, ambient temperature
Flags rising discharge pressure at similar load and ambient as poor heat removal
Condensers
Dirty coils, failed fans or low condenser water flow; heat removal slowly falls.
Condenser fan status, condenser water flow and temperatures where water cooled
Condenser approach trended, cleaning recommended from the trend, not the calendar
Evaporators
Iced coils, failed fans or poor superheat control cut capacity and stretch run times.
Coil and air temperatures, evaporator fan status, superheat where available
Room temperature recovery and run time per evaporator against its own history
Defrost
Defrost too often wastes heat and energy; too rarely and the coil ices.
Defrost start and end, termination temperature, room temperature during and after
Defrost duration and room recovery per cycle, with excursions tied to the cycle
Doors
Doors held open during loading let in heat and moisture, which becomes ice on the coil.
Door open events and duration where door contacts are fitted
Door open minutes laid over room temperature and defrost demand
Cold room
Product temperature at risk between manual checks.
Room temperature and humidity, continuously
Excursions with time and duration, kept as a record by aQ Assurance
What a cold room record should explain
A cold room temperature trace is the result of the plant, the doors, the defrost and the product all at once. Reading them together turns an excursion into a cause.
Pull-down after loading
Warm product and an open door lift the room temperature. How fast the room recovers says whether the plant has capacity left.
- Recovery time after each loading event
- Recovery compared with the same room in previous weeks
- Slower recovery flagged before an excursion happens
- Measured
- room temperature, door events, rack kW
- Signal
- recovery time lengthening
- Aqueduct
- links slow recovery to the rack serving the room
Defrost cycles
Every defrost adds heat that the plant then removes. Room temperature during and after each defrost shows whether the schedule fits the frost load the room actually sees.
- Defrost duration and termination
- Room temperature peak during defrost
- Defrost frequency against door open time
- Measured
- defrost status, coil and room temperature
- Signal
- long defrosts or excursions tied to defrost
- Aqueduct
- shows each defrost against the room record
Door practice
Door open time drives moisture into the room, which ices the coil and forces more defrost. It is often the cheapest fix on the site.
- Door open minutes per shift
- Long openings flagged with time of day
- Door time compared with room excursions
- Measured
- door contact events
- Signal
- open minutes rising
- Aqueduct
- sends findings to the shift lead with the trace
Humidity and ice
High room humidity in a freezer or chiller usually means moisture is entering faster than the coil can manage it, through doors, seals or wash down.
- Room humidity alongside temperature
- Ice build up inferred from coil temperature and fan run
- Seal and curtain inspections prompted by trend
- Measured
- room relative humidity
- Signal
- humidity high outside wash down
- Aqueduct
- routes the finding to maintenance
The temperature record
Continuous readings replace manual log entries. Each excursion carries its start, its duration, its peak and its closure.
- Excursion minutes per room
- Deviation with cause and closure
- Export for any assessment period
- Measured
- temperature and humidity per room
- Evidence
- continuous record with deviations
- Aqueduct
- aQ Assurance keeps it; your quality team or auditor reviews it
Chillers, AHUs and zones as one connected plant
The zone asks
VAV boxes and zone sensors report temperature, damper position and cooling demand. This is the real load, and it is where every reset should start.
The AHU answers
Supply air temperature, static pressure and chilled water valve position show how hard each air handler works to satisfy its zones. A coil at a fully open valve is the constraint on the chilled water loop.
The loop carries it
Chilled water flow, delta T and loop differential pressure show whether the coils are using water well. Low delta T at the plant is usually caused out at the coils.
The chillers produce it
Chiller kW, cooling in tons and condenser conditions give kW per ton. Staging decisions depend on both the load and the delta T the coils return.
The towers reject it
Condenser water temperatures, tower fan power and wet bulb give tower approach. Because Aqueduct holds all five levels on one data layer, a symptom at one level is traced to its cause at another.
HVAC&R fault signatures, and what to do about each
Each fault leaves a pattern in the data before it leaves a warm room. These are the ones plant engineers ask about most.
| Symptom | Likely cause | Data that shows it | Action |
|---|---|---|---|
| Discharge pressure rising at the same load and ambient | Fouled condenser, failed condenser fan, low condenser water flow | Discharge pressure, condenser fan status, rack kW against cooling | Clean the condenser, check fans and flow, confirm pressure falls |
| Compressors short cycling | Load far below the smallest stage, narrow pressure band, low charge | Starts per hour, on and off durations, suction pressure | Widen the control band, review staging, check charge |
| Room recovers more slowly after each loading | Iced evaporator, failed evaporator fan, plant near capacity | Recovery time, coil temperature, fan status | Check defrost and fans before adding capacity |
| Excursions during defrost | Defrost too long, termination set wrong, heaters stuck on | Defrost duration, termination temperature, room peak | Adjust termination and schedule, inspect heaters |
| High room humidity and frequent defrost | Doors held open, damaged seals or curtains | Door open minutes, humidity, defrost count | Address door practice, repair seals |
| Chiller kW per ton drifting up | Condenser tube fouling, poor staging, low delta T | kW per ton by load band, condenser approach, delta T | Clean tubes, review staging, chase the low delta T |
| Low chilled water delta T | Coil valves not closing, fouled coils, low AHU setpoints | Delta T against load, valve positions, decoupler flow | Repair valves, reset AHU setpoints, clean coils |
| Tower approach widening | Fouled fill, poor water distribution, fan fault | Leaving tower water temperature, wet bulb, fan kW | Inspect fill and nozzles, check fan and drive |
| Supply air temperature not met with valve fully open | Fouled or air bound coil, chilled water too warm | Valve position, supply air temperature, coil water temperatures | Clean or vent the coil, check chilled water supply |
Refrigeration metrics worth trending
Energy per unit of cooling
Rack kW against the cooling delivered, compared under similar ambient and load, so heat removal problems show before a trip.
Lift
The gap between condensing and saturated suction temperature. Every unnecessary degree of lift is compressor energy the room did not need.
Starts per hour
Compressor starts counted per hour. Short cycling wears contactors and motors long before it shows on the bill.
Excursion minutes
Minutes outside the room limit, per room and per period, the number quality teams ask for first.
Defrost recovery
Minutes from defrost end to room temperature back in band, tracked per evaporator.
Door open minutes
Time doors stand open per shift, set against room humidity and defrost demand.
Sources3 references cited on this page
sites in 21 countries run on Aqueduct.
and 9 clinics in one of India’s top hospital chains.
US airport running water intelligence on Aqueduct.
of commercial real estate under Aqueduct.
FMCG manufacturing campus.
operations run on Aqueduct.





Related
Common questions
HVAC&R monitoring and control means measuring heating, ventilation, air conditioning and refrigeration equipment continuously, finding faults and waste, and adjusting operation. Aqueduct covers chillers, cooling towers, AHUs, RTUs, VAV boxes, boilers, cold rooms and refrigeration compressors, and controls equipment where control is enabled with owner approval.
Measure pressure, temperature, condenser water flow and the electrical input of each compressor group, then compare energy against cooling output under similar conditions. Aqueduct flags rising energy with flat cooling as poor heat removal and recommends condenser and cooling tower checks before compressors fail.
Yes. Aqueduct tracks cold room temperature and humidity continuously, records each excursion with its time and duration, and links it to the refrigeration plant serving the room. Major dairy operations run on Aqueduct.
Through a field device network controller that speaks BACnet or Modbus to the equipment, and LoRaWAN relays for simple loads. Control runs only where it is enabled with owner approval, with lockouts against short cycling and a command history for every change.
Predictive maintenance looks for early signs of failure before a fault happens, such as rising compressor vibration, a new sound signature or energy drift. In Aqueduct, aQ PredictIQ reads these signals and schedules maintenance first, routing the work into your CMMS.
No. Aqueduct supplies the measured evidence: a continuous temperature record, deviations with their closure, and exports for any assessment period through aQ Assurance. Your team or your consultant files and certifies.
Yes. Aqueduct can read beside an existing BMS and plant manager without writing anything, take over control where the owner chooses, or be built into new construction. Its recommendations can be carried out through the systems you already run.
Yes. A hospital chain with 22 hospitals and 9 clinics is an Aqueduct client. In hospitals, Aqueduct tracks chiller plant efficiency, air handler states and critical room pressure, and can run read-only so existing validated control strategies stay as they are.
Yes, where the supply is metered with BTU or energy meters. Consumption is baselined against weather like any other utility.
Discharge pressure and compressor power rise for the same cooling output under similar conditions. That trend is flagged before efficiency loss turns into a trip.
Yes. Read-only deployments use an outbound data path and write nothing to existing controls. Control can be enabled later, with owner approval, if the hospital chooses.
A continuous temperature and humidity record per room, every excursion with its time and duration, and its closure. Your team or auditor uses the export; Aqueduct does not certify the room.
For cooling-heavy sites, kW per ton or energy per unit of cooling, because it shows efficiency loss as it develops. For cold storage, excursion minutes per room come first.
Floating head pressure lets condensing pressure fall with cooler ambient conditions instead of holding a fixed setpoint, which reduces compressor lift. Aqueduct shows discharge pressure against ambient so the opportunity is visible, and a change can be made through the rack controller or, where control is enabled, with owner approval.
No. Room temperature and humidity are the core record. Door contacts add the cause behind many excursions and are installed through partners where the site wants that detail.
Each excursion is set against the defrost status, door events and rack data for the same period. An excursion that starts and ends with a defrost reads very differently from one where the rack lost capacity.
Where the controller exposes data over BACnet or Modbus, the field device network controller reads it. Where it does not, pressure, temperature and power sensors are added through partners.
Because many plant faults are caused somewhere else. Low delta T at the chillers is usually caused at the coils, and a coil that cannot hold supply air is often a chilled water problem. One data layer lets the trace follow the cause.
See Aqueduct on your own facility.
Bring a site, a utility bill or a question. We will show you where the loss is.