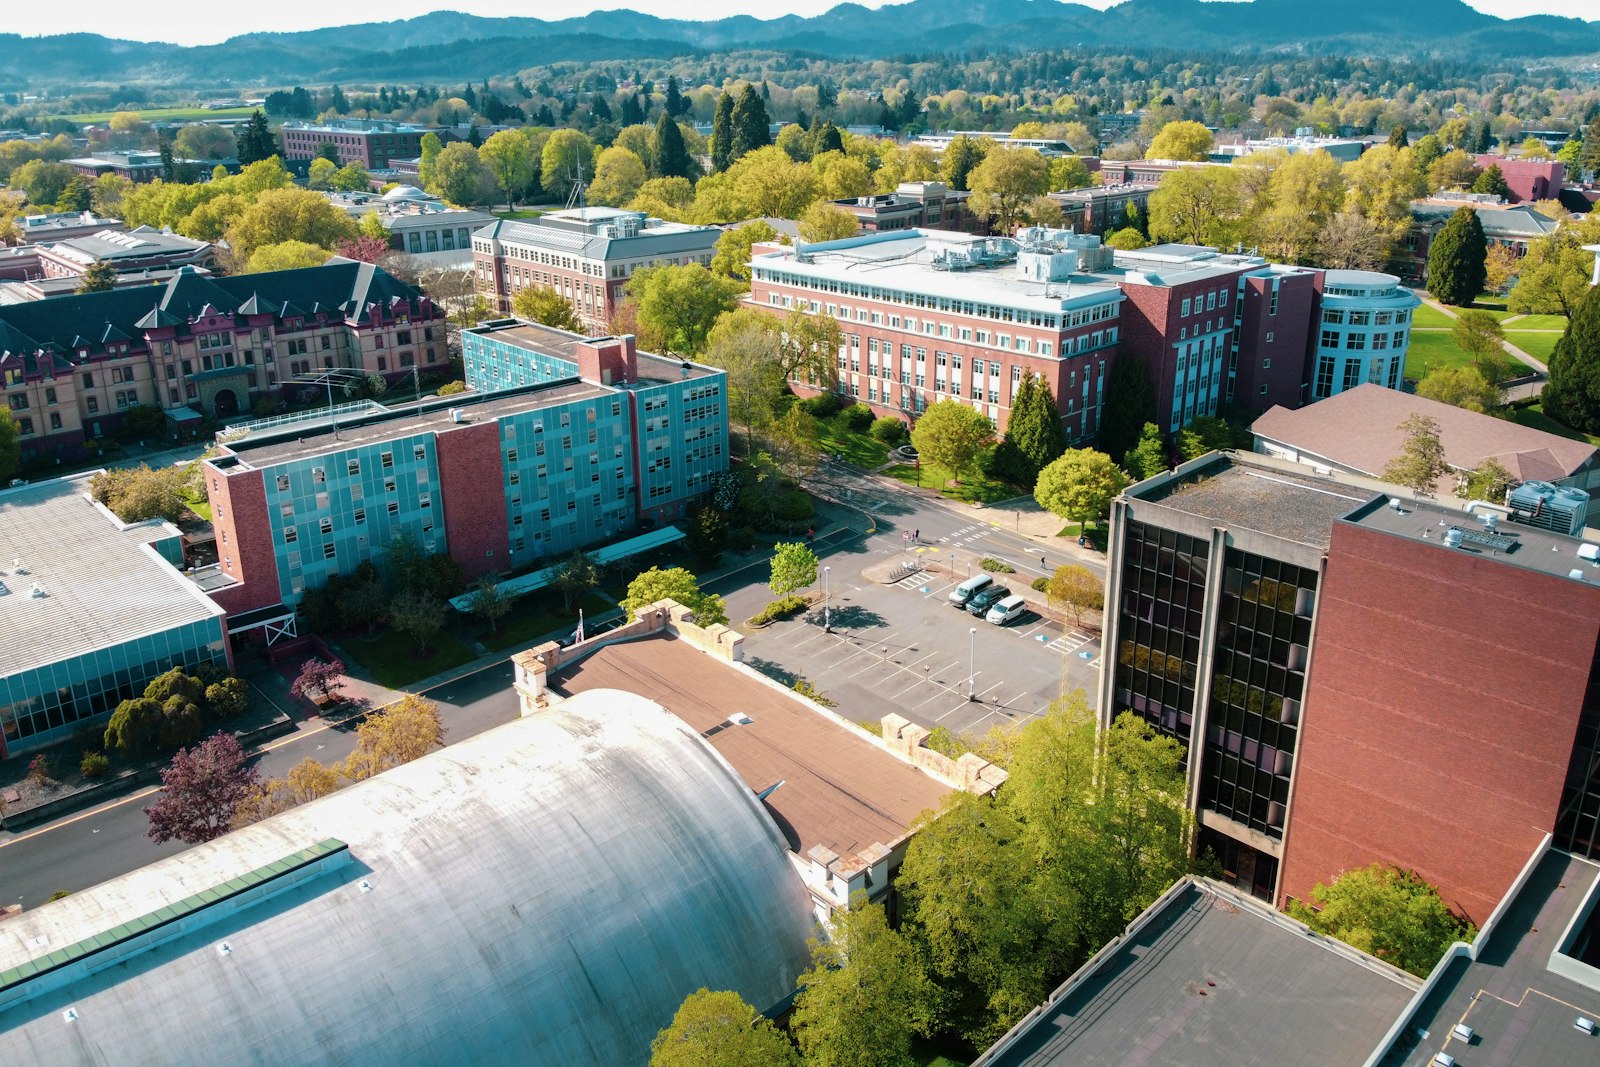
Campuses and classrooms with healthy air and bills that add up.
Lecture halls, labs, residences and school buildings on one platform. Air targets held in occupied rooms, water accounted for across the campus, and savings a board can audit.
Healthy air in occupied rooms, and bills that add up across the campus.
CO2 held to target while rooms are occupied
- Air by room
CO2 and particulates are read per lecture hall and classroom, against occupancy and the timetable.
- Duration counts
Exposure is tracked in zone hours, so a room stuck above target for a session is flagged.
- Ventilation that responds
Where control is enabled, with owner approval, ventilation is adjusted and the room is verified back in range.
Buildings that follow the timetable, not the boiler timer
- Term-aware baselines
Loads are baselined against weather and term time, so breaks and exam weeks have their own targets.
- Empty buildings found
Buildings running heat and cooling with nobody inside are flagged against occupancy, every evening and weekend.
- Board-ready savings
Every saving is verified at the meter and stated in money, ready for the board.
Residences, labs and irrigation reconciled to the main
- One campus balance
Buildings, residences, labs and irrigation reconcile against the main supply, so losses have an address.
- Faults routed
A small team gets faults diagnosed and routed into the CMMS, so they fix rather than hunt.
- Device health
Connection rate and battery on every sensor show which device needs attention before data goes missing.
Running a campus, before and after Aqueduct
- Stuffy classrooms are found when students complain.
- Heating runs through holidays because the schedule never changed.
- Campus water is one bill with no breakdown by building.
- A small team spends its day hunting for faults.
- Savings reported to the board are estimates.
 The Aqueduct way
- Classroom CO2 is tracked against occupancy, room by room.
- Empty buildings are found against the timetable and corrected.
- Campus water is reconciled building by building against the main.
- Faults arrive diagnosed in the CMMS with the fix attached.
- Savings reported to the board are verified at the meter.
What universities and schools teams are up against.
Water, energy, air and operations carry equal weight. Each one runs the same loop: monitor, measure, identify, act, verify.
Water: A campus balance that closes
Buildings, residences, labs and irrigation reconciled to the main.
Energy: Buildings that follow the timetable
Loads baselined against weather and term time. Empty buildings found.
Air: Classroom air, in range when occupied
CO2 and particulates per room, with ventilation response.
Operations: A small team, covering a large estate
Faults diagnosed and ticketed, so the team fixes rather than hunts.
Problem, solution, impact.
How Aqueduct resolves each problem for universities and schools, and what changes when it does.
Buildings, residences, labs and irrigation reconciled to the main.
A live water balance across meters and sub-meters localizes the loss, routes the fix and confirms it closed at the meter.
Loss found from the balance, not the bill, and every fix verified.
Loads baselined against weather and term time. Empty buildings found.
Weather-normalized baselines per building and asset show the waste in money; schedules and setpoints adjust where control is enabled.
Savings stated in money and confirmed at the meter, not estimated.
CO2 and particulates per room, with ventilation response.
Air quality per zone, overlaid with occupancy, with ventilation raised when it matters and verified back in range.
Targets held during occupied hours, with the energy cost counted.
Faults diagnosed and ticketed, so the team fixes rather than hunts.
Faults diagnosed in plain language and routed into your CMMS with the fix; early signs of failure schedule maintenance first.
Fewer reactive call-outs and closures confirmed by the equipment.
One incident, from first signal to verified fix.
An illustrative example of the flywheel on a typical site.
Building meters, classroom air sensors, AHU and boiler points.
Baselines per building, for term and vacation.
Lecture Hall B above its CO2 target in the 10:00 session.
Ventilation adjusted where control is enabled. Ticket routed for a stuck damper.
Back in range in 14 minutes. The record is kept.
Four connected products on one data layer.
Students learn better in good air, and boards deserve numbers they can trust.
Talk to our teamReplace what should be replaced. Connect the rest.
- BMS and BAS
- Energy management
- Indoor air quality monitoring
- Water management
- CMMS
- Timetabling as an input
Three equal ways in: keep your BMS, replace it, or build Aqueduct in at design stage.
The questions each seat asks first.
“Can a small team run this?”
“Where do our rating numbers come from?”
“What does it take off the utility bill?”
Standards and regulations we supply evidence for.
We supply the measured inputs. You run the program and file the report.
Where teams put it to work
Labs, halls and residences on one platform
Lecture halls, labs and residences baselined against term time and weather, with faults routed and savings verified at the meter.
Learn more
Classroom air that leads to action
Classroom CO2 tracked against occupancy, ventilation adjusted where control is enabled, and records kept for parents and boards.
Learn more
A small team covering a large estate
Faults diagnosed in plain language and routed into your CMMS, so a lean team spends its hours on repairs, not searching.
Learn moreA campus is a dozen building types under one budget
Each type of building uses energy, water and air differently, and fails differently. Treating them alike is why campus averages hide so much.
Lecture halls and classrooms
Rooms fill to capacity for an hour, then sit empty. Ventilation and conditioning that ignore the timetable either waste energy or let air quality fall.
- CO2 per room against the ventilation target
- Plant run hours against the timetable
- Empty rooms conditioned through breaks found
- Measured
- CO2, temperature, occupancy
- Target
- ASHRAE 62.1 ventilation when occupied
- Aqueduct
- matches air and energy to the timetable
Research laboratories
Labs often run once-through air at high exchange rates, around the clock. They are commonly the most energy-intensive spaces on a campus.
- Exhaust and supply fan energy per lab building
- After-hours operation compared with occupancy
- Freezer farms and process loads metered
- Measured
- fan energy, run state, plug loads
- Target
- the safety regime set by your lab managers
- Aqueduct
- shows the energy cost of each lab's operating regime
Residence halls
Residences run 24 hours with hot water, laundry and kitchens. Leaks and running fixtures go unreported because nobody pays the bill directly.
- Water balance per residence and riser
- Hot water plant energy against demand
- Vacation periods checked for waste
- Measured
- water per riser, hot water energy
- Target
- use that follows occupancy
- Aqueduct
- flags leaks and empty-building waste
Libraries and archives
Long opening hours and collections that need stable humidity. Drift in conditions puts collections at risk and drives plant to work harder.
- Temperature and humidity in collection areas
- Plant energy against opening hours
- Out-of-range alerts by zone
- Measured
- temperature, RH, plant energy
- Target
- your collection care band
- Aqueduct
- continuous record with alerts
Sports centers and pools
Pools combine heating, dehumidification, water treatment and make-up water. A leak or a stuck valve can run unnoticed for weeks.
- Pool make-up water against evaporation and backwash
- Dehumidification and heating energy
- Event use compared with baseline
- Measured
- make-up, heating, ventilation energy
- Target
- stable conditions at lowest use
- Aqueduct
- reconciles pool water and flags loss
Dining halls and kitchens
Kitchen exhaust, refrigeration and dishwashing are heavy loads that often run before and after service.
- Refrigeration energy and temperatures
- Kitchen exhaust run hours
- Dishwash and kitchen water metered
- Measured
- energy, cold room temperatures, water
- Target
- food safety bands and service hours
- Aqueduct
- alerts on temperature and out-of-hours loads
K-12 school buildings
Districts run many small buildings with few engineers. Classroom air and simple scheduling matter more than complex plant.
- CO2 per classroom, against a ventilation target
- Weekend and holiday running found across the district
- One dashboard for every school
- Measured
- classroom air, building energy and water
- Target
- healthy classrooms, no empty-building waste
- Aqueduct
- district-wide view with per-school alerts
Campus load follows the calendar. Baselines should too
A flat annual baseline makes a quiet summer look like savings and a busy exam week look like waste. Aqueduct separates the calendar from the weather.
| Period | What changes | What Aqueduct does |
|---|---|---|
| Term time | Full timetable, peak occupancy in teaching buildings | Baselines per building for term weekdays, so real drift stands out |
| Exam weeks | Libraries and halls open late, other buildings quiet | Separates extended hours from waste in each building |
| Breaks and holidays | Most teaching buildings empty, residences partly occupied | Flags plant still running to term schedules |
| Summer | Conferences and research continue, teaching stops | Compares each building with its own summer baseline |
| Weekends | Low occupancy, some labs and sports in use | Finds buildings that never drop to a weekend base load |
| Events | Sports, graduation and open days | Records event use so it does not distort the baseline |
The shared systems behind every building
Many campuses run their own utilities. Losses in shared infrastructure are invisible from inside any one building.
Central plant
Chillers and boilers staged for peak load through the night and the holidays.
Plant energy, flows and temperatures.
Baselines plant against weather and the calendar.
District heating or steam
Failed steam traps, leaking mains and condensate lost to drain.
Steam or heat delivered per building against plant output.
Balances plant output against buildings, so distribution loss has a number.
Chilled water loop
Low delta T from buildings, so pumps move more water than the load needs.
Building chilled water flow and temperatures.
Ranks buildings by delta T so the worst offenders are fixed first.
Campus water mains
Old underground mains that leak for months.
Main supply against building meters.
A live campus water balance, so loss is localized to a zone.
Irrigation
Fixed schedules that water through rain.
Irrigation meters with weather.
Flags watering against rainfall.
Electrical distribution
Peak demand set by coincident loads, and buildings with no sub-meter.
Feeder and building meters.
Breaks the campus peak down by building and feeder.
From one building to the whole estate
Most campuses start with the buildings that cost most or worry the team most, then extend on the same model.
Connect what exists
Read the BMS, utility meters and any campus energy system already in place. Map buildings, floors and zones in aQ Core.
Baselines and the first list
Weather and calendar baselines for each metered building. Empty-building waste and out-of-hours plant usually appear first.
Classroom air and gaps
Air sensors in priority classrooms and halls, and sub-meters where buildings share a meter. Installed with Atria between classes.
Act and verify
Faults routed to the maintenance team, schedules aligned to the timetable where control is enabled, with owner approval, and savings verified at the meter.
Report to the board
Verified savings, water balance and air records gathered into the annual report the board and funders ask for.
What each part of the institution gets
Facilities director
A ranked list of faults and waste across the estate, so a small team works on the biggest problems first.
Learn moreSustainability office
Measured energy, water and carbon per building, with weather-normalized trends for climate commitments.
Learn moreFinance and the board
Savings verified at the meter and stated in money, which an auditor can trace.
Learn moreTeaching and research
Healthy classroom air and stable lab conditions, with evidence when a room is out of range.
Learn moreSources2 references cited on this page
Proven in live sites across sectors.
Anonymized results, verified at the meter.
sites in 21 countries run on Aqueduct.
and 9 clinics in one of India’s top hospital chains.
US airport running water intelligence on Aqueduct.
of commercial real estate under Aqueduct.
Features that matter here
Common questions
Yes. CO2, particulates, temperature and humidity per room, with ventilation response and continuous records.
Yes. One platform across buildings, with existing meters and points first.
Yes. Savings are verified at the meter against a baseline modeled before the claim.
Baselines include the academic calendar as well as weather, so a quiet summer is not counted as a saving and a busy exam week is not counted as waste.
Yes. Fan energy, run state and plug loads are read from meters and the BMS. Lab safety settings stay with your lab managers, and Aqueduct only reports the energy cost of each regime.
Access is set by the institution. Many campuses share selected building data for teaching and research projects, under their own data policies.
It starts with what exists, then adds sub-meters where the balance shows a shared meter is hiding a problem. Until then, shared buildings are reported together, with the gap visible.
Yes. Plant output is balanced against the heat delivered to each metered building, so distribution losses from traps and mains get a number.
See Aqueduct on your own facility.
Bring a site, a utility bill or a question. We will show you where the loss is.