Portfolio energy management for real estate, building by building and verified
Portfolio energy management for real estate compares every building on the same basis and directs capital to the worst performers. Aqueduct ranks sites on normalized water and energy intensity and on performance against a weather-normalized baseline, validates bills, bills tenants from sub-meters, and verifies every saving at the meter. A commercial real estate client with a 20M+ sq ft portfolio uses it.
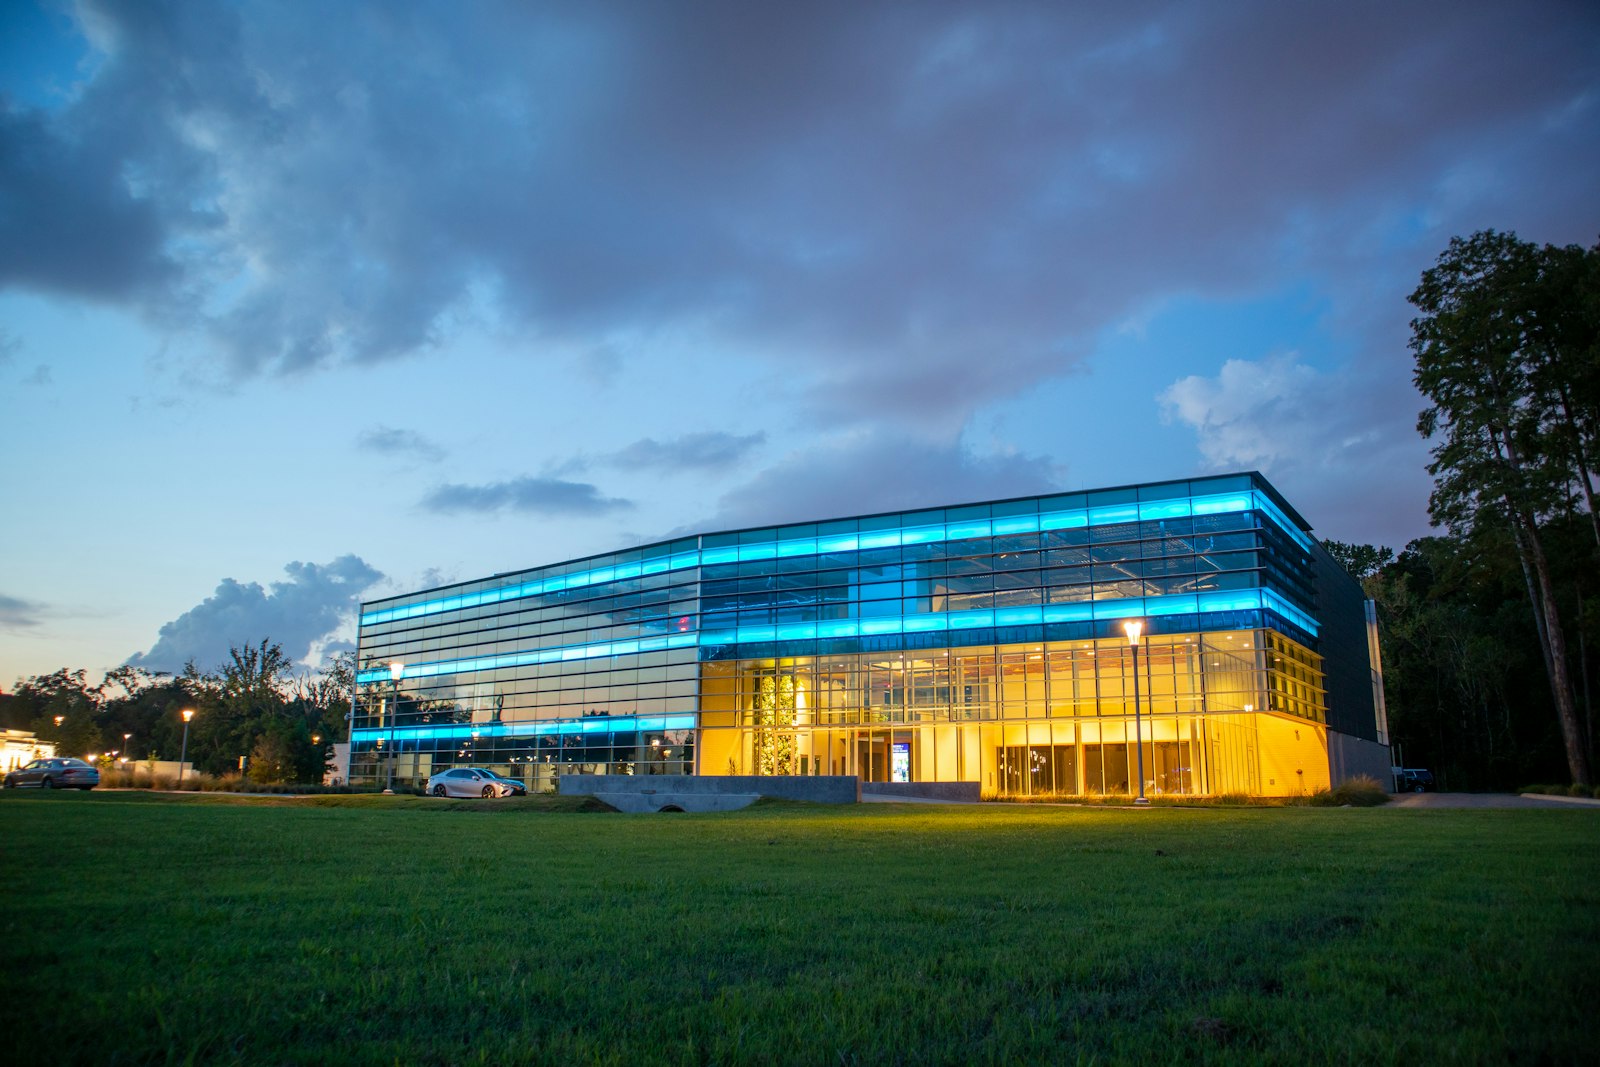

Every building on the same basis, and capital sent where the meter says.
Every building on one basis, ranked by measured gap
- Against its own baseline
Each site is compared with what weather and history say it should use, not with its neighbor.
- Normalized intensity
Per square foot and per visitor figures make buildings of different sizes comparable.
- Top improvers, needs attention
Filters surface the sites gaining ground and the ones slipping, every month.

Tenant bills from meters, not from floor area
- Dedicated and shared meters
Each tenant's meters are mapped, with shares on shared meters calculated from data.
- Anomalies per tenant
A tenant's usage outside its own usual range is flagged before the bill goes out.
- Recovery tracked
Portfolio insights show who drives cost, at which site, and how much has been recovered.

Acquisitions join the portfolio view quickly
- Day-one baseline
Uploading 6 to 12 months of bills puts a new building on the ranking straight away.
- Any BMS, any meter
Device agnostic ingest over BACnet, Modbus, MQTT and LoRaWAN, with installation through partners.
- Three doors
Keep the BMS a building has, replace it, or build Aqueduct into a new development.

Real estate portfolios, before and after Aqueduct
- Buildings compared on raw totals, so size hides waste.
- Capital goes to the loudest site, not the worst one.
- Utility costs recovered by floor area and disputed.
- Each acquisition adds another system that never rolls up.
- Savings reports cannot be reconciled to bills.
 The Aqueduct way
- Buildings compared on normalized, weather-adjusted intensity.
- Capital ranked by measured gap against baseline.
- Tenants billed from dedicated and shared meters.
- Every building rolls up to one portfolio view.
- Savings reconcile to the meter and the bill.
What portfolio leaders struggle with
Dozens of buildings, different systems, different vendors, and no common yardstick.
No common yardstick
Sites are compared on raw consumption, so the largest building always looks worst and the leakiest small one hides.
Capital spent on hunches
Retrofit budgets go to the loudest site manager rather than the building with the biggest measured gap.
Tenant recovery leaks
Shared meters and square-foot allocations mean utility costs are recovered unevenly and disputed often.
Every building is a different stack
Each acquisition brings its own BMS, meters and vendor, and nothing rolls up.
What real estate leaders get from Aqueduct
One portfolio view, every building on the same basis.
Portfolio ranking
Sites ranked on performance against baseline, with top improvers and needs attention.
Learn moreNormalized intensity
Water and energy per square foot and per visitor, comparable across buildings.
Learn moreQuestions real estate leaders ask
“Which buildings should get capital first?”
The ones with the largest measured gap against their weather-normalized baseline, priced in money from your own utility rates.
“Can tenants see their own consumption without seeing others'?”
Yes. A landlord sees total consumption and each tenant's share of a shared meter, while a tenant sees only its own share.
“Do we need to rip out every building's BMS?”
No. Aqueduct can work across the BMS you keep, replace it where it makes sense, or be built into new developments.
“How fast can a new building join the portfolio view?”
Uploading 6 to 12 months of utility bills gives a day-one baseline, before any new metering is installed.

How Aqueduct shows up in a portfolio leader's quarter
An illustrative quarter across a mixed office and retail portfolio.
Month one
The portfolio view ranks every building on performance against baseline. Three sites sit far above expected use.
Month two
Findings at those sites go to the facilities teams: night water flow at one, HVAC schedules at another, a bill error at the third.
Month three
Verified savings are confirmed at the meter, tenant bills reconcile with sub-meters, and capital requests are ranked by measured gap.
Features and industries real estate teams use most
Where portfolio leaders spend their time.
Where teams put it to work

A 20M+ sq ft portfolio on one view
A commercial real estate client with a 20M+ sq ft portfolio ranks buildings on normalized intensity and acts on the outliers first.
Learn more
Tenant bills that hold up
Billing Management generates tenant bills from metered data, with anomalies flagged per tenant before any invoice goes out.
Learn more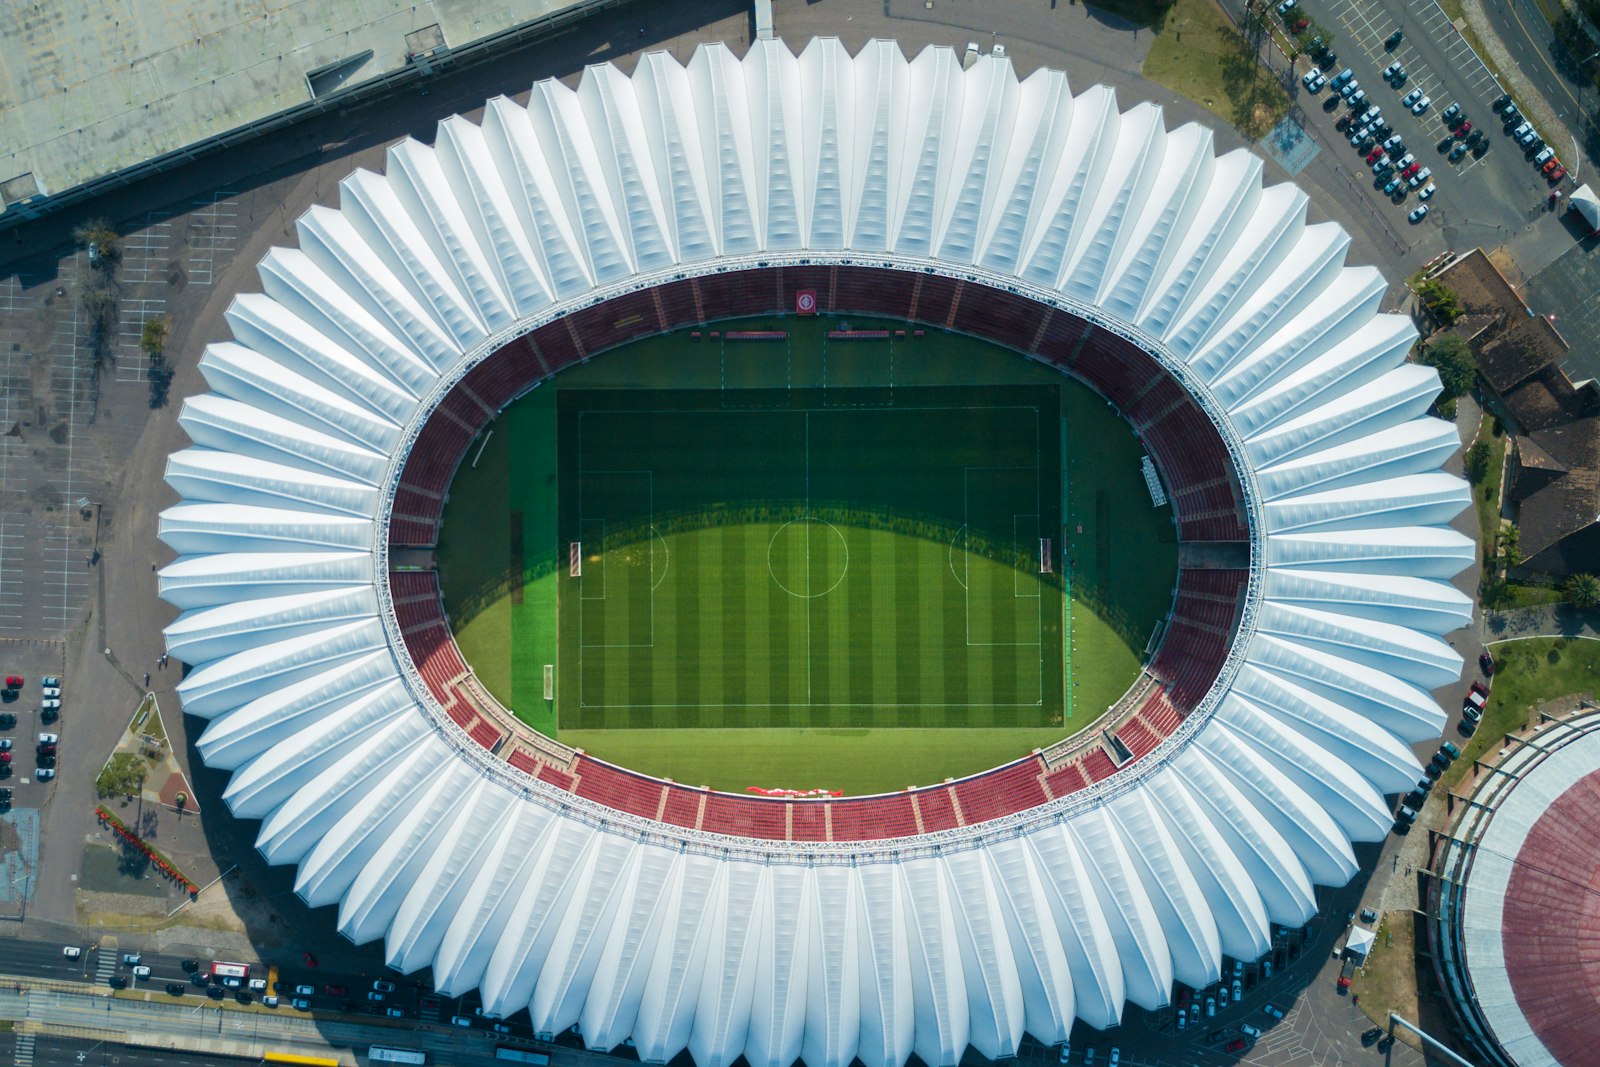
Large assets with event-driven load
Stadiums and venues see water and energy follow the event calendar, with baselines that account for crowds and weather.
Learn morePortfolio decisions that depend on measured building data
Real estate leaders allocate capital, set leasing terms and answer investor questions. Each of those now asks for building performance that can be measured and defended.
Which assets get capital
The building with the largest measured gap against its own weather-normalized baseline is usually a better bet than the one with the loudest request.
- Gap priced from each building's own rates
- Drill-down from asset to floor to line
- Verified result after the project
- Measured
- use against baseline per asset
- Decision
- capital ranking
- Aqueduct
- evidence for each ask
How utilities are recovered
Tenants increasingly ask how their share was calculated. Bills from dedicated and shared meters can be checked by the tenant, which reduces disputes.
- Shares of shared meters calculated from data
- Tenants see only their own share
- Anomalies flagged per tenant before billing
- Measured
- tenant consumption
- Decision
- recovery terms
- Aqueduct
- bills from the meter
What each market requires
Benchmarking and disclosure rules differ by market and keep tightening. Measured, normalized data makes each submission a report rather than a project.
- Water and energy intensity per square foot
- Weather-normalized trends
- Monthly exports for your consultant
- Measured
- intensity and trend
- Decision
- which assets need attention before disclosure
- Aqueduct
- the data behind the filing
What you are buying
Utility bills for a target asset can give a baseline before close, and the asset joins the portfolio view on day one after it.
- Day-one baseline from 6 to 12 months of bills
- Any BMS, any meter that emits telemetry
- Integration priority set by measured gap
- Measured
- historical consumption
- Decision
- integration plan
- Aqueduct
- fast onboarding to aQ Core
How new buildings are specified
New developments can specify meters, sub-meters and controllers at design stage, so the twin matches the drawings at handover.
- Sub-metering designed for tenant billing
- Controllers ready for Smart Controls
- Handover with a working digital twin
- Measured
- from day one of operation
- Decision
- design-stage specification
- Aqueduct
- built in, not bolted on
Disclosure and cost pressure on portfolios
the year mandatory NABERS energy disclosure began for large office buildings in Australia
Source: NABERS: supporting industry through the Commercial Building Disclosure expansionDubai's target cut in electricity and water demand by 2030, against business as usual
Source: MEED: Dubai updates energy savings targetrise in combined US household water and sewer bills from 2019 to 2024
Source: Bluefield Research: U.S. water and sewer bill has increased 24% in five yearsThe portfolio metrics a real estate leader works from
Normalized so buildings of different size, use and climate can sit in one ranking.
| Metric | Normalized by | Used for |
|---|---|---|
| Energy use intensity | Floor area, weather | Capital ranking and disclosure |
| Water use intensity | Floor area and visitors | Water outliers and stewardship |
| Performance against baseline | Each building's own history and weather | Which assets slipped this quarter |
| Cost of the gap | Each building's own rates | Business case for capital |
| Tenant recovery | Dedicated and shared meters | Recovery rate by asset |
| Billed versus metered | Billing period | Supplier errors across the portfolio |
| CO2 exposure, zone-hours | Zones monitored | Healthy building claims to tenants |
A portfolio rollout that pays for its own next phase
An illustrative sequence for a mixed office and retail portfolio.
Bills for every asset
Utility bills upload for the whole portfolio, giving a first ranking on baseline and intensity before any hardware.
Instrument the outliers
The worst-ranked assets get sub-metering and BMS connections, so the ranking gains a cause.
Fix and verify
Findings route to site teams, control is enabled where approved by the owner, and savings are verified at the meter.
Tenant billing and disclosure
Tenant bills move to meters, and monthly exports feed disclosure and investor reporting.
sites in 21 countries run on Aqueduct.
and 9 clinics in one of India’s top hospital chains.
US airport running water intelligence on Aqueduct.
of commercial real estate under Aqueduct.
FMCG manufacturing campus.
operations run on Aqueduct.





Related
Common questions
It is the practice of measuring, comparing and improving energy and water use across many buildings on a common basis. Aqueduct ranks every site on normalized intensity and performance against a weather-normalized baseline, then verifies each improvement at the meter.
Aqueduct normalizes consumption per square foot and per visitor, and builds each site's baseline by regression on usage plus cooling and heating degree days. That makes a large building in a hot climate comparable with a small one in a mild climate.
Yes. Aqueduct Billing Management tracks tenants, meters per tenant, dedicated and shared meters, and anomalies per tenant, and generates bills from metered data. It also shows how much cost has been recovered.
Yes. Aqueduct is device agnostic and reads BACnet, Modbus and other protocols, so buildings with different systems roll up to one portfolio view. You can keep, replace or build in by building.
Aqueduct is deployed in 275+ sites across 21 countries, and a commercial real estate client with a 20M+ sq ft portfolio uses it.
Results depend on each building's starting point and what is acted on. Savings are measured against a weather-normalized baseline and verified at the meter, so each owner sees its own result.
Yes. Uploading 6 to 12 months of bills per building gives a weather-normalized baseline and intensity ranking. Metering is then added where the ranking says it matters most.
Each building is compared with its own baseline, built from its own history and local cooling and heating degree days. That makes performance comparable without pretending the climates are the same.
It supplies measured, normalized water and energy data and monthly exports. Your team or consultant prepares and files the disclosure for each market.
Yes. A tenant sees its own dedicated meters and its own share of shared meters, while the landlord sees the total and every share.
See Aqueduct on your own facility.
Bring a site, a utility bill or a question. We will show you where the loss is.