A weather normalized baseline for buildings, set before any saving is claimed.
A weather normalized baseline is the energy or water a building would have used under the actual weather, modeled from its own history. Aqueduct builds it by regression on past usage plus cooling and heating degree days, so a mild month is not mistaken for a saving and a hot one is not mistaken for waste.
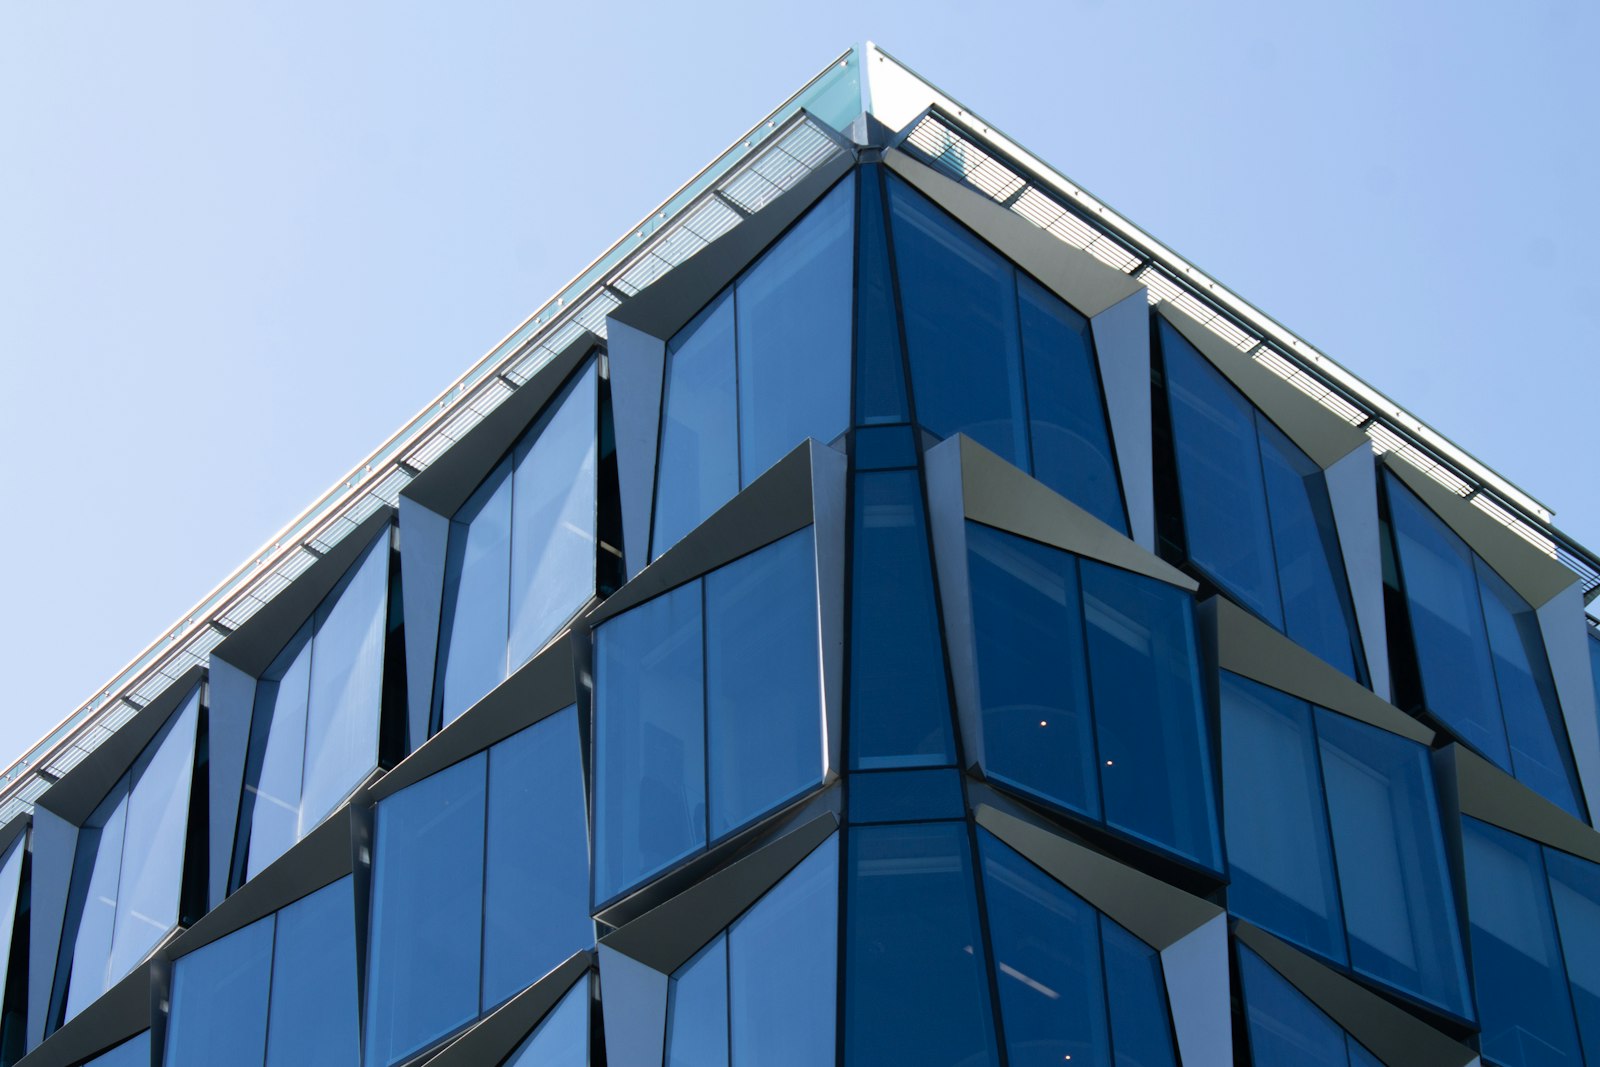
Know what usage should have been before anyone claims a saving.
Results from the first day, not after a year
- Upload your bills
Upload 6 to 12 months of utility bills and Aqueduct builds the expected baseline straight away.
- Or let it learn
Where bills are missing, Aqueduct runs at the site for weeks or months and fits the baseline from meters.
- Same method everywhere
Water, electricity and gas share one baselining method, so every outcome is measured the same way.

Weather taken out of the answer
- Local weather, not regional
Historical and live weather are pulled for the site's own location, not the nearest large city.
- Degree day modeling
Usage is modeled against degrees above or below a reference temperature, times the days it held.
- Fair across climates
A site in a hot climate is judged against its own weather, not against a mild one.

Every delta turned into a number finance uses
- Rate configuration
Rates from your bills convert the gap between actual and expected into money per site and per line.
- Above or below
Below the baseline is a saving. Above it is waste, flagged and priced before the next bill.
- Ranked for action
Top improvers and sites needing attention are sorted so the biggest gaps are worked first.
Baselining, before and after Aqueduct
- A cool summer passes for a successful efficiency project.
- New monitoring needs a year of data before any answer.
- Sites in hot climates always look like the worst performers.
- The gap stays in kWh or gallons, far from the budget.
- Year over year comparisons turn into arguments about the weather.
 The Aqueduct way
- Weather is modeled out, so only real change counts as saving.
- Uploaded bills give performance results on the first day.
- Each site is judged against its own local degree days.
- Rate configuration puts every gap into money per site.
- Adjusted baselines end the argument before it starts.
What baselining looks like without Aqueduct
Year over year comparisons tell you more about the weather than about your building.
Weather passed off as savings
A cool summer makes a project look like it worked. A hot one makes it look like it failed.
Waiting a year for an answer
New monitoring needs months of data before anyone can say whether usage is high.
Sites that cannot be compared
A site in a hot climate always looks worse than one in a mild climate, whatever its efficiency.
No price on the gap
Even when a difference is found, it stays in kWh or gallons and never reaches the budget conversation.
How the baseline is built
Powered by aQ EnergySmart and aQ WaterGuard. The same method serves electricity, gas and water.
Gather history
Aqueduct runs at the site for weeks or months, or you upload 6 to 12 months of utility bills so results start on day one. The baseline window is up to 12 months, with 6 months minimum.
Pull the weather
Historical weather is pulled for the site's location over the baseline period, and live weather is fetched going forward.
Fit the regression
Usage is modeled against cooling degree days and heating degree days: degrees above or below a reference temperature, multiplied by the days that condition held.
Compare actual to expected
Each period, actual use is set against the adjusted baseline. Below the baseline is a saving. Above it is waste.
Price the delta
Rate configuration from your bills converts the difference into money, per site and per line.
One baseline in use
An illustrative case at an office building.
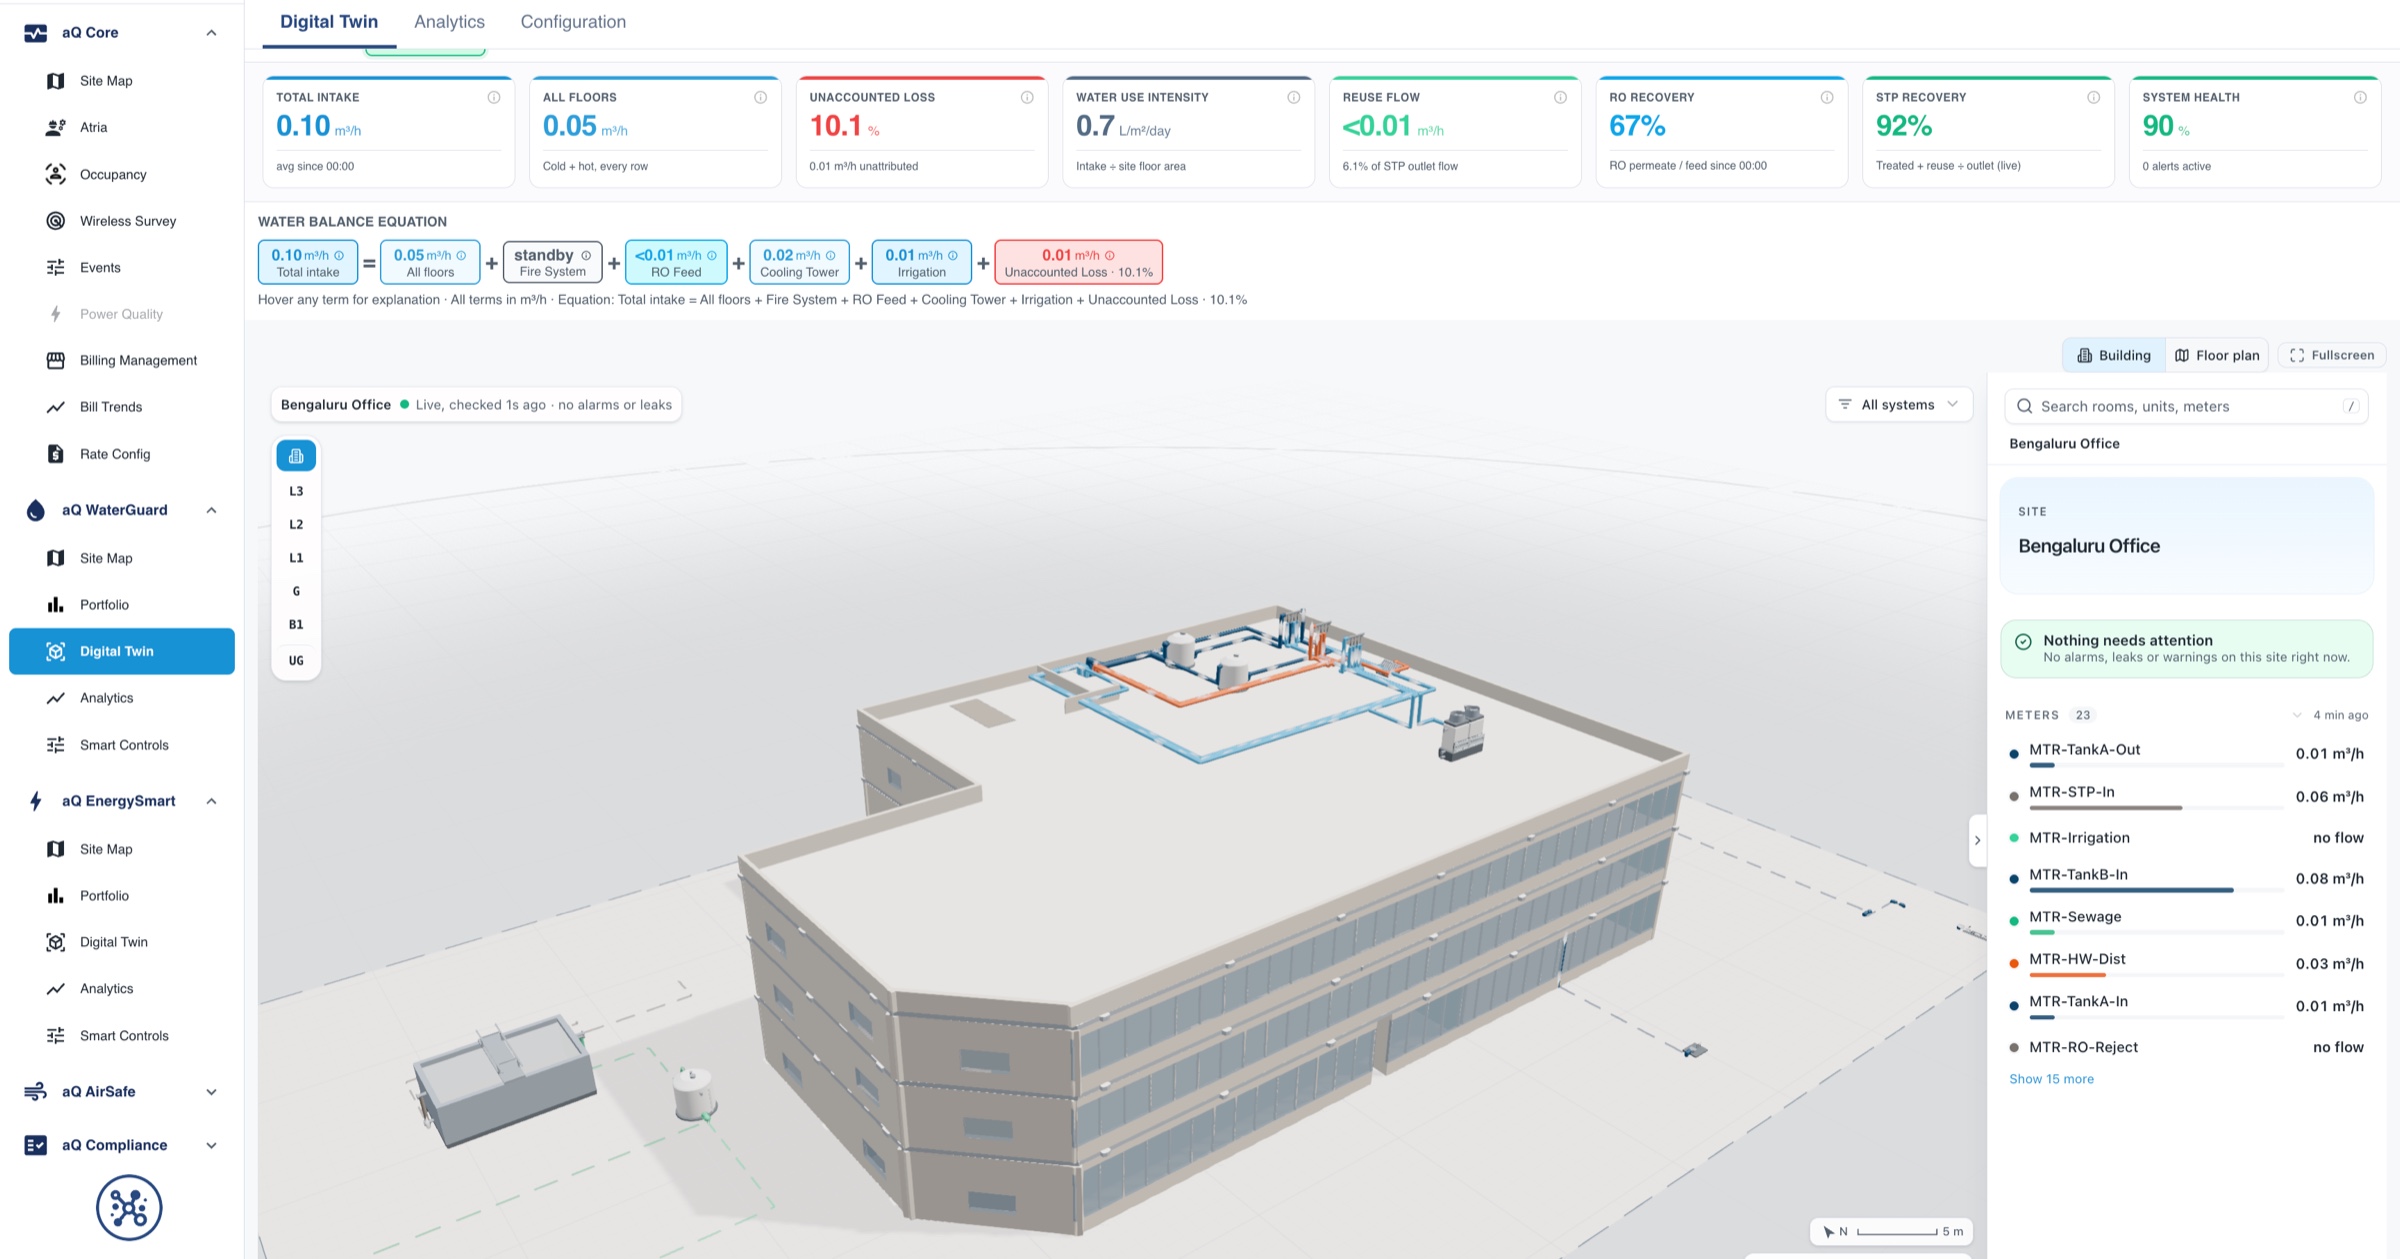
The owner uploads past utility bills and the main meter starts reporting.
Aqueduct fits a baseline on usage and degree days for the site's location.
In a mild month, actual use sits above the adjusted baseline even though the bill fell. The weather had hidden a scheduling problem.
A ticket goes to the CMMS to review the HVAC schedule, with the gap priced per month.
After the schedule fix, actual use moves below the adjusted baseline, and that result becomes the new baseline.
Problem, solution, impact
Savings claims that the weather can explain away.
Regression on usage plus cooling and heating degree days.
Savings and waste stated against what was expected, not against last year.
Seasonal water use read as a leak or a win.
The same baselining applied per site and per line.
Seasonal change separated from real change.
Portfolio rankings skewed by climate.
Each site measured against its own weather-adjusted expectation.
Fair comparison across portfolios as large as a commercial real estate client's 20M+ sq ft portfolio.
What you get
Day-one results
Upload 6 to 12 months of bills instead of waiting months of monitoring.
Degree day regression
Cooling and heating degree days for the site's own location.
Actual versus expected
Above and below baseline for every site, line and period.
Cost, not just volume
Rate configuration turns every delta into money.
Related standards and terms
The baseline supplies the inputs these methods ask for. Check the current rule for your program.
Where teams put it to work
Every building on one fair scale
Across a commercial real estate client's 20M+ sq ft portfolio, weather normalized baselines let owners compare buildings in different climates without arguing about the summer.
Learn more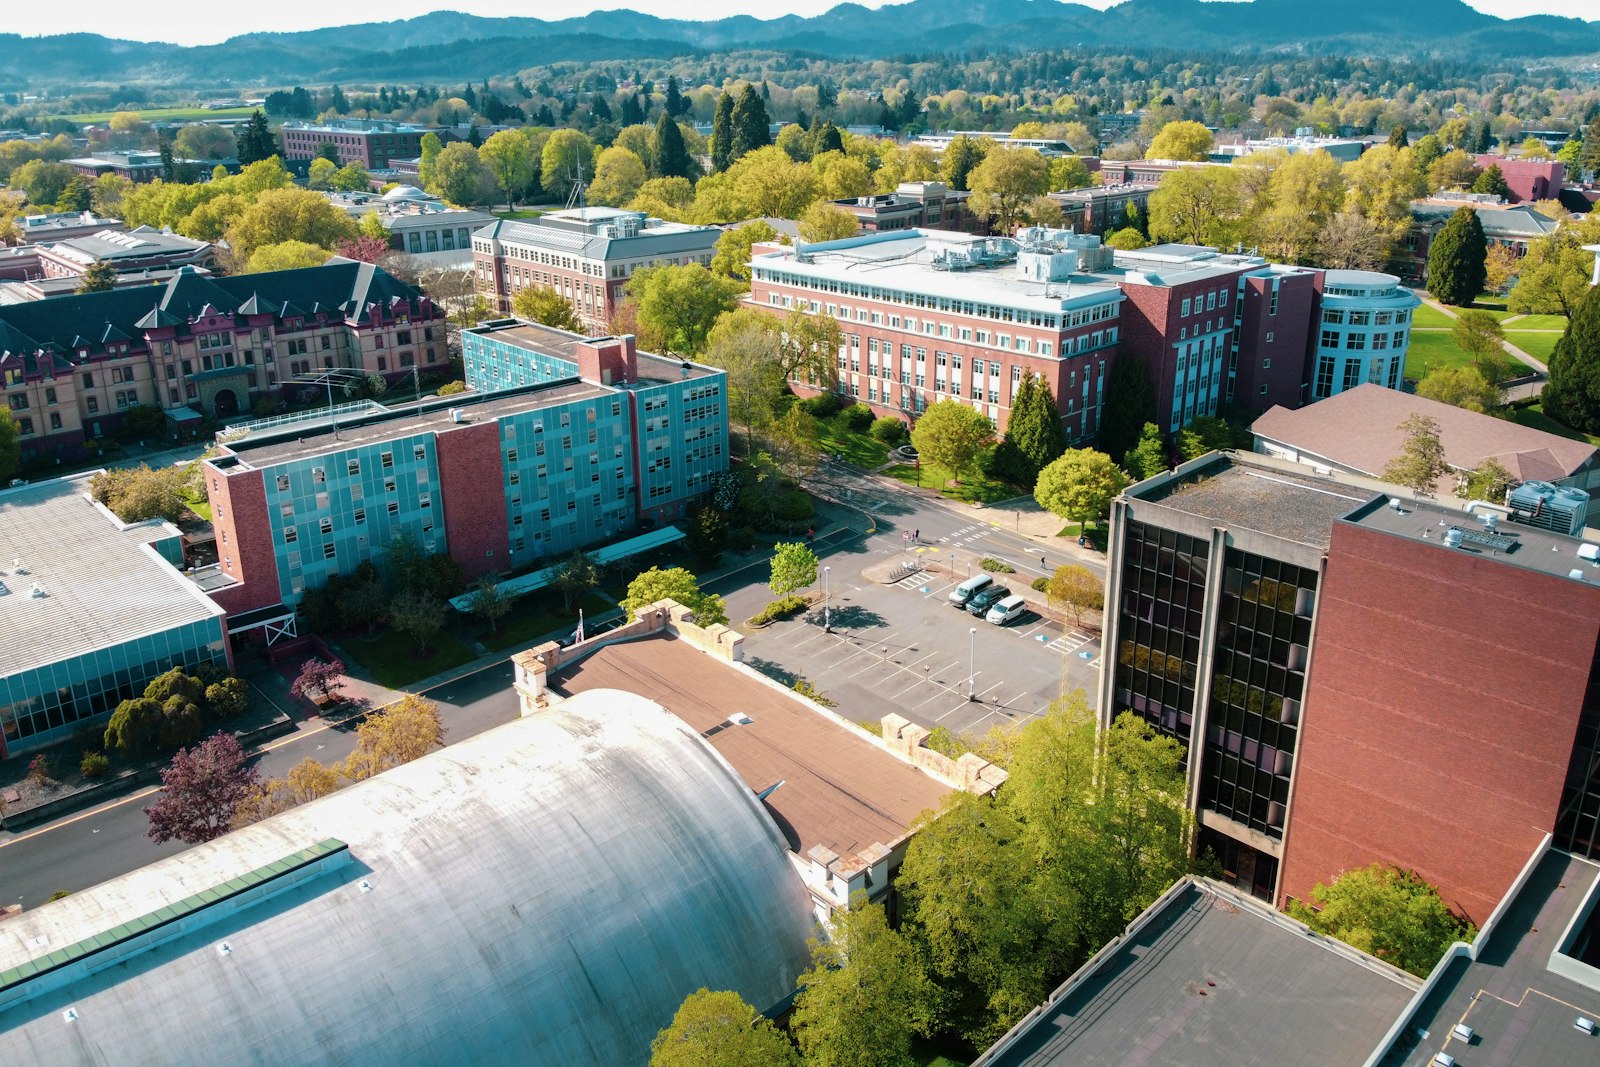
Budgets defended with adjusted numbers
Facilities teams show the board actual against expected use for each building, so a hot year does not erase a real saving.
Learn more
The expectation before the claim
A baseline set before the project starts gives owners and contractors one shared reference for every saving that follows.
Learn moreRelated
Common questions
It is the usage a building would have had under the actual weather, modeled from its own history. Comparing actual use to it removes the effect of a hot or mild period.
Six months minimum and up to 12 months. If you upload 6 to 12 months of utility bills, results can start on day one.
Yes. The same regression and rate configuration are used for electricity, gas and water.
Degrees above or below a reference temperature multiplied by the number of days that condition held. They measure how much cooling or heating the weather demanded.
See Aqueduct on your own facility.
Bring a site, a utility bill or a question. We will show you where the loss is.