A live water balance for facilities and campuses, closing every hour.
A water balance accounts for every gallon: water in must equal water used plus water lost. Aqueduct builds that balance live for each site, block and node from metered data, so the unaccounted remainder becomes a measured loss you can locate, fix and verify.
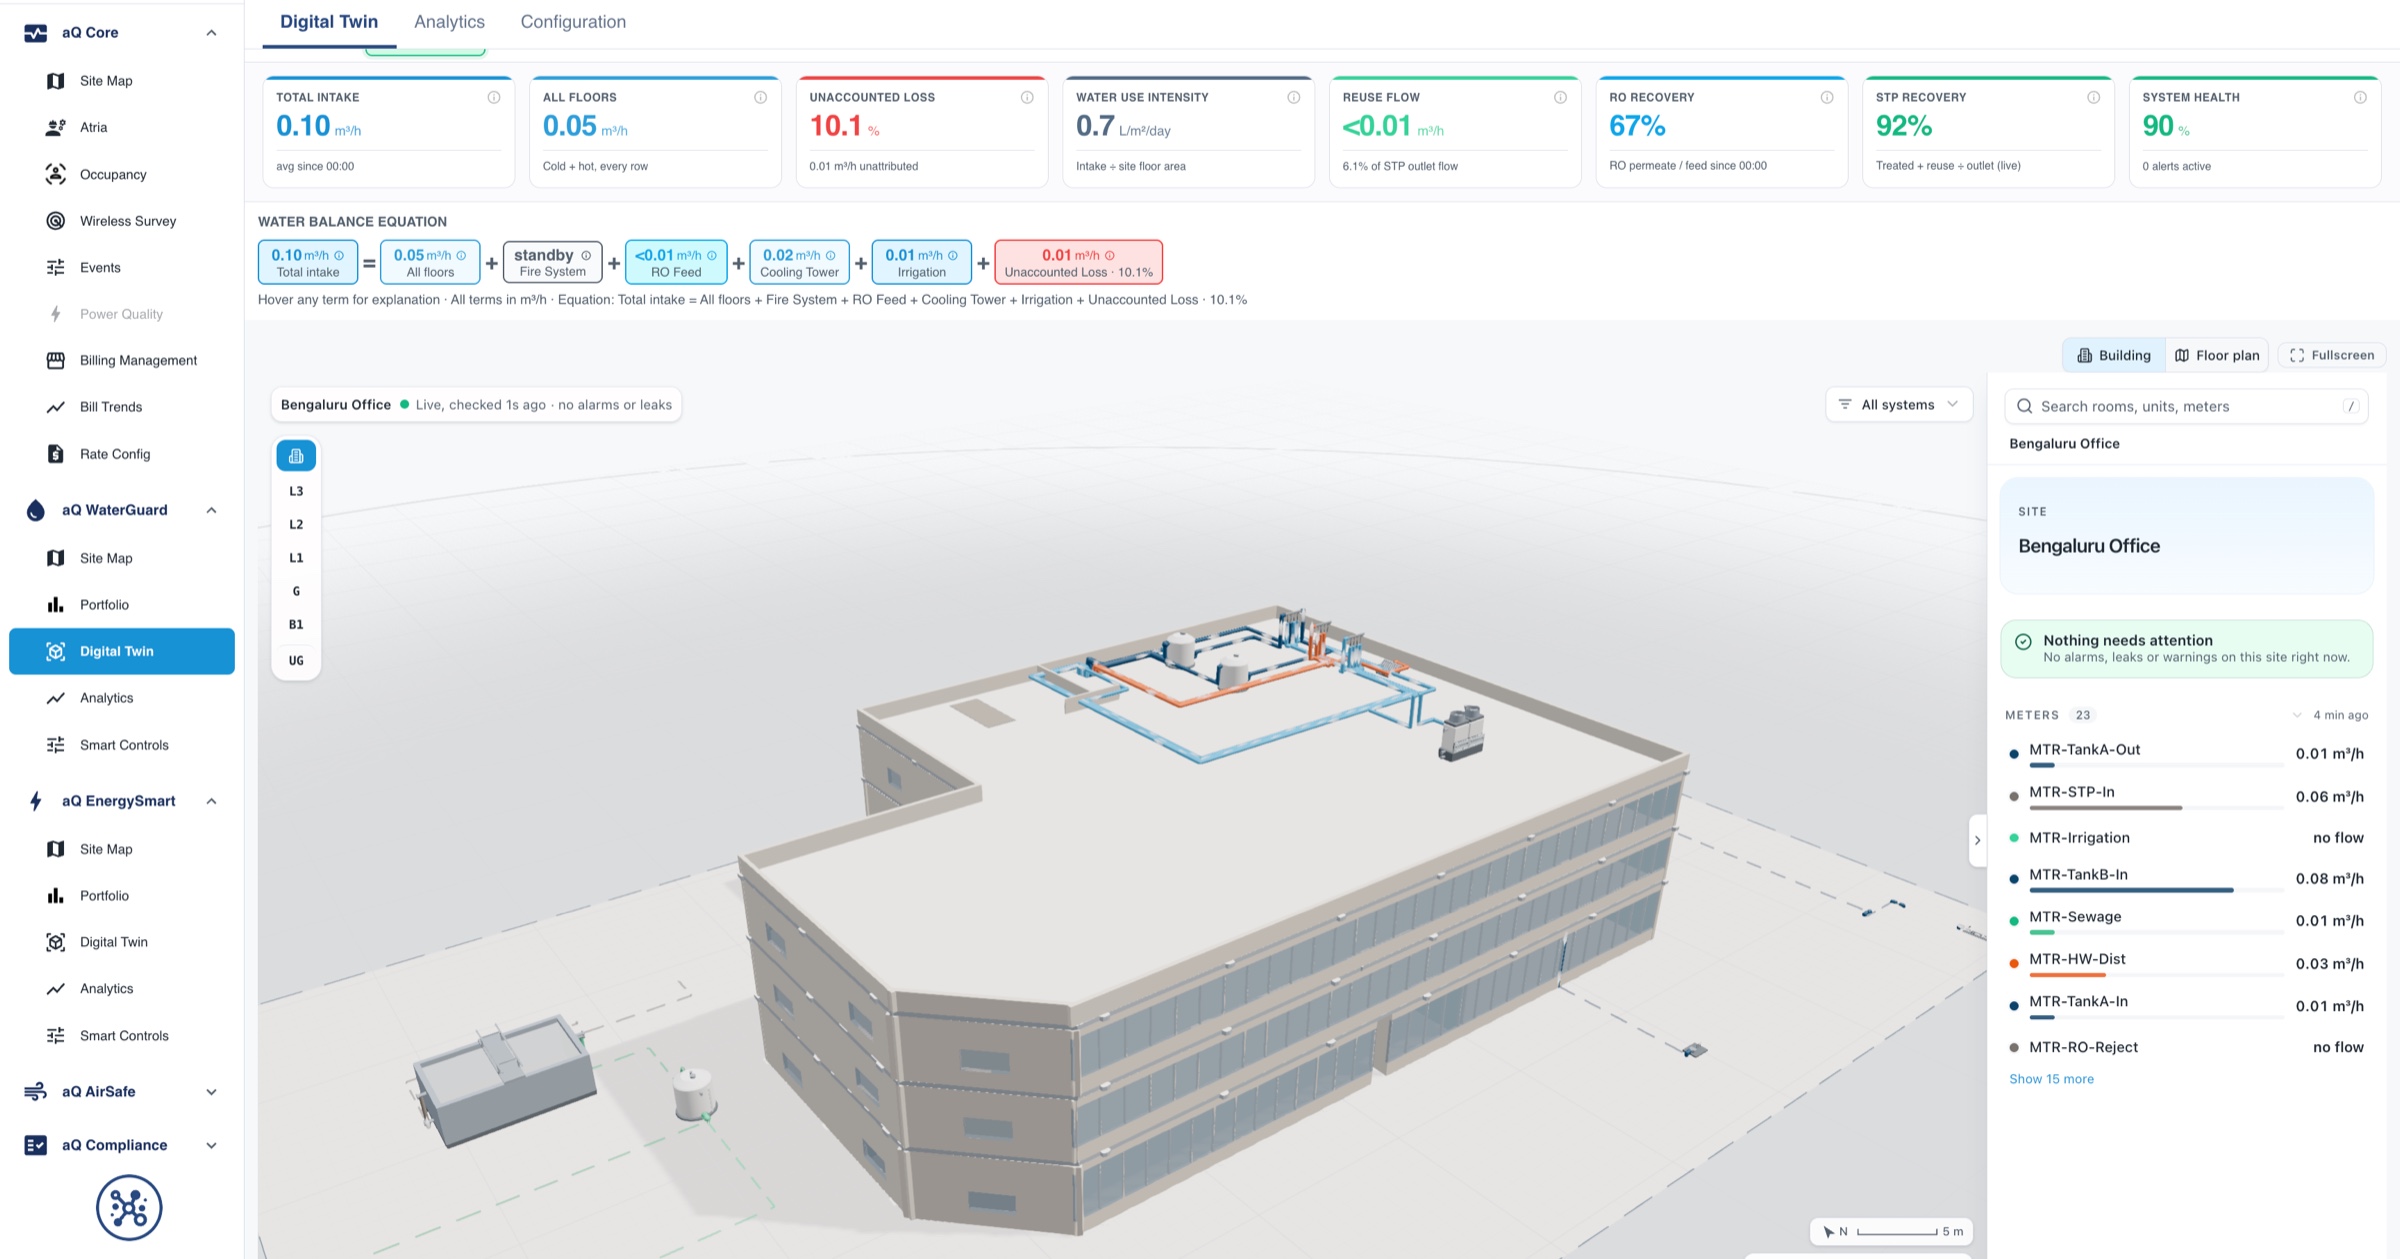
Every gallon in, every gallon used, and every gallon lost, closing all day.
Supply equals use plus loss, shown term by term
- Every term metered
Main supply, floors, fire system, RO feed and unaccounted loss each come from live telemetry, not estimates.
- Hover to explain
Each term carries an explanation of what it includes, so engineers and finance read the same balance.
- Refreshed constantly
The water twin updates every 60 seconds, so the balance reflects the building as it runs today.
RO and STP performance sit inside the same picture
- RO recovery tracked
Feed, permeate, reject and TDS show when recovery slips, so a membrane problem is not mistaken for a leak.
- STP efficiency tracked
Inlet, treated flow, efficiency and BOD out are read alongside the network, every hour of every day.
- Reuse counted properly
Reclaimed water enters the balance as its own line, so reuse claims rest on metered volumes.
Sites ranked fairly, whatever their size or use
- Intensity per square foot
Water use intensity puts a small clinic and a large campus on the same scale for comparison.
- Per visitor normalization
Usage per visitor separates a busy month from a wasteful one at airports, venues and campuses.
- Sankey view
One diagram shows water entering at the main inlet, where it splits, and where it is finally used.
Water accounting, before and after Aqueduct
- The water balance is an annual spreadsheet built for an audit.
- Cooling, irrigation and process lines are filled in with estimates.
- RO and STP performance are checked by hand, if at all.
- Reuse is reported but never metered against withdrawals.
- Sites with different meters and methods cannot be compared.
 The Aqueduct way
- The water balance is a live equation that closes all day.
- Every line is metered, so estimates stop absorbing the loss.
- Recovery and treatment efficiency are tracked every hour on the twin.
- Reuse sits in the same balance as every metered withdrawal.
- Intensity and per-visitor metrics make every site comparable.
What water accounting looks like without Aqueduct
Most sites do a water balance once, on paper, for an audit.
A once-a-year spreadsheet
The balance is assembled from bills and estimates for an audit, then goes stale the day it is filed.
Estimates fill the gaps
Cooling towers, irrigation, process and fire lines are estimated. The estimate absorbs the loss, so the loss disappears.
Water-positive claims are hard to defend
Reuse and recharge are reported but not metered into the same balance as withdrawals.
Sites cannot be compared
Different meters, different units and different methods make a portfolio view meaningless.
How the water balance works
Powered by aQ WaterGuard. One balance per site, built block by block.
Model the system you have
The water digital twin is built block by block to match the site: tanks, cold and hot headers, floors, RO, STP, reuse and waste lines. Not every site has every block.
Write the equation
The balance is shown as an actual equation, for example Main Supply equals All Floors plus Fire System plus RO Feed plus Unaccounted Loss, with each term live from meters.
Close it continuously
The twin updates every 60 seconds. Usage drills down from line to month, day and hour, so the balance is never an annual snapshot.
Normalize and compare
Water use intensity per square foot and per visitor lets sites be ranked fairly across the portfolio.
Turn the remainder into action
Unaccounted loss is located, priced and routed. Treatment efficiency for RO and STP is tracked in the same view.
One balance that stopped closing
An illustrative incident at a campus with RO and reuse.
Supply, floor, RO feed and reuse meters report into the campus water twin.
The balance shows the RO feed term rising while permeate output stays flat.
Recovery has dropped and reject flow is up. Aqueduct flags the RO unit, not a pipe leak, as the source of the gap.
A ticket goes to the CMMS to inspect membranes and the reject valve, with the recovery trend attached.
After service, recovery returns to its expected range and the balance closes again.
Problem, solution, impact
A balance that closes is the basis for every other water claim.
Loss hidden inside estimates.
Every term metered and reconciled, with unaccounted loss shown on its own.
Loss with an address, site by site, with every saving verified at the meter against a weather-normalized baseline.
Treatment plants run without efficiency tracking.
RO recovery and STP efficiency in the same balance view.
Plant problems caught as plant problems, not mistaken for leaks.
Pumping and heating costs are not tied to water use.
Hot water and pumped lines sit beside the energy view on the same data layer.
Water decisions made with their energy cost in view.
What you get
The balance as an equation
Each term live from meters, with a hover explanation of what it includes.
Block-by-block twin
Tanks, headers, floors, RO, STP and reuse, built to match the site.
Sankey view
Water from the main inlet to where it is finally used, in one picture.
Intensity and per-visitor metrics
Fair comparison across sites of different size and use.
Treatment efficiency
RO recovery and STP efficiency tracked with the balance.
Evidence for reporting
Metered withdrawals, reuse and loss. We supply the metrics; you file.
Related standards and programs
A metered balance supplies the inputs these frameworks ask for. Check the current rule.
Where teams put it to work
Balances that hold up in a program
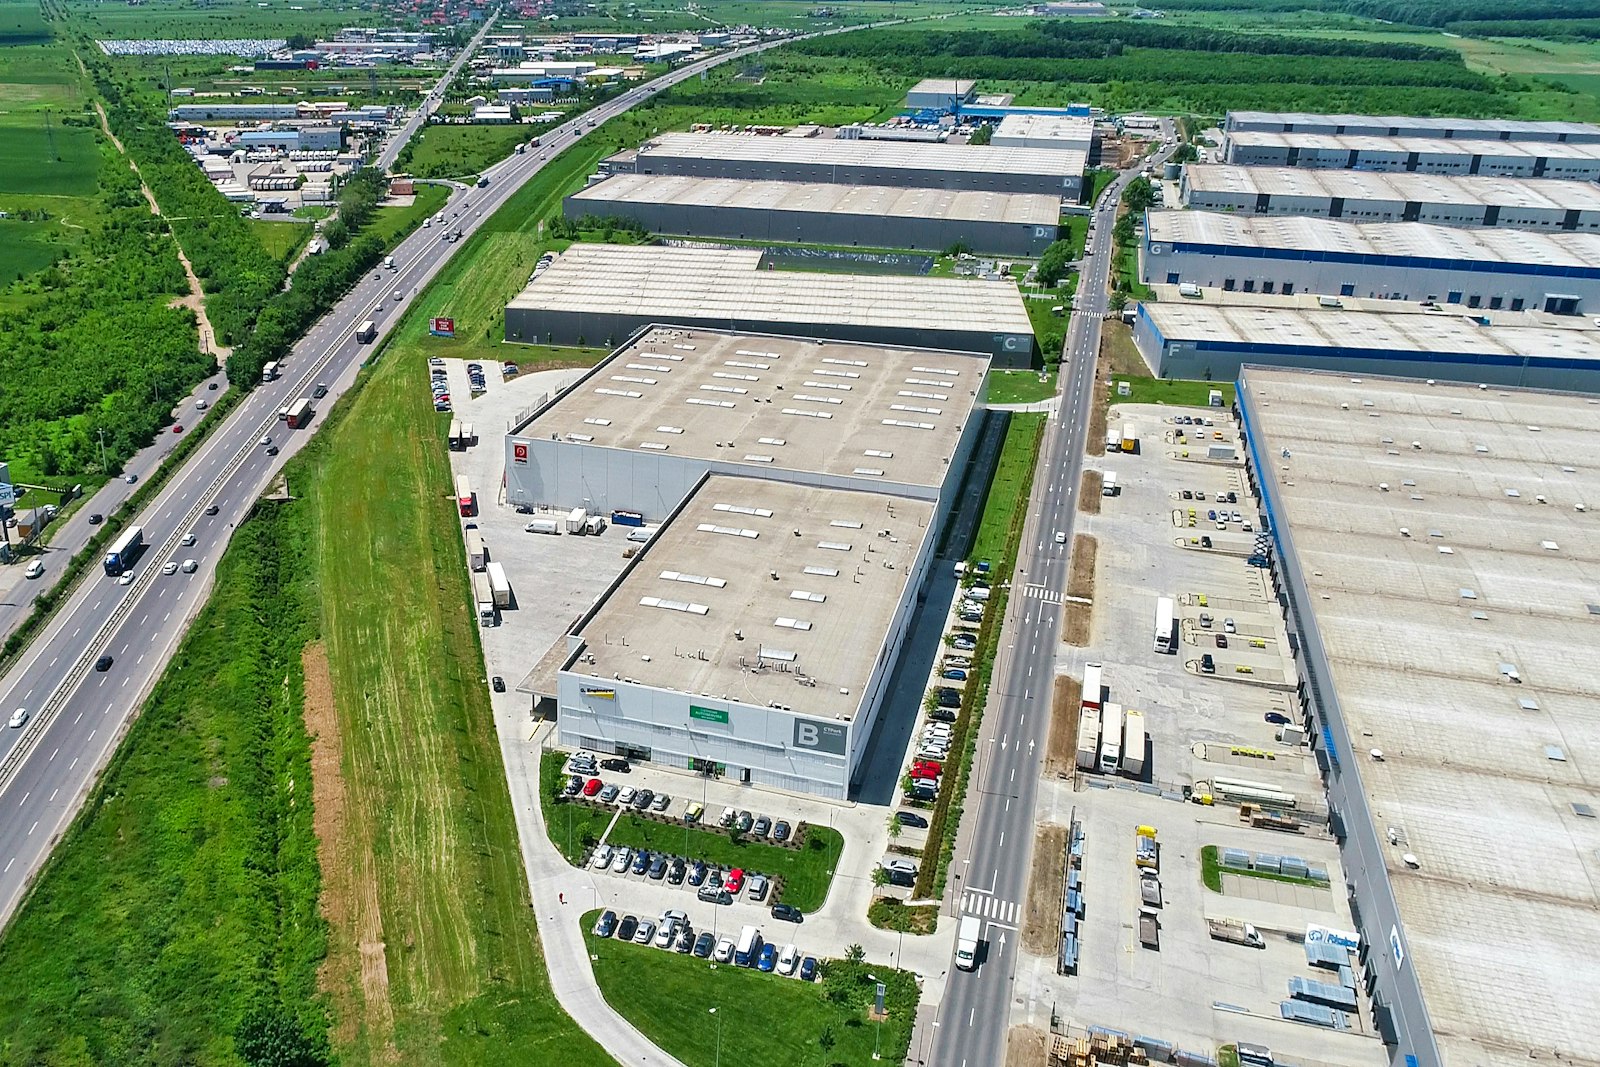
Metered withdrawals, reuse and loss in one balance give water stewardship programs site-level evidence. Every saving is verified at the meter against a weather-normalized baseline.
Learn more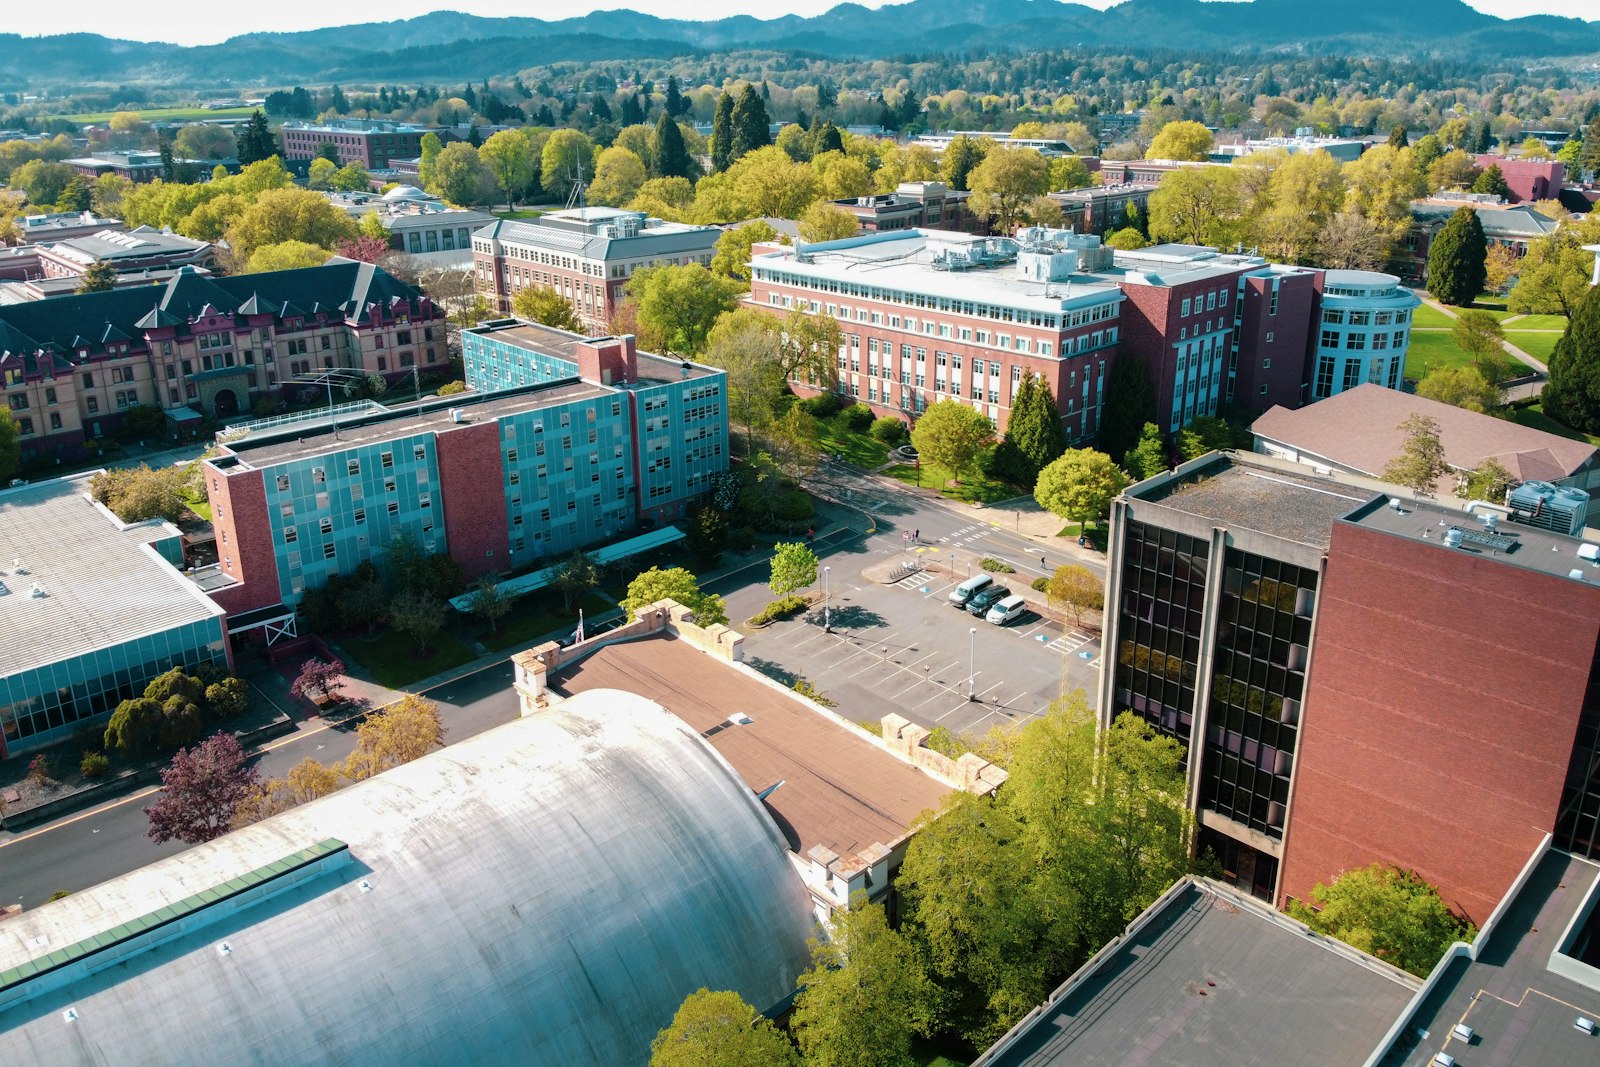
One balance across many buildings
Residence halls, labs and central plant lines reconcile to the campus supply, so the building that stopped closing is obvious the same day.
Learn more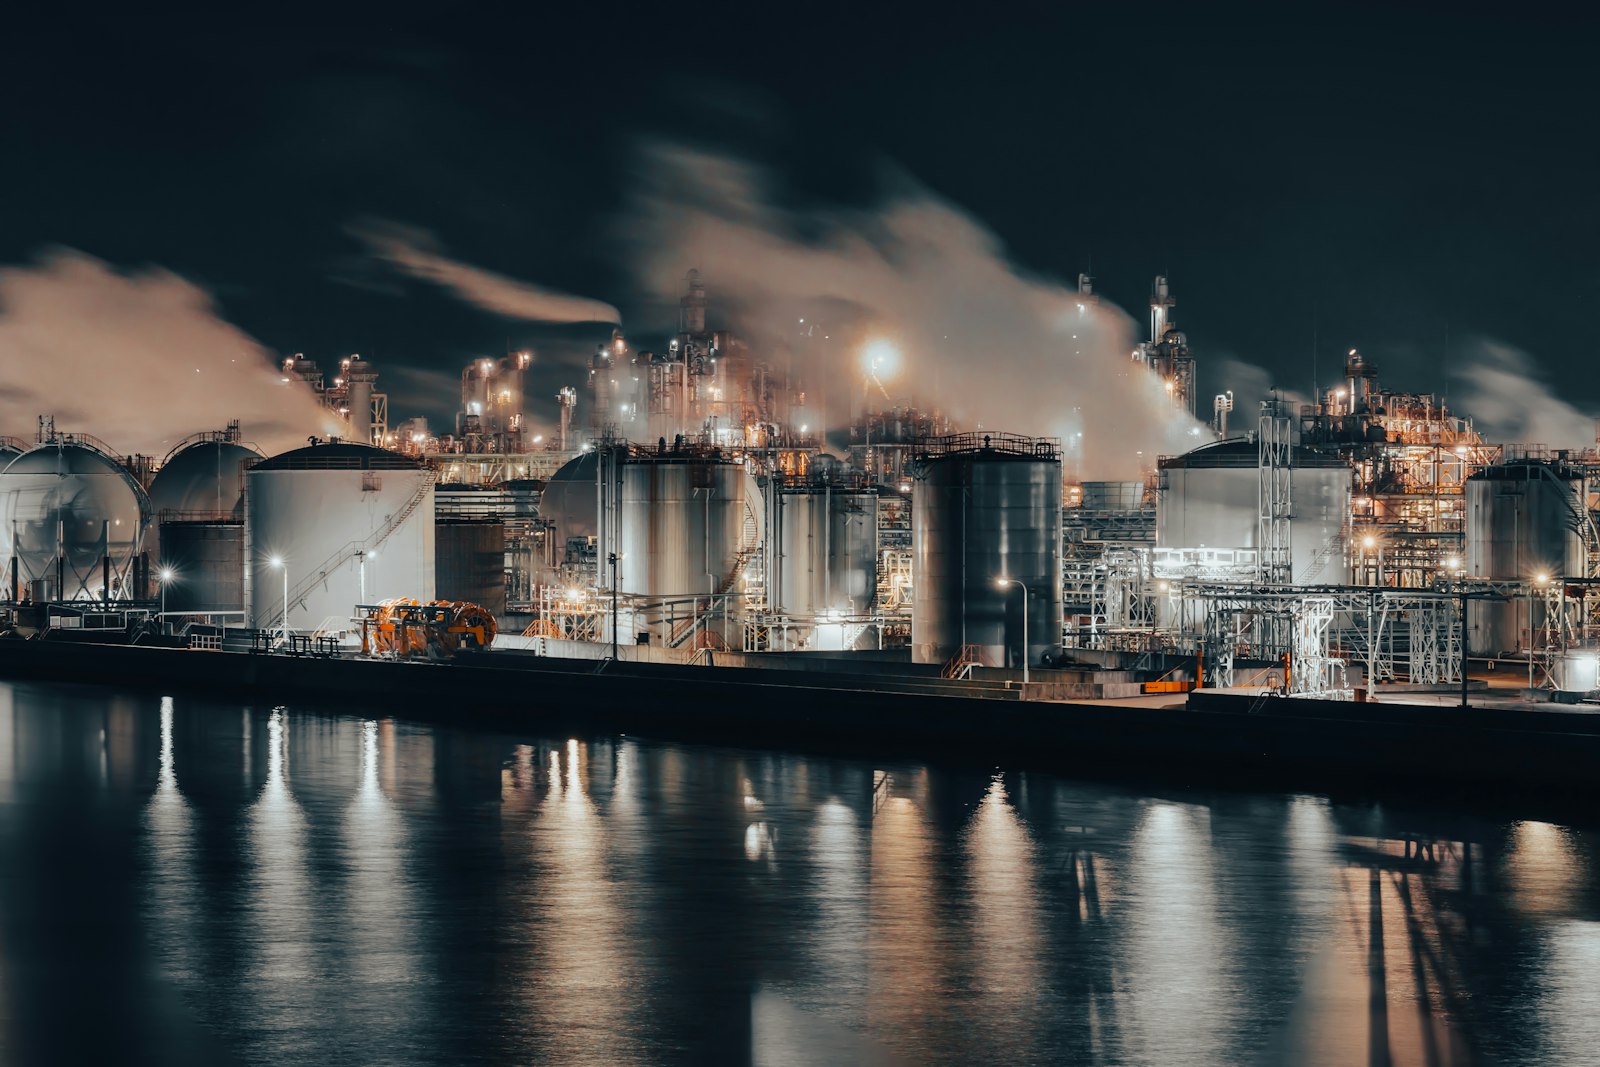
Process water with an address
Process, cooling and domestic lines are metered separately, so a rising process draw is seen as a production issue, not a building one.
Learn moreRelated
Common questions
It is an accounting of water in against water used and water lost. When every term is metered, the remainder is a measured loss rather than an estimate.
The water digital twin updates every 60 seconds from telemetry, and usage can be reviewed by hour, day and month.
The unmetered part shows up inside the unaccounted term. Aqueduct makes the coverage visible so you can decide where another meter is worth it.
Yes, where the site has them. RO, STP, reclaimed water and recharge are modeled as blocks in the same balance.
See Aqueduct on your own facility.
Bring a site, a utility bill or a question. We will show you where the loss is.