
Aqueduct case studies: how facility teams see, decide and act on water and energy
Aqueduct case studies show how Milvian AI deploys its facility intelligence platform in real operations. They cover live water stewardship across Amazon sites, a top 25 US airport, and engagements with a hospital chain, a commercial real estate developer, a major dairy operation and an FMCG manufacturing campus. Each page states the scope, the modules used and what was measured.
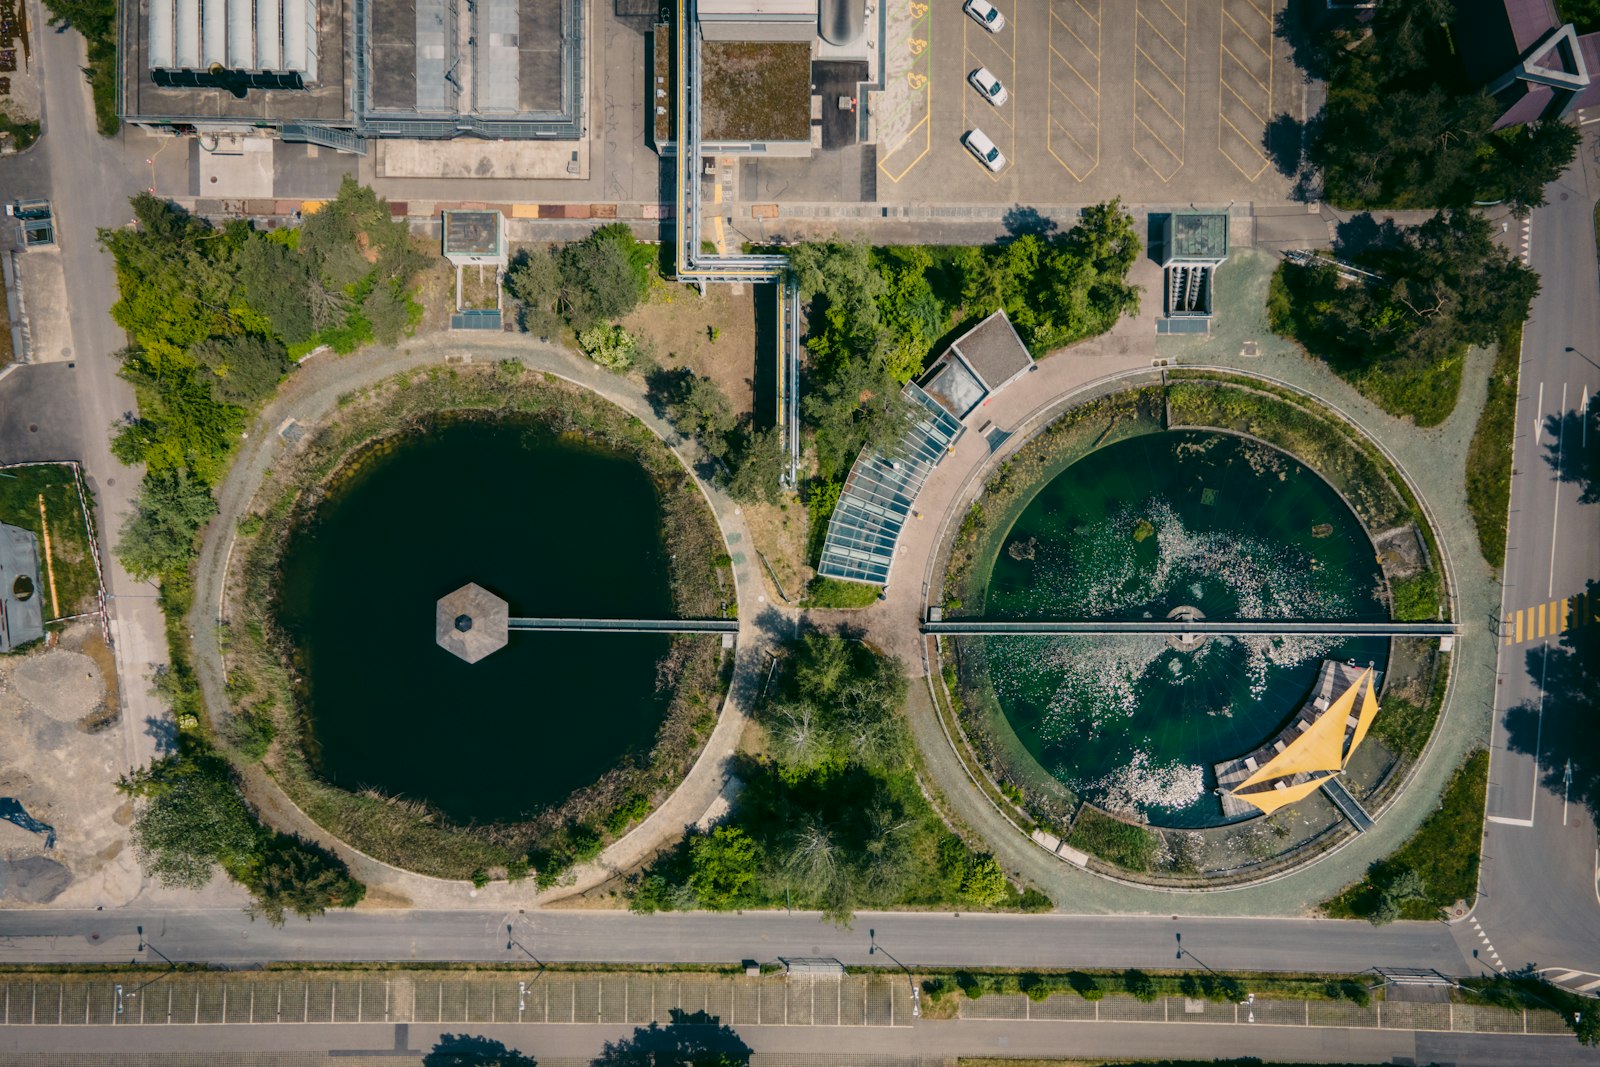 Logistics and corporate real estate
Water stewardship across Amazon's sites, measured in real time
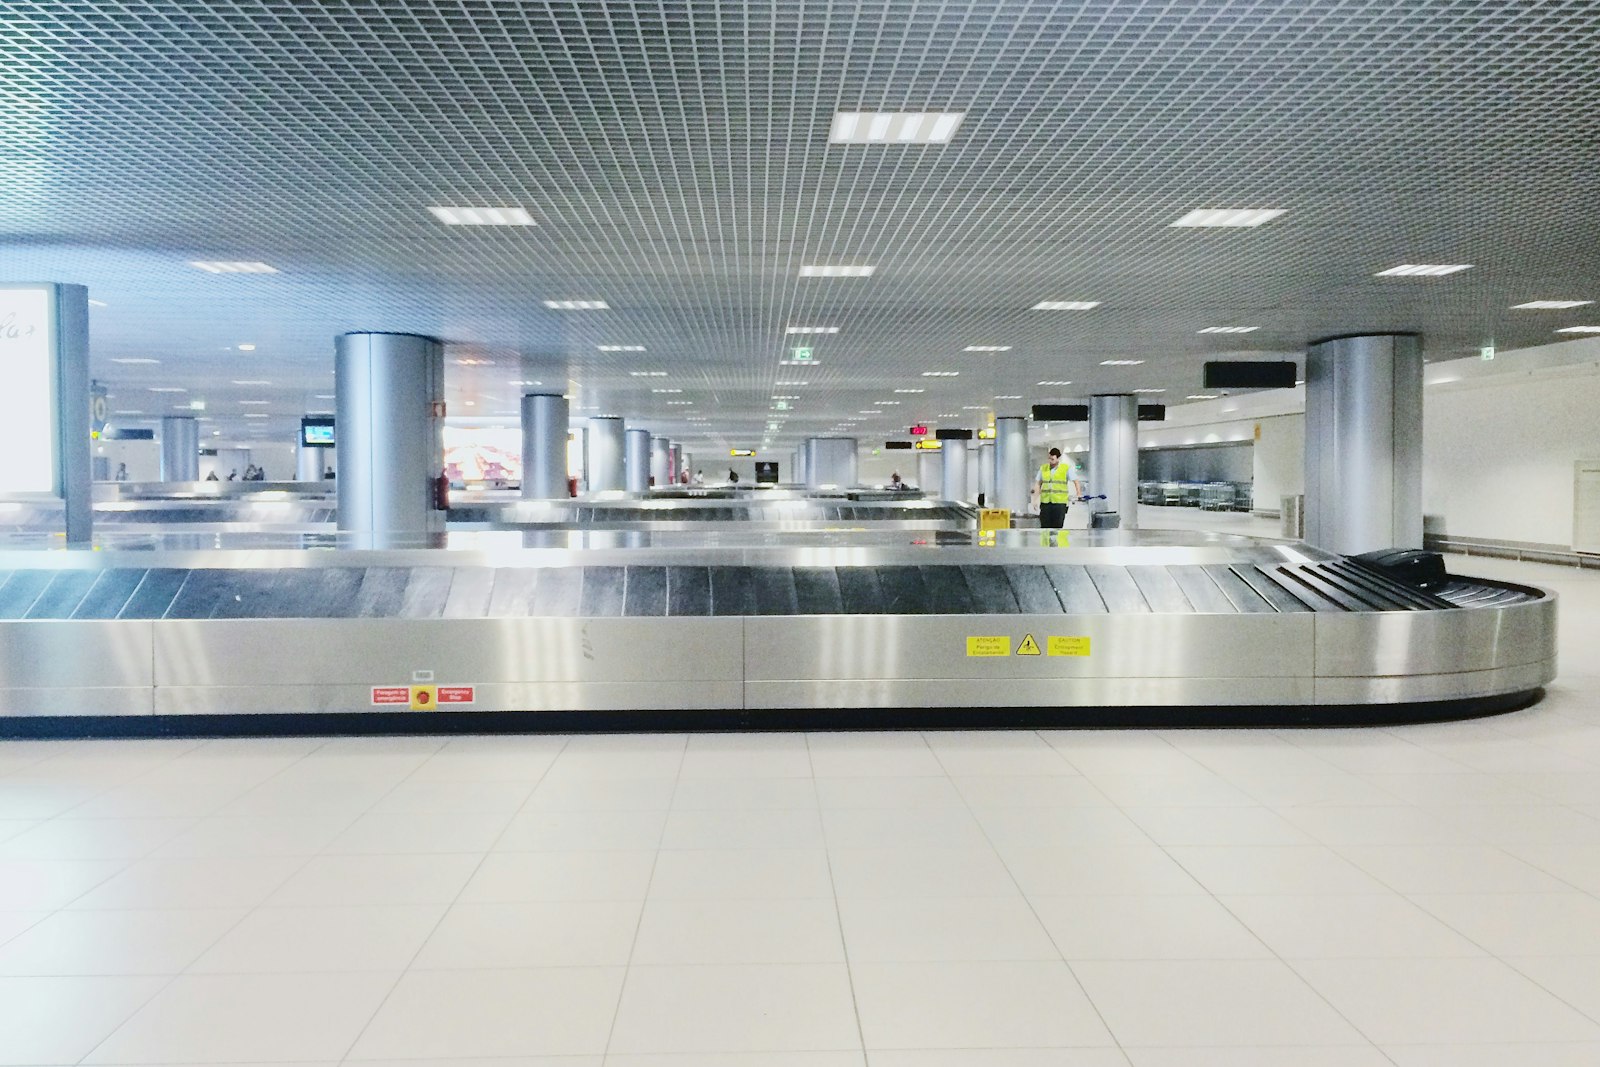 Aviation
A top 25 US airport live on Aqueduct in two weeks, with a major leak found at once
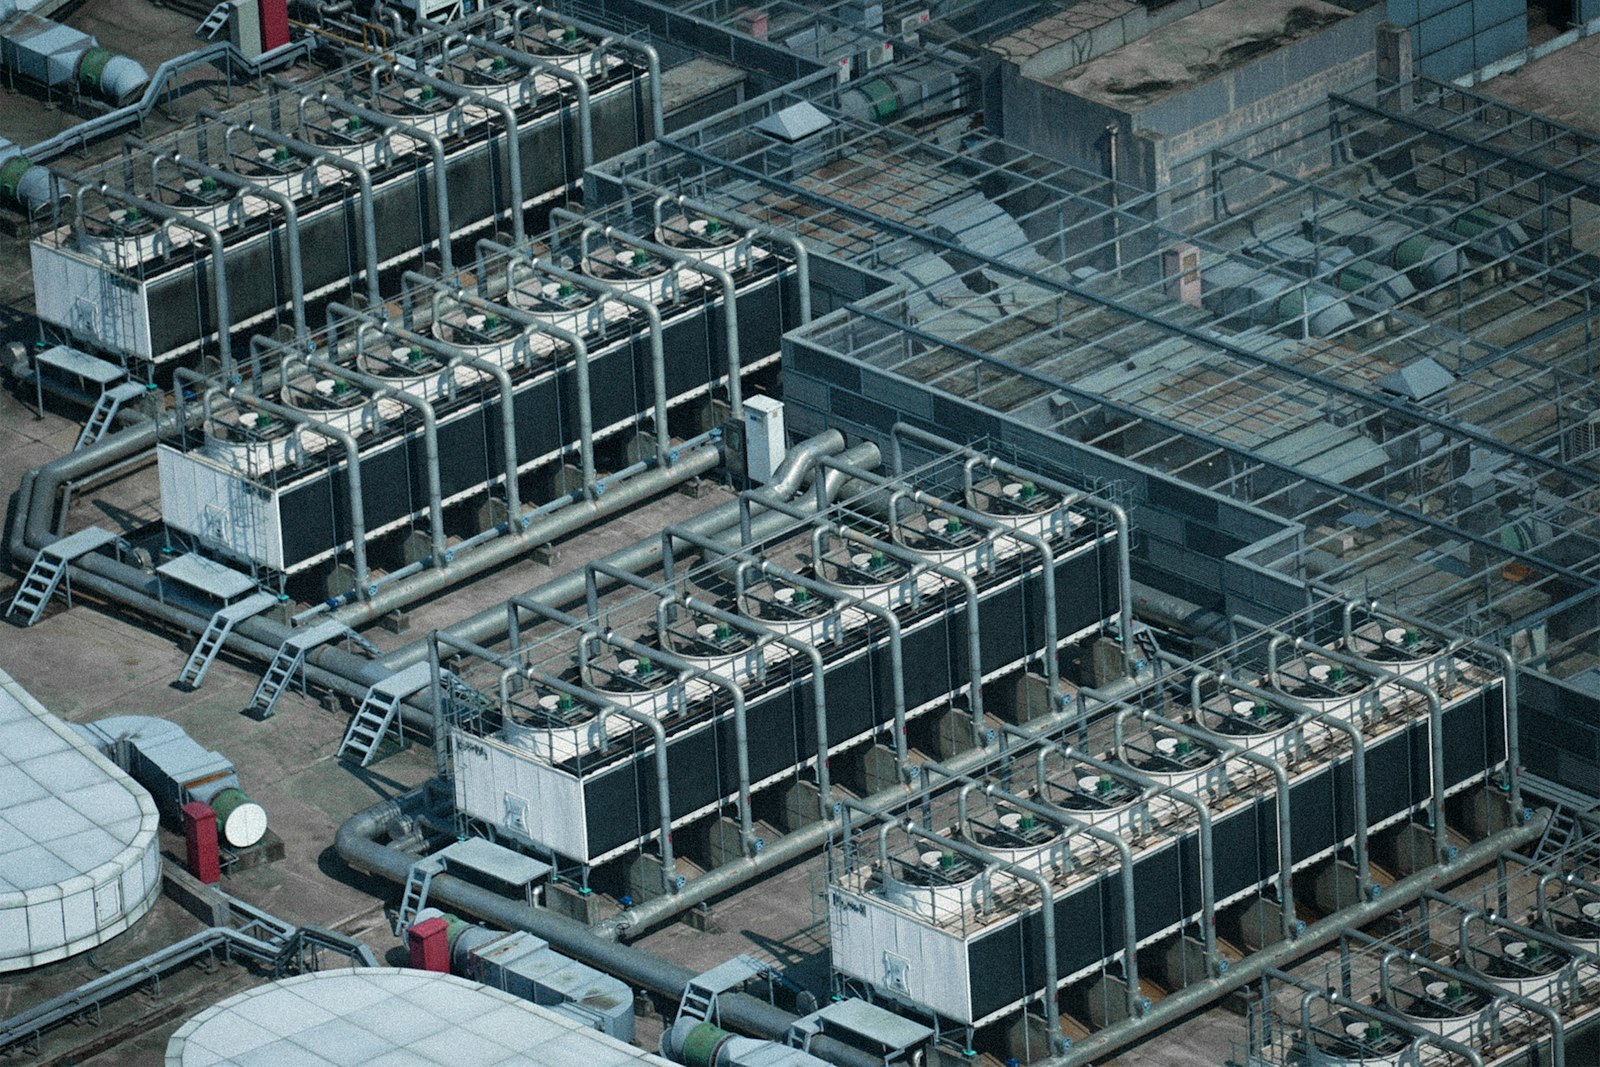 Healthcare
Utility and critical room intelligence for one of India's top hospital chains
 Commercial real estate
Recharge, chiller plant and water intelligence for a 20M+ sq ft developer
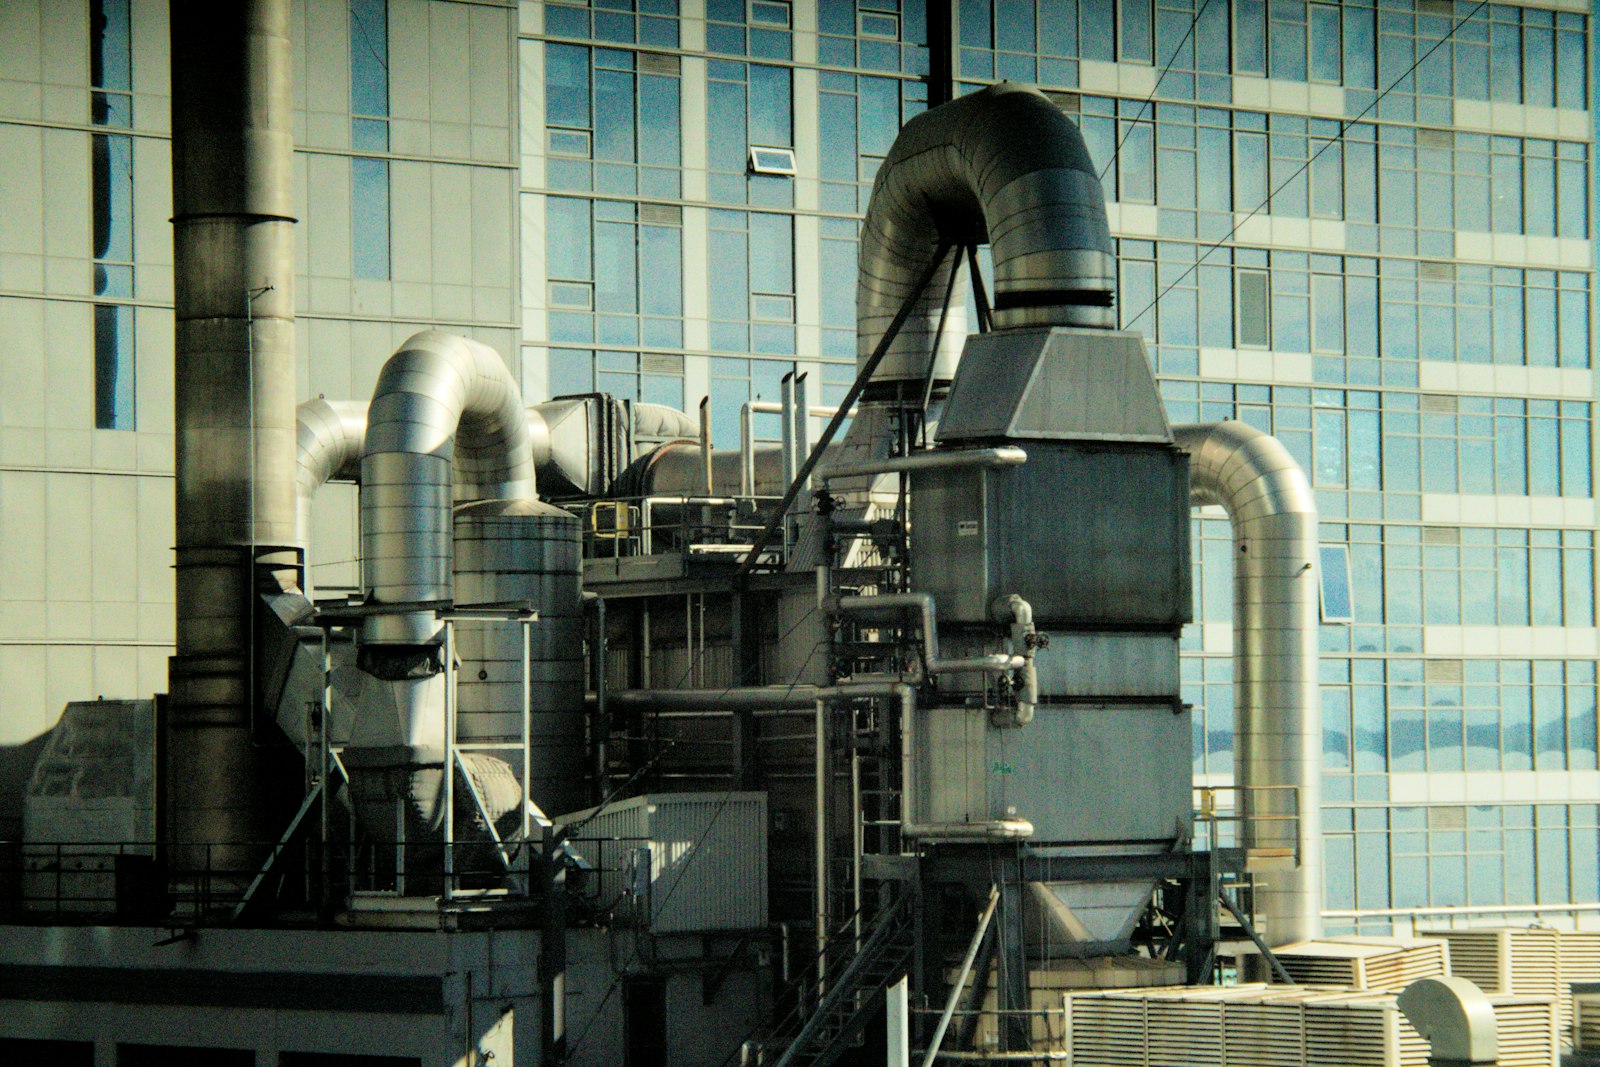 Dairy and food processing
Utility intelligence at a major dairy operation: water, electricity and refrigeration
 FMCG and food manufacturing
Water and energy intelligence for a 300-acre FMCG manufacturing campus
sites in 21 countries run on Aqueduct.
and 9 clinics in one of India’s top hospital chains.
US airport running water intelligence on Aqueduct.
of commercial real estate under Aqueduct.
FMCG manufacturing campus.
operations run on Aqueduct.

Common questions
Aqueduct runs a real time water intelligence layer across 275+ Amazon sites and is live at a top 25 US airport. Milvian AI is also engaged with one of India's top hospital chains, a commercial real estate developer with 20M+ sq ft under Aqueduct, a major dairy operation and a 300-acre FMCG manufacturing campus.
Both, and each page says which. The Amazon and airport pages describe live deployments. The hospital, real estate, dairy and FMCG pages describe engagements where the scope, design and expected outcomes are set out, with results to be measured against the customer's own bills.
Some customers ask Milvian AI not to publish their names. Those pages describe the organization by sector and scale instead, and every figure on them comes from the engagement documents.
Savings depend on each site's baseline, tariffs and operating changes, so Aqueduct case studies report scope, coverage and what was measured. Savings ranges customers see across the platform are covered on the outcome pages for water, energy and air.
Most start with a site survey and 6 to 12 months of utility bills for a day-one baseline. Aqueduct then connects existing meters and building systems, adds sensing only where the site is blind, and builds the digital twin and portfolio views on aQ Core.
See Aqueduct on your own facility.
Bring a site, a utility bill or a question. We will show you where the loss is.