Facility and water intelligence for government: counties, cities, utilities and school districts.
Aqueduct gives public agencies one platform to measure energy, water and air across their buildings and networks, act on the waste it finds, and verify each saving at the meter. Counties, cities, water and sewer utilities and school districts use the same loop to cut loss and to show councils, boards and auditors measured evidence.
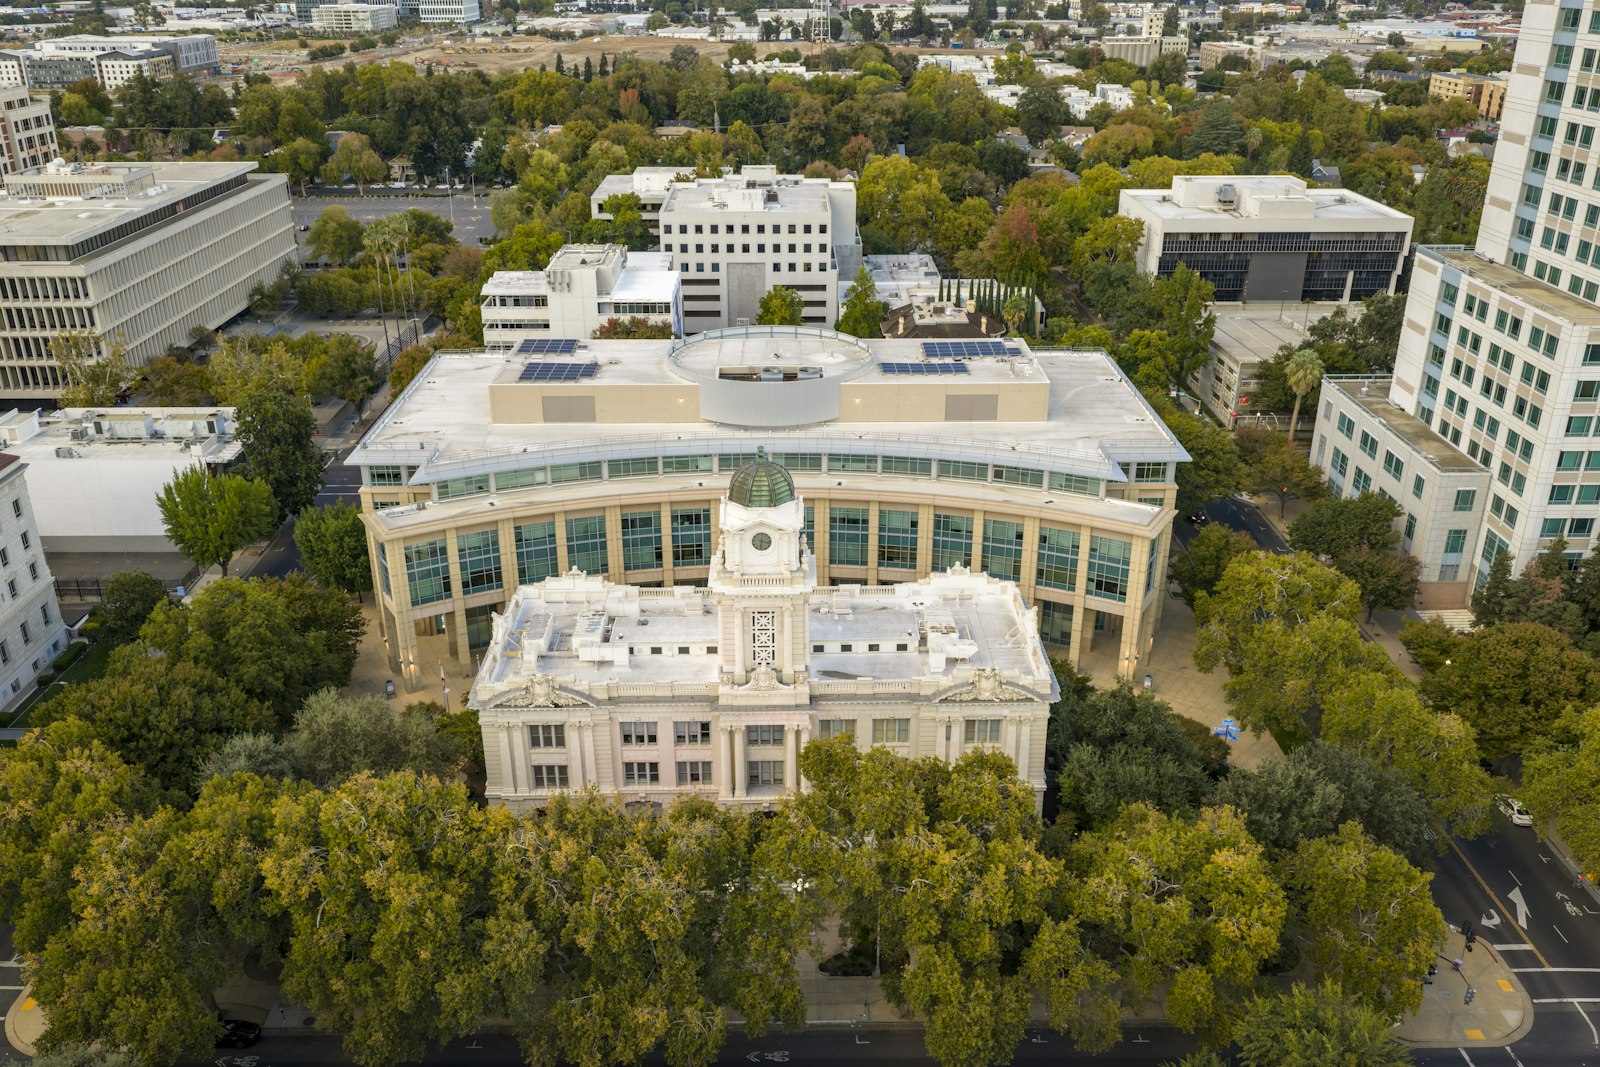

One loop for counties, cities, utilities and school districts: measure, act, verify.
Courthouses, schools and offices measured against their baselines
- Weather-normalized baselines
Every building is baselined against weather, from meter data or 6 to 12 months of bills.
- Faults routed
Faults arrive diagnosed with the fix, routed into the CMMS your crews already use.
- Savings verified
Savings are verified at the meter and stated in money, ready for council, board or auditor.
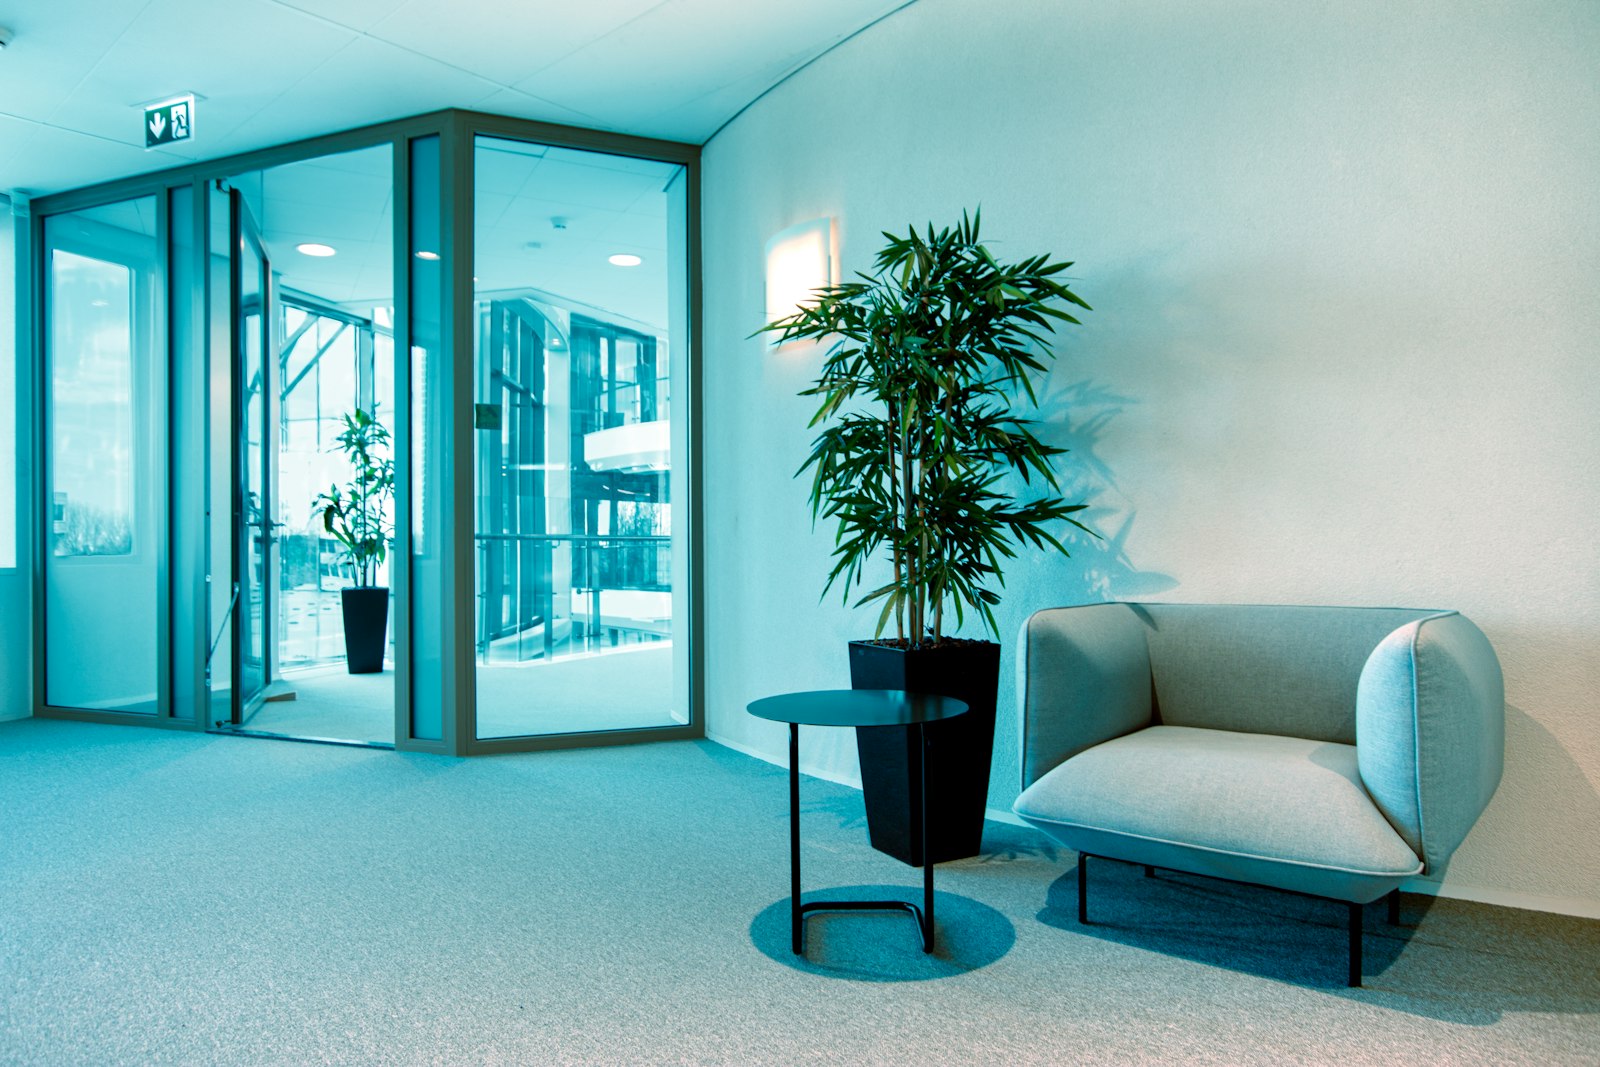
Water loss localized by district, alongside SCADA and AMI
- District balances
Supply is reconciled against metered and billed use per district, so loss has an address.
- Control stays with SCADA
Aqueduct reads SCADA and AMI data and routes work, while control stays with SCADA.
- Audit volumes, live
Volumes the AWWA M36 water audit needs are measured all year, not rebuilt at deadline.
Data residency and evidence that public owners need
- Cloud or on-prem
Run in the cloud or on-prem, with on-prem AI on NVIDIA infrastructure where data must stay home.
- Every command audited
Where control is enabled, with owner approval, every command is logged with who approved it and when.
- Metrics for reports
Verified monthly metrics support benchmarking, funding reports and audits, while your team does the filing.

Running a public estate, before and after Aqueduct
- Each department runs its own system, and none of them agree.
- Water loss is a single number in the annual audit.
- Benchmarking is rebuilt from bills every reporting season.
- Savings reported to the council are engineering estimates.
- Cloud tools fail the data residency review.
 The Aqueduct way
- Buildings and networks share one platform and one data layer.
- Water loss is localized by district and section of main.
- Benchmarking rests on baselines kept current all year.
- Savings reported to the council are verified at the meter.
- On-prem deployment keeps public data on site.
Who this is for in the public sector.
Four public owners, one platform. Pick the page that matches the estate you run.
Counties
Courthouses, jails, offices and depots, plus county water systems. Forty buildings covered by a small team.
Learn moreCities and towns
City halls, libraries, pools and pumping stations, and the water network that feeds them.
Learn moreWater and sewer utilities
Non-revenue water by district metered area, alongside the SCADA and AMI you already run.
Learn moreSchool districts
K-12 energy across every campus, and classroom air held to target while students are in the room.
Learn moreGuides for public buyers.
Plain-language guides to the audits, rules, funding programs and buying routes public owners ask about.
Water loss audit guide
What the AWWA M36 audit needs, which volumes are measured, and how a live water balance feeds it.
Learn moreBenchmarking and performance standards
One row per rule family: who it applies to, what it asks for, and the measured data Aqueduct supplies.
Learn moreFunding and grants
How a measured baseline and verified results support applications. No funding advice.
Learn moreHow to buy
Procurement routes, pilot scope, data residency, on-prem deployment and security questions.
Learn moreWhat public owners are up against.
Public estates are old, spread out and run by small teams. The bill arrives long after the waste.
One meter, many buildings
Most public sites have a single utility meter at the inlet. When use doubles overnight, nobody knows until the bill arrives.
Water that never reaches a bill
Leaks on mains and service lines, and meters that under-read, show up only in an annual audit, months after the loss.
Small teams, large estates
A facilities crew of a few people answers for dozens of buildings, many with aging controls and deferred maintenance.
Every number gets questioned
Councils, boards, auditors and grant programs ask for measured results, not estimates gathered at the deadline.
Problem, solution, impact.
Four outcomes with equal weight, on one data layer.
Loss in buildings and networks is found by the bill or the annual audit.
Live water balance per building and baseline per district metered area. Unaccounted flow flagged as it starts. Powered by aQ WaterGuard.
Loss found in days, not at audit time. Fix verified at the meter.
After-hours loads and drifting plant run unseen across the estate.
Weather-normalized baseline per building from 6 to 12 months of bills, then load compared with that baseline every day. Powered by aQ EnergySmart.
Waste shown in dollars per building. Savings measured, not estimated.
Classrooms and public offices get spot checks, not continuous records.
CO2, temperature and humidity per zone, overlaid with occupancy. Powered by aQ AirSafe.
Spaces held to target while people are in them, without over-ventilating empty rooms.
Faults wait for a complaint. Deferred maintenance is prioritized by guesswork.
Faults diagnosed in plain language and routed to your CMMS with a recommended fix.
Verified closures, and a ranked list of the assets that cost the most to leave alone.

Public owners should be able to show the measured result of every dollar spent.
Talk to our teamHow Aqueduct works for a public estate.
Every use case runs the same loop: Monitor, Measure, Identify, Act, Verify. Every verified result becomes the new baseline.
Monitor
Connect the meters, sensors, BMS points and SCADA and AMI data you already have. Add metering where the gaps are, installed through partners.
Measure
Build a weather-normalized baseline per building and per district, using cooling and heating degree days. Upload 6 to 12 months of utility bills for results on day one.
Identify
Flag leaks, after-hours loads, faults and early signs of failure, with the likely cause in plain language.
Act
Route a ticket into your CMMS with a recommended fix. Where control is enabled and the owner approves, adjust setpoints and schedules.
Verify
Confirm at the meter that the loss stopped or the load dropped. Keep the record for council, board, audit or grant reporting.
The questions each public seat asks.
“Does it work across my network, alongside my SCADA and meters?”
Yes. Aqueduct reads SCADA, AMI and historian data and adds building meters. Control of the network stays with SCADA.
“Can it cover forty buildings with a small team?”
One portfolio view ranks every building against its own baseline, so the crew starts with the site that is losing the most.
“Can I show council a verified saving?”
Each saving is measured against a baseline modeled before the work and confirmed at the meter, with the record kept.
“How do we buy it, and where does the data live?”
Start with a scoped pilot. Aqueduct runs in the cloud or on-prem, with on-prem AI on NVIDIA infrastructure.
What Aqueduct replaces, and what it works alongside.
- BMS and BAS in public buildings
- Energy management (EMS, BEMS)
- Water management and water loss analytics
- Indoor air quality monitoring
- FDD
- M&V
- SCADA (control stays with SCADA)
- AMI
- Historians
- CMMS and EAM
- IWMS and CAFM
- ENERGY STAR Portfolio Manager exports
Replace what should be replaced, connect the rest. We supply the metrics; your team completes and files audits and reports. Installation is delivered through partners.
Rules and programs public owners ask about.
Each links to its glossary entry, with what Aqueduct supplies for it.
Where teams put it to work
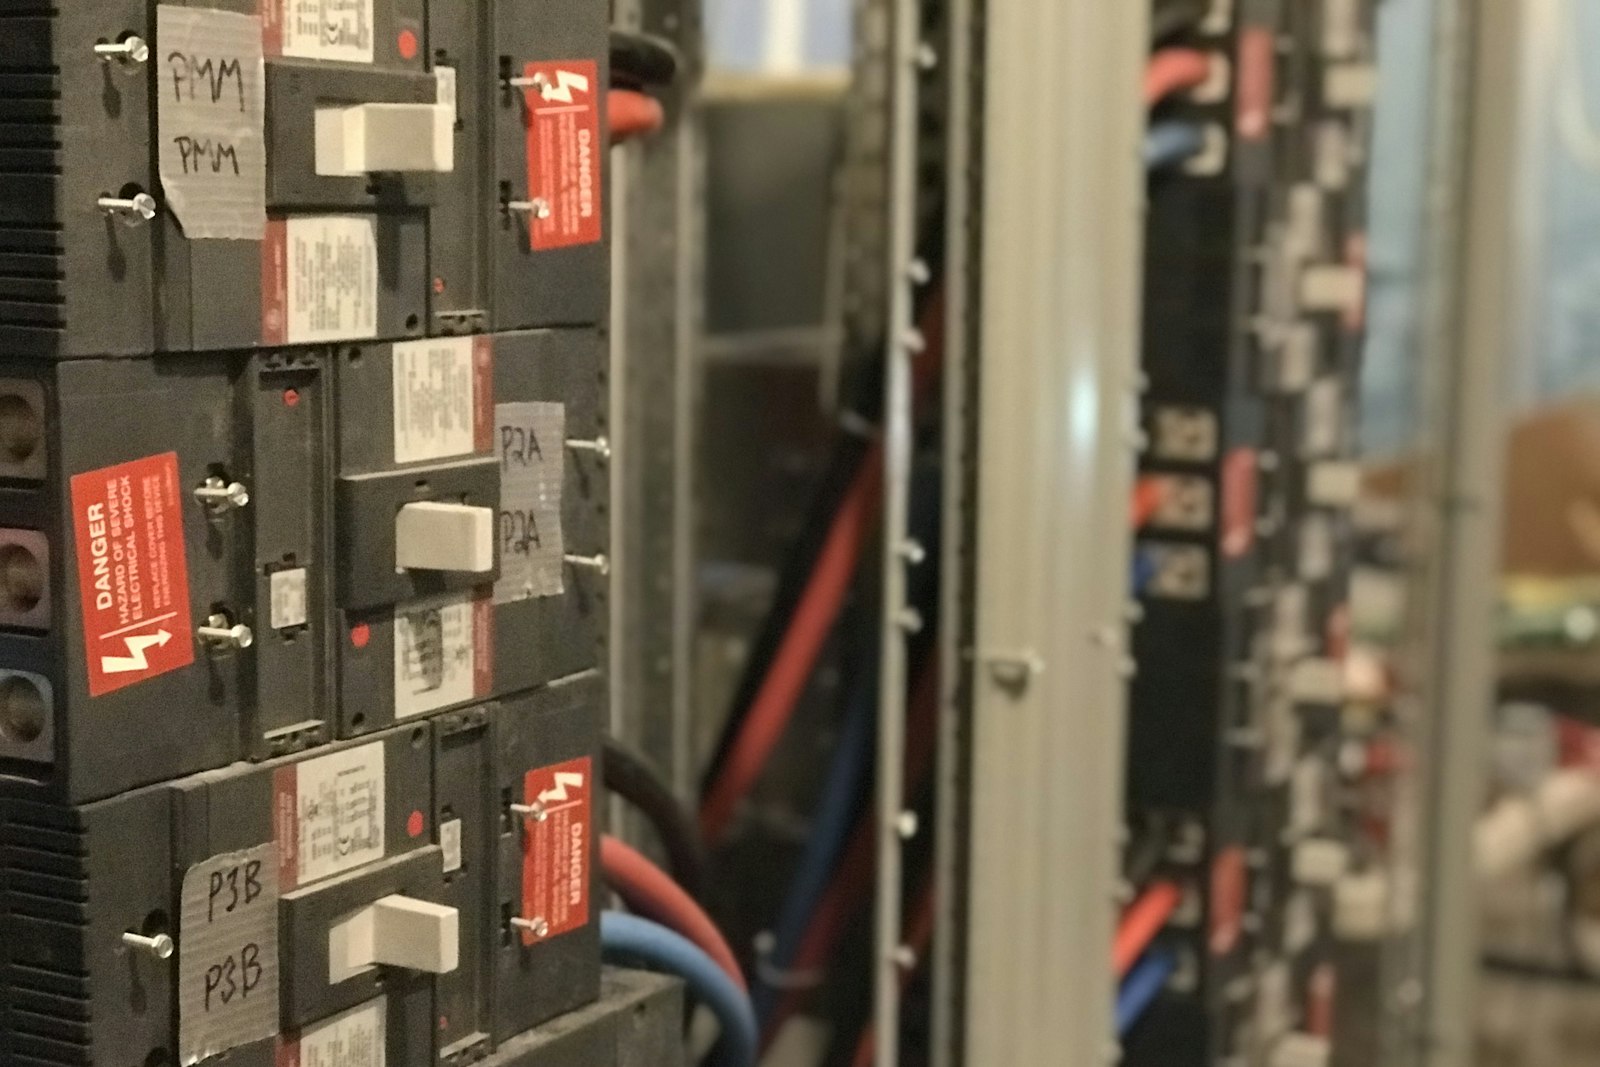
A whole county estate, one team
Courthouses, jails, offices and depots baselined and ranked by waste, with faults routed and savings verified at the meter.
Learn more
Water loss and buildings together
District water loss and public building energy on one platform, alongside the SCADA and AMI the city already runs.
Learn more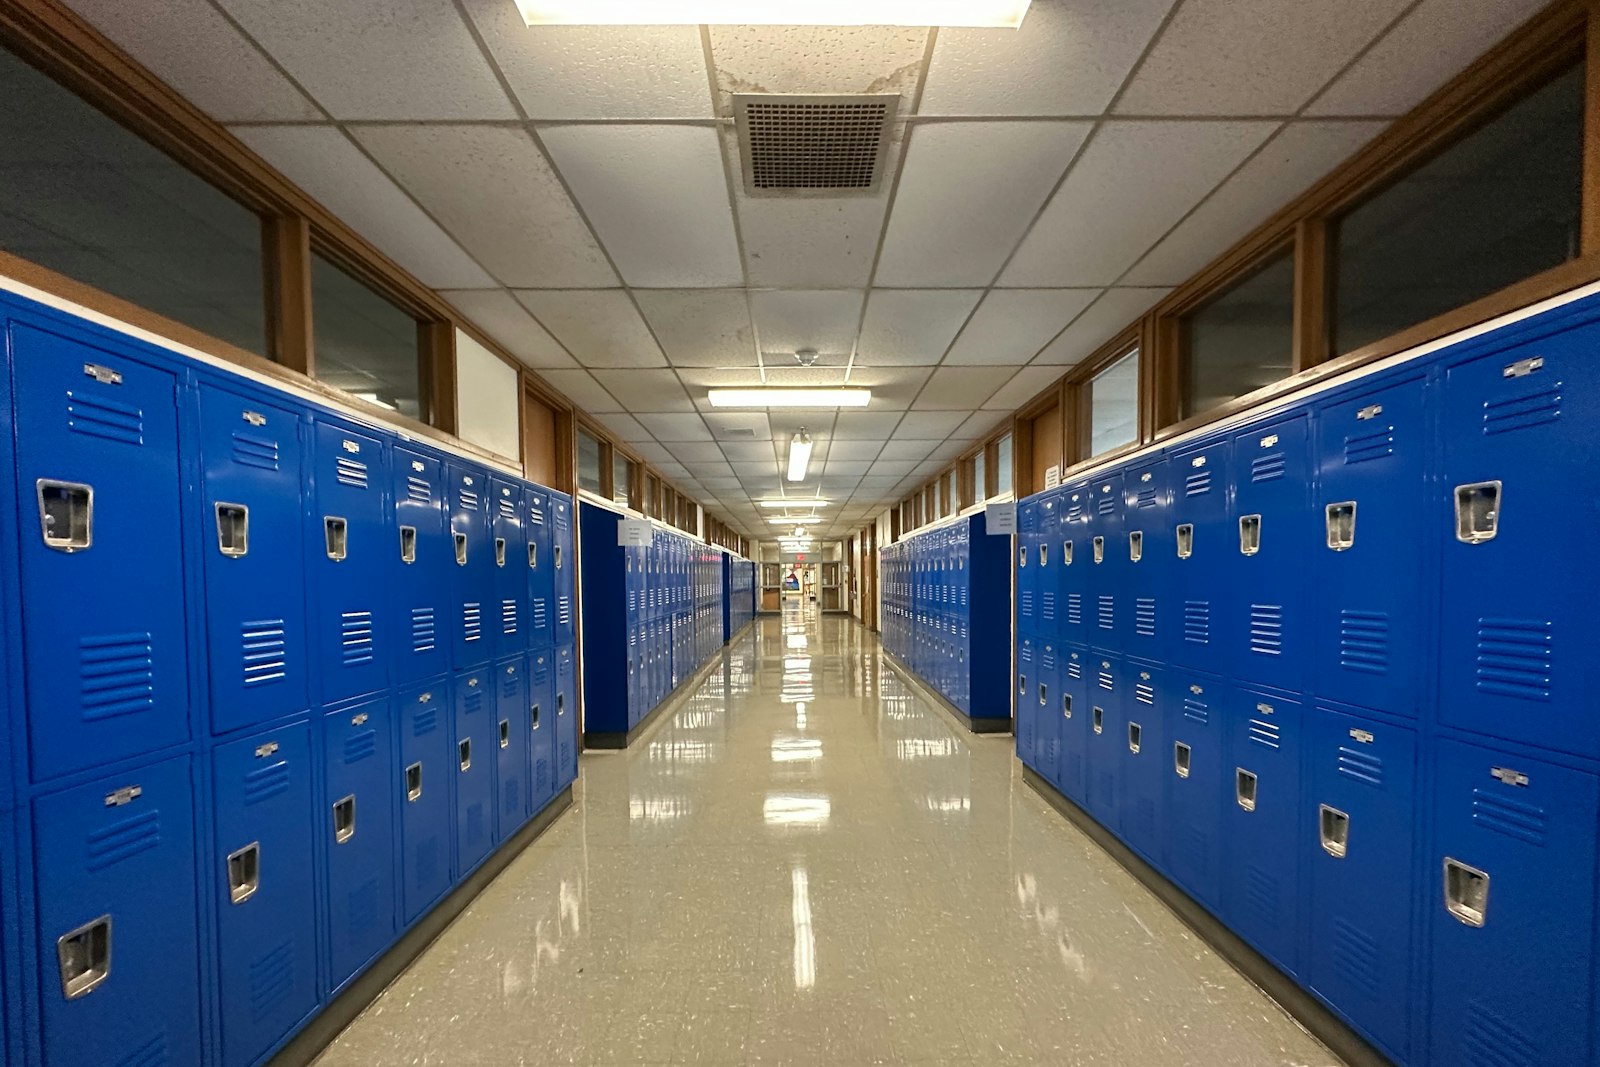
Classroom air and campus energy
Classroom CO2 against occupancy and campus energy against the calendar, so air holds while students are in and load drops when out.
Learn moreIn depth for county facilities and water
Detailed guides for the county buildings and systems that cost the most to run.
Jails and detention centers
Water, kitchens, laundry and HVAC in facilities that never close.
Learn moreCourthouses and civic buildings
Schedules, comfort and benchmarking for courthouses, offices and libraries.
Learn moreCounty public works and water
District night flow, pump stations and AWWA M36 audit data alongside SCADA.
Learn morePublic sector starting points
Most agencies start where the waste is largest and the data is easiest to reach.
| Agency | Usual first step | Guide |
|---|---|---|
| County | Water per housing unit in the jail, and after-hours load in the courthouse | Counties |
| City or town | City hall, pools and pumping stations on one baseline each | Cities and towns |
| Water or sewer utility | Night flow per district metered area, read alongside SCADA | Water utilities |
| School district | Campus energy baselines and classroom air while students are in | School districts |
Related
Common questions
Aqueduct is facilities and infrastructure intelligence for any operator. Public owners use it for the same reason: one platform across buildings and water networks that acts on waste and verifies the result at the meter.
Yes. Aqueduct runs in the cloud or on-prem, with on-prem AI on NVIDIA infrastructure, for agencies that cannot send data out.
No. Aqueduct works alongside your SCADA and reads its data; control stays with SCADA. It integrates with your CMMS, sending tickets in and reading verified closure back.
No. Aqueduct supplies the measured volumes and verified results. Your team completes and files audits, benchmarking reports and grant reporting.
With a site survey of one facility or one district. Bring 12 months of bills or a meter list, and see the baseline before any wider commitment.
See Aqueduct on your own facility.
Bring a site, a utility bill or a question. We will show you where the loss is.