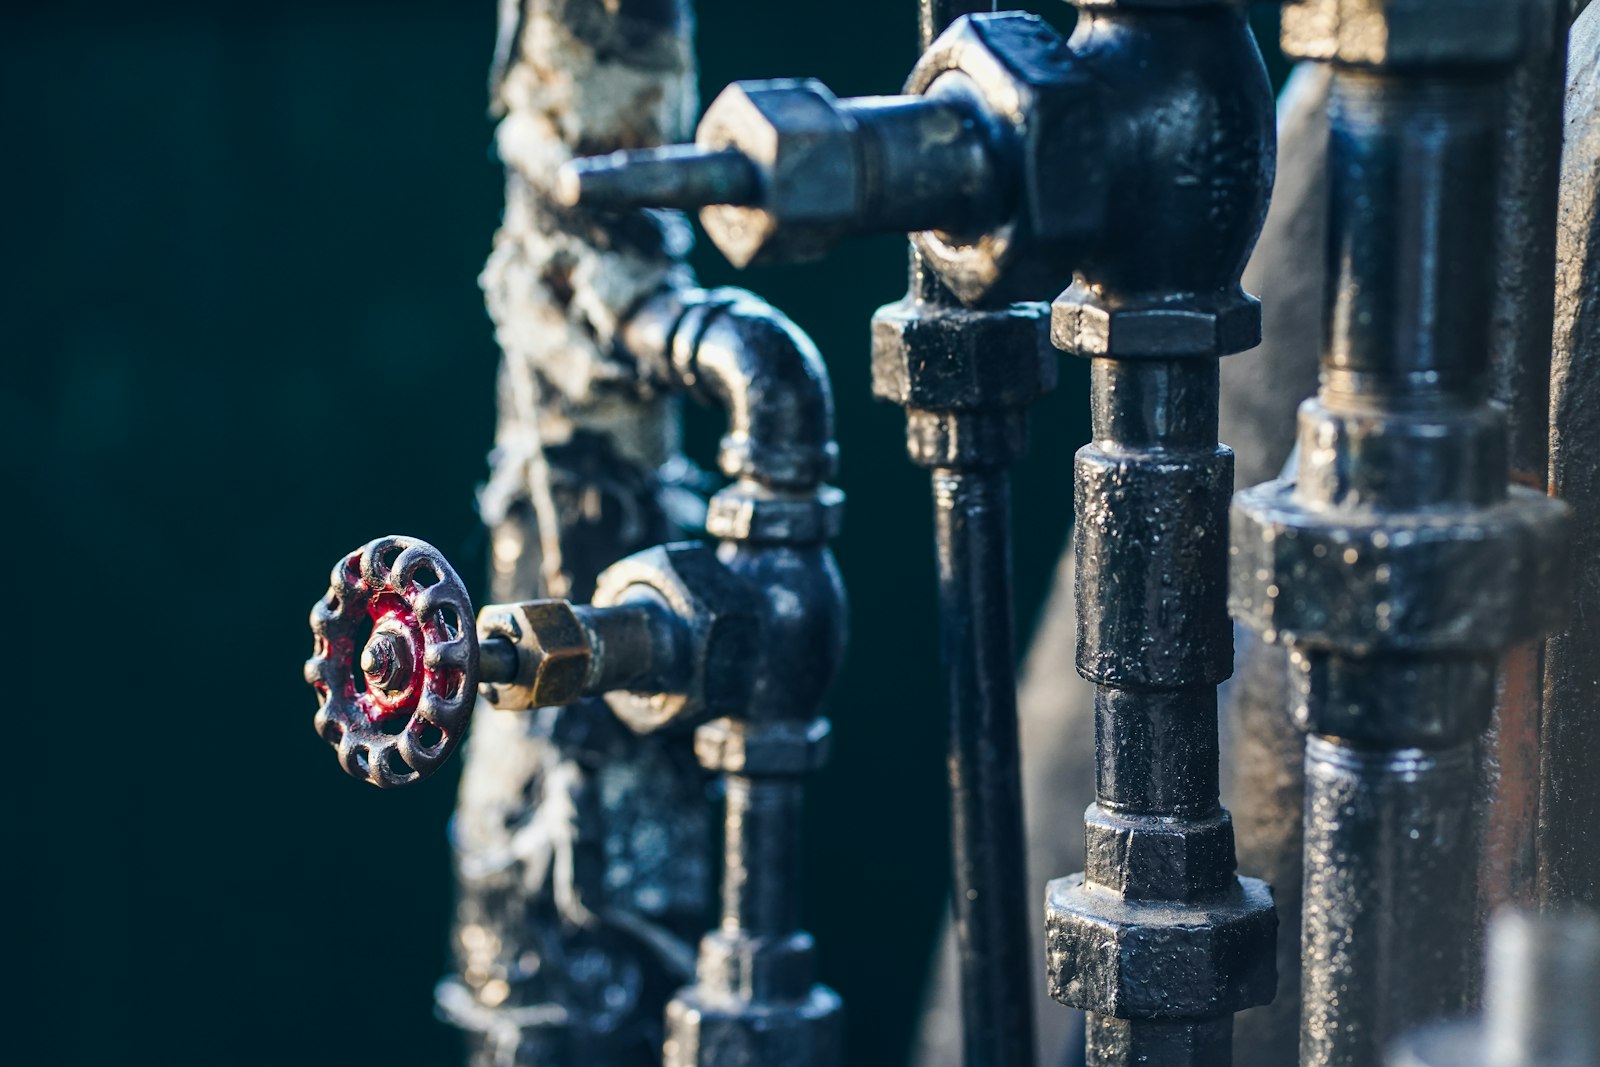
Process water balance, ZLD monitoring and power quality for manufacturing plants
A process water balance accounts for every litre a plant draws, uses, reuses and discharges, so supply equals use plus loss. Aqueduct runs that balance live from source to ZLD, tracks RO recovery, evaporator and reuse loops, and applies the same lens to electricity: power factor, maximum demand and feeder losses, so penalties and losses are found before the bill arrives.
Every litre from source to discharge, and every kVA from incomer to load, on one balance.
Sources, uses, reuse and discharge reconciled every interval
- Source to discharge
Borewell, municipal and tanker supply reconcile against process, cooling, boiler and domestic use on one twin.
- Unaccounted loss
Water that reconciles to no metered use is tracked as loss, priced and narrowed to a header or line.
- Cooling tower cycles
Make-up and blowdown metering shows cycles of concentration, so blowdown follows water quality.
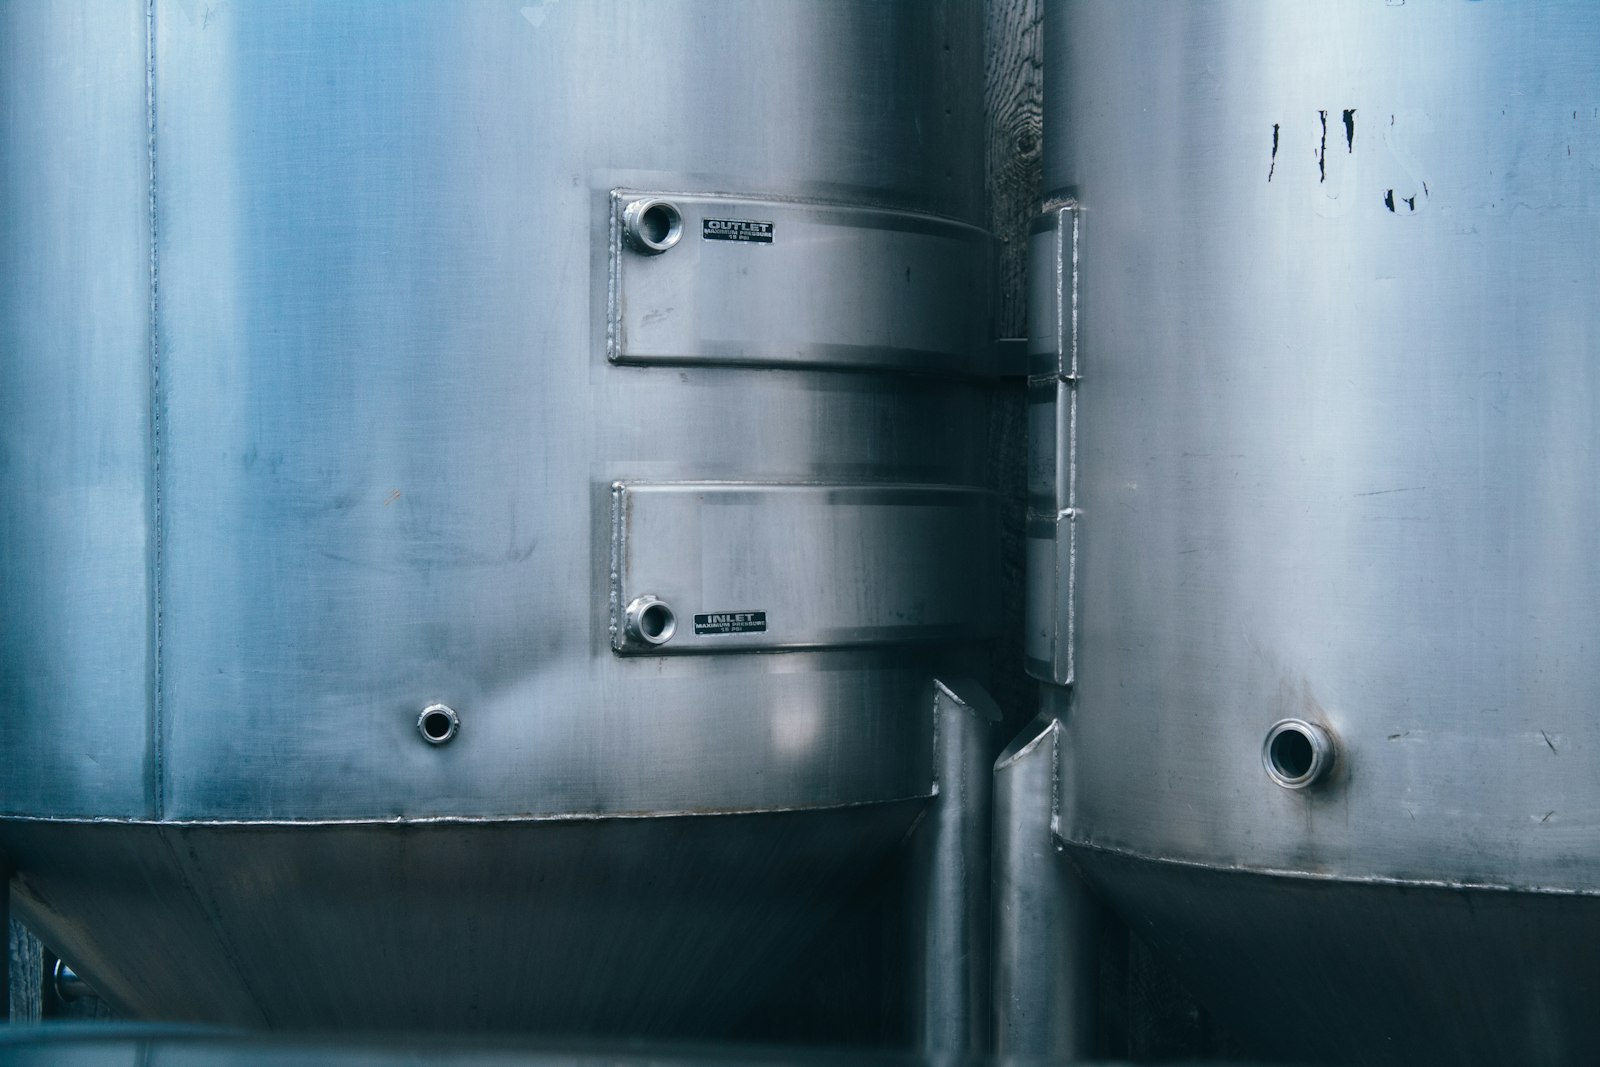
RO, evaporator and reuse loops measured stage by stage
- RO recovery
Feed, permeate, reject and TDS show recovery for each unit, and fouling shows as a trend.
- Treatment efficiency
ETP and STP inlet and treated flow give a running view of treatment performance.
- ZLD evidence
Reuse and evaporation are metered into the balance, so performance is shown from data.
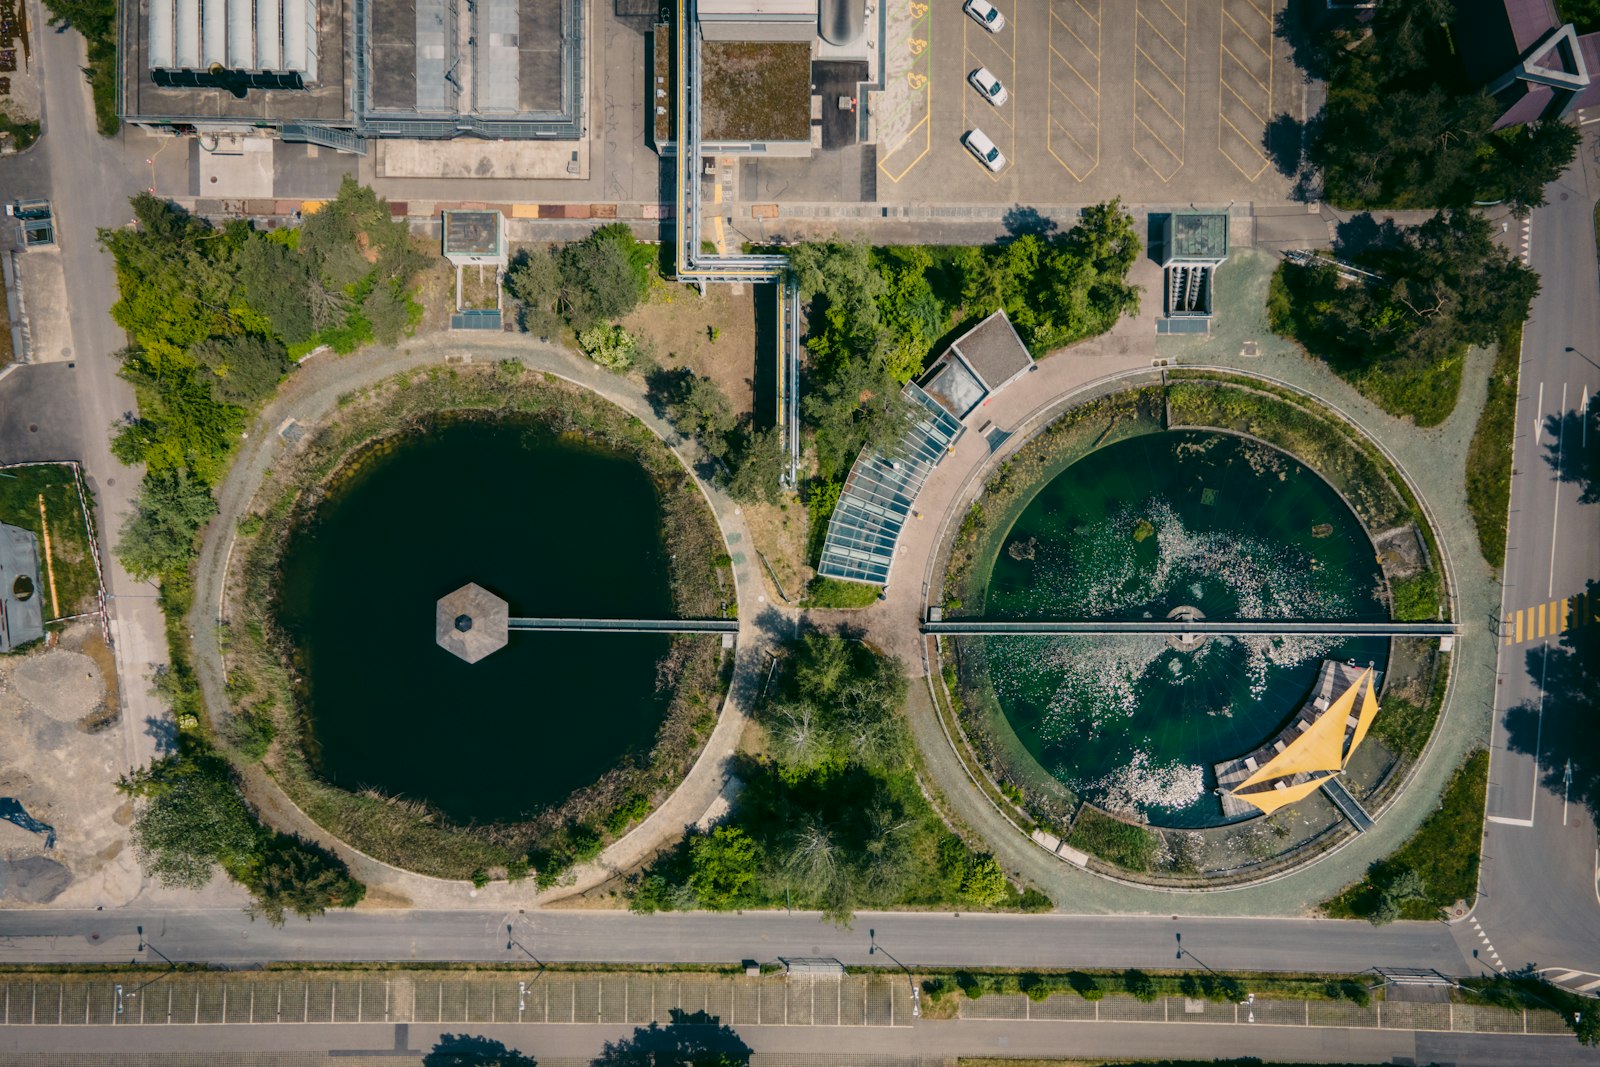
Power factor, demand and losses seen before the bill
- Power factor per feeder
PF is tracked per feeder with the power triangle, so falling correction is caught early.
- Peaks explained
Each demand peak is shown with the loads behind it, ready for sequencing decisions.
- Losses estimated
Transformer and distribution losses are estimated end to end, so nothing leaks unseen.
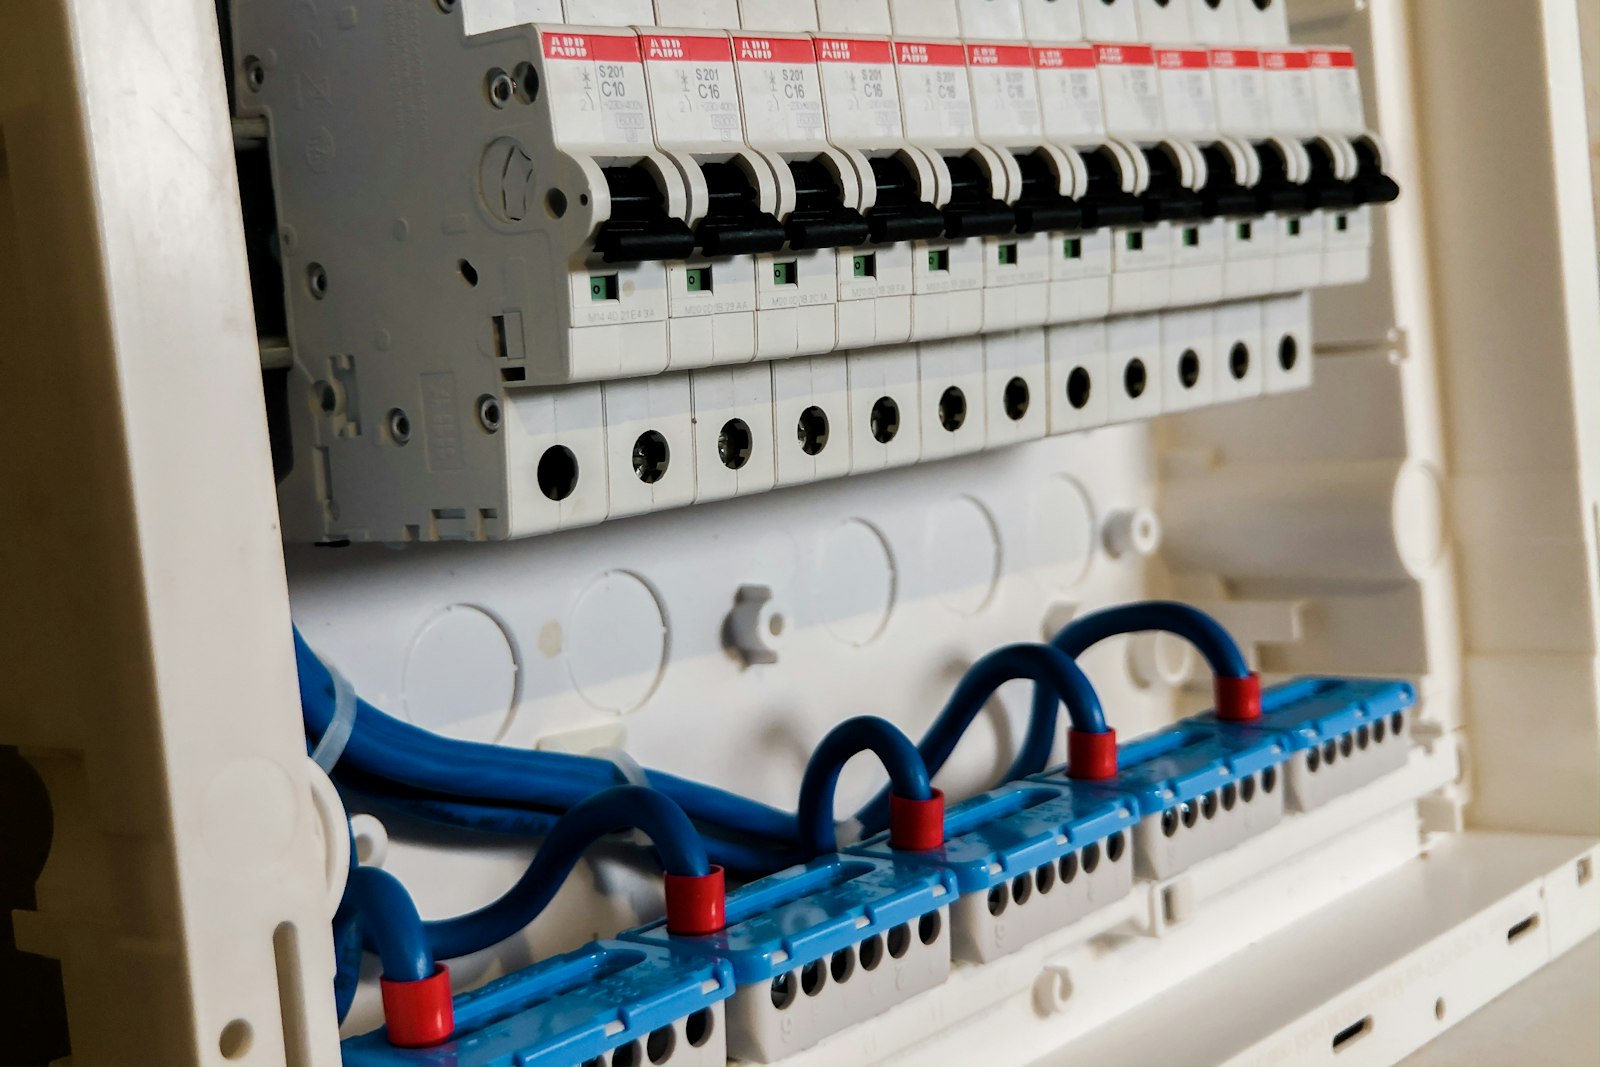
Plant utilities, before and after Aqueduct
- Water totals are known, but losses between meters are not.
- ZLD performance is claimed from design, not shown from data.
- RO fouling is found when reject volume overwhelms the evaporator.
- A power factor penalty is discovered on the bill.
- Demand peaks happen and nobody knows which loads caused them.
 The Aqueduct way
- Unaccounted loss is tracked live on the water balance.
- Every reuse and evaporation stage is metered into the balance.
- RO recovery is tracked continuously and drift is flagged early.
- Power factor per feeder is flagged before the period closes.
- Each peak is shown with the loads that caused it.
How the process water balance is built
Block by block, to match the plant you actually run.
Sources
Borewell, municipal, tanker and recycled water are metered at entry, with tank levels where they buffer supply.
Treatment
Softeners, RO units and filters are measured for feed, permeate, reject and recovery.
Uses
Process lines, CIP, cooling tower make-up, boiler feed, domestic use and fire are metered or allocated.
Treatment and reuse
ETP, STP, RO reject recovery and evaporators are measured for inlet, treated output and reuse.
Balance
Sources equal uses plus reuse plus discharge plus unaccounted loss, updated every 60 seconds on the water twin.
Power factor and maximum demand, tracked per feeder
The electric digital twin applies the same balance to power: sources equal loads plus losses.
| Measure | Why it costs money | What Aqueduct does |
|---|---|---|
| Power factor | Low power factor raises apparent power, loads the infrastructure and can bring a reactive penalty on the bill | Tracks PF per feeder and flags capacitor banks or loads pulling it down |
| Maximum demand | A short peak can set the billed demand for the month or push the plant past its contract demand | Shows the loads behind each peak and recommends sequencing |
| Feeder loading | Overloaded or lightly loaded transformers and feeders waste capacity and energy | Shows loading against rated kVA, block by block |
| Distribution losses | Losses between the incomer and the loads sit in nobody's budget | Estimates transformer and system losses end to end |

Water and power both balance. The question is whether anyone is checking.
Talk to our teamWhere process water and power go unmanaged
Most plants know their totals. Few know where the water and power in between go.
ZLD that is hard to prove
The plant runs reuse and evaporation, but cannot show from measurements that nothing leaves the site.
RO recovery drifting
Membranes foul, recovery drops and reject volume rises, adding load to the evaporator downstream.
Penalties found on the bill
A low power factor or a demand peak is discovered when the utility charges for it.
Cooling towers unmeasured
Make-up and blowdown are not metered, so cycles of concentration are a guess.
Where teams put it to work
Groundwater draw measured against every use
Where groundwater is the main source, abstraction is metered and reconciled against use, so reuse and reduction are shown from measured volumes.
Learn more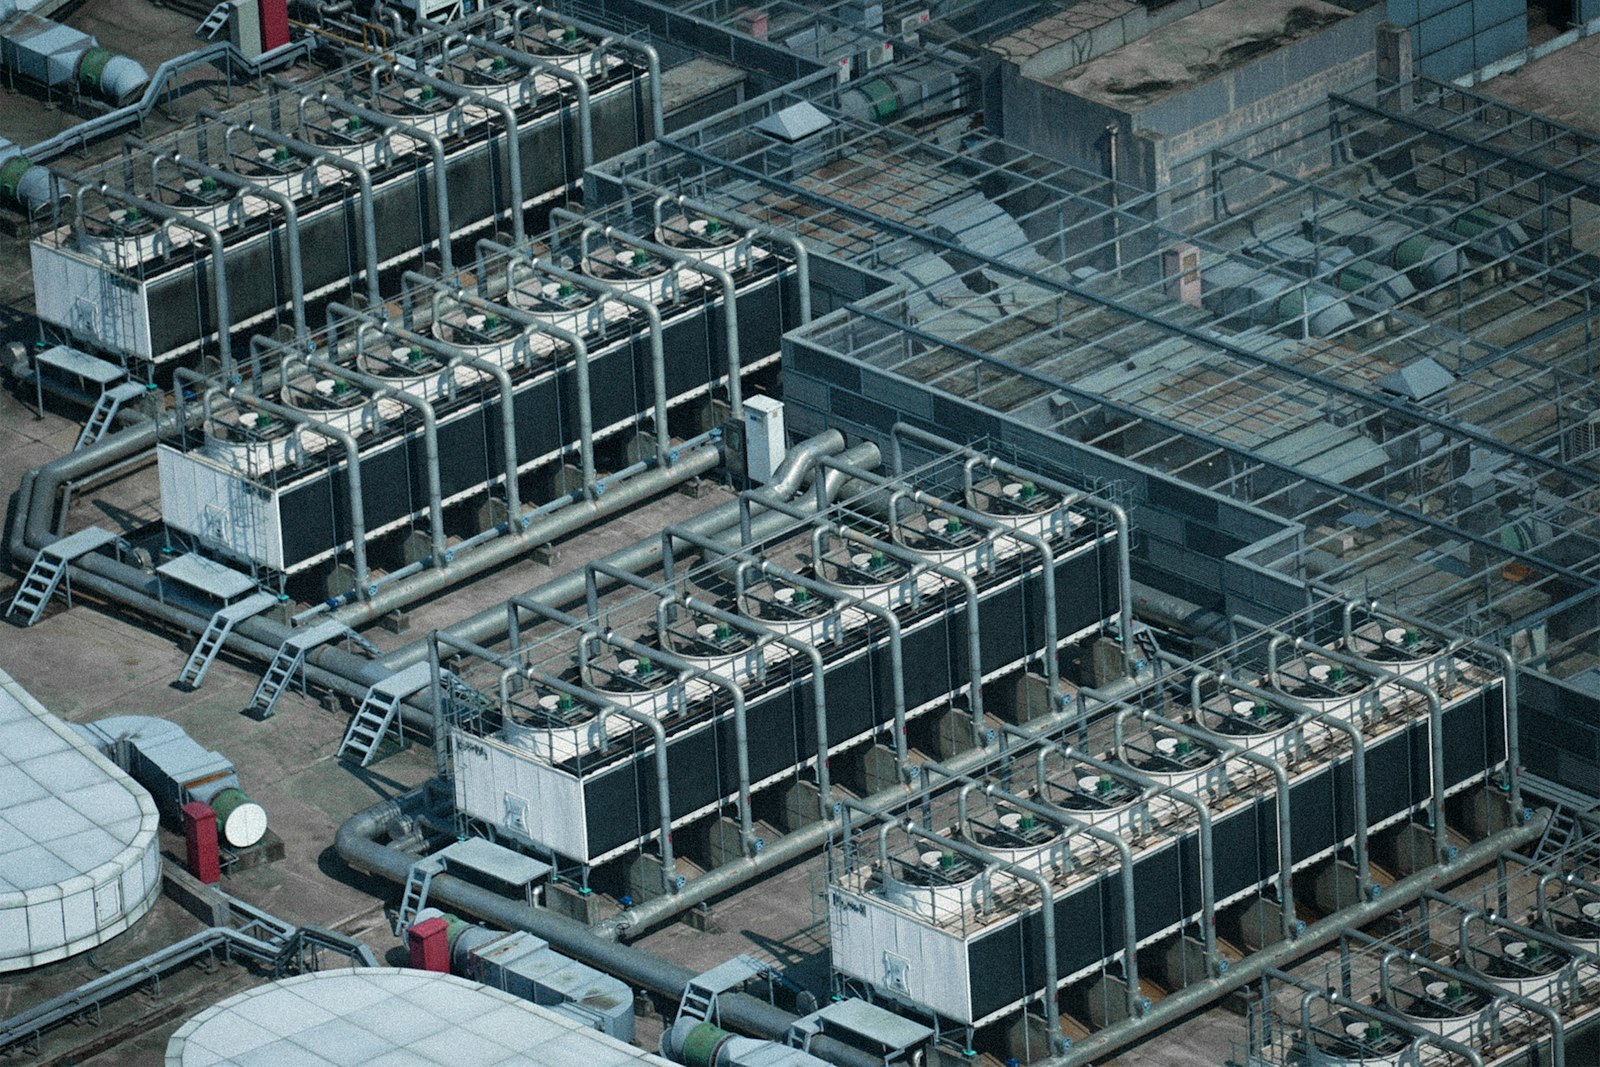
Cooling towers run on water quality
Make-up, blowdown and conductivity metering show cycles of concentration for each tower, so blowdown follows measured water chemistry instead of a fixed timer.
Learn more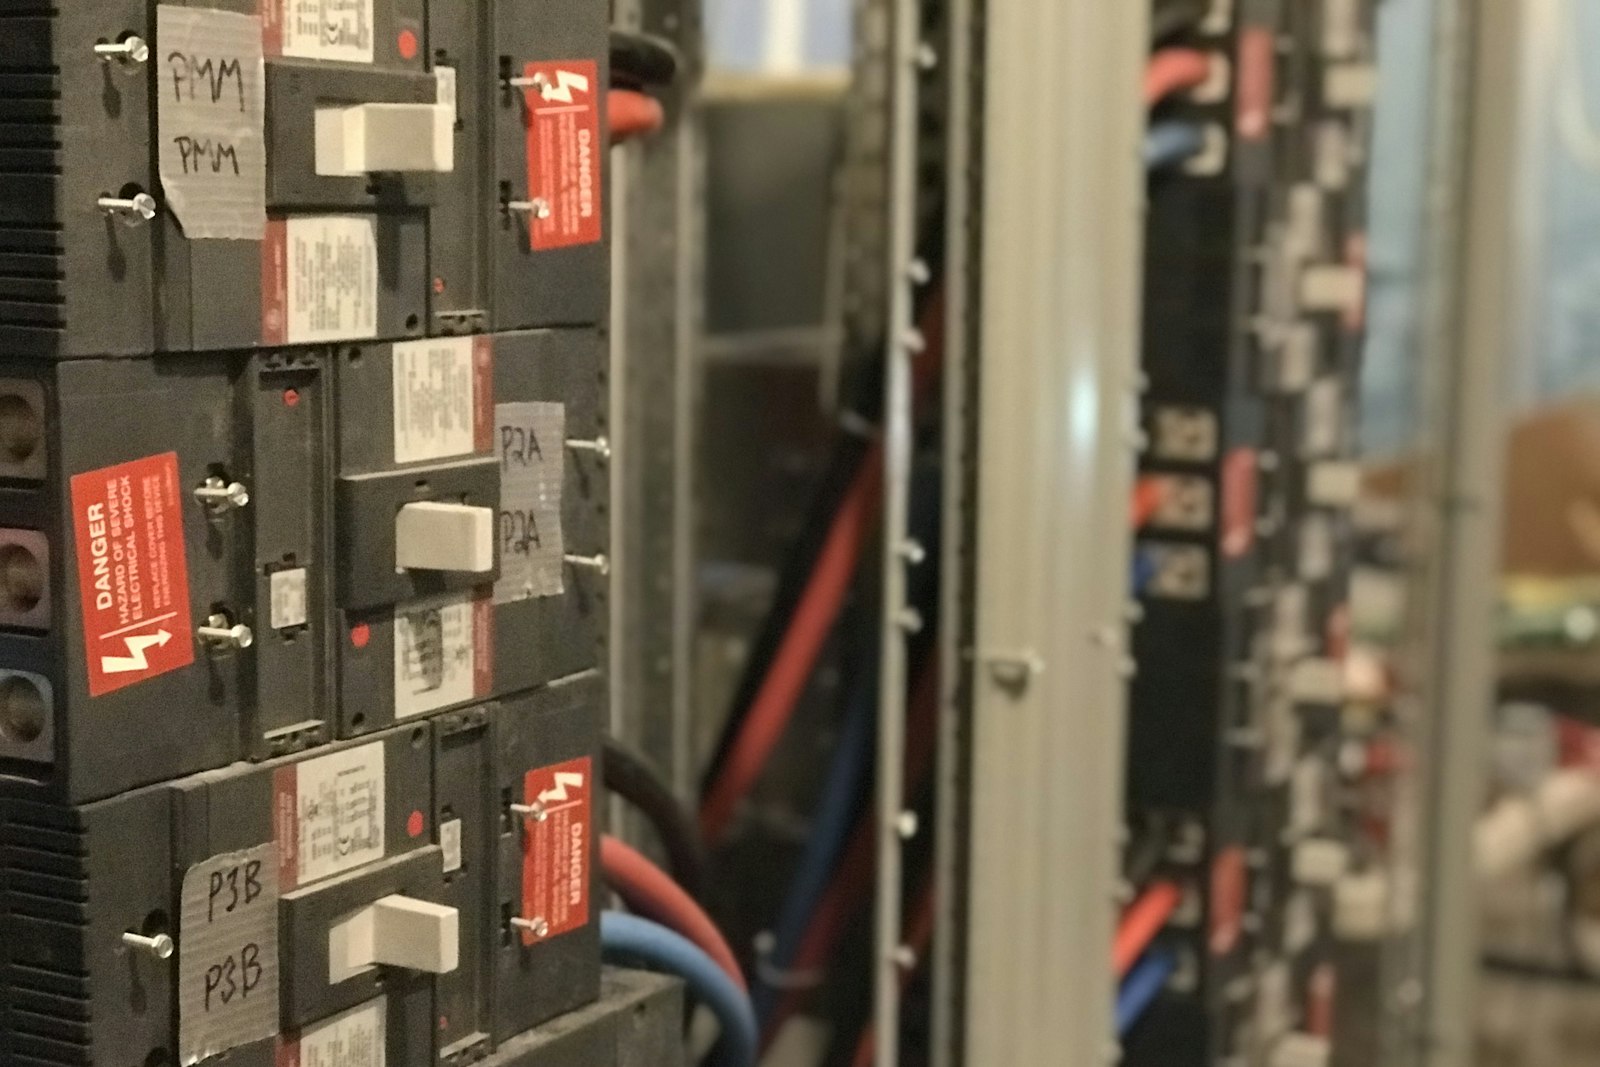
Contract demand and PF managed daily
Feeder level PF, loading and peaks give the electrical team a daily view instead of a monthly bill surprise.
Learn moreRelated
Common questions
A process water balance is an account of every source of water a plant draws against every use, reuse, discharge and loss. When metered sources do not equal metered uses, the gap is unaccounted loss. Aqueduct runs the balance live on the water digital twin, updated every 60 seconds.
Zero liquid discharge, or ZLD, is a treatment approach in which a plant recovers and reuses its wastewater so that no liquid effluent leaves the site, usually through RO and evaporation. Aqueduct measures every stage so the plant can show its ZLD performance from data.
Yes. Aqueduct reads feed, permeate and reject flow and TDS in and out for each RO unit, calculates recovery continuously and flags drift that points to membrane fouling or scaling.
Track power factor continuously per feeder, keep capacitor banks or active correction healthy and find the loads that pull power factor down. Aqueduct shows PF per feeder on the electric digital twin and flags falls before the billing period closes.
Maximum demand is the highest power drawn over a billing interval, and it often sets part of the bill. Aqueduct shows which loads coincide at each peak and recommends sequencing. Where control is enabled, with owner approval, loads can be scheduled to stay under a target.
No. Aqueduct reads existing SCADA, historians and energy meters and adds sensing only where the plant is blind. Control stays with SCADA.
Aqueduct meters groundwater abstraction alongside every other source and keeps a continuous, timestamped record. Your team or consultant uses it for CGWA and other filings.
See Aqueduct on your own facility.
Bring a site, a utility bill or a question. We will show you where the loss is.