Electricity sub-metering and power monitoring hardware for every feeder
Electricity sub-metering places meters below the main utility meter to measure each tenant, floor, feeder or major load. Aqueduct reads pulse meters, CT clamp metering, Modbus meters through LoRaWAN bridges and camera reads of existing meters, then reports kWh, demand, power factor and power quality on a live electrical single line.
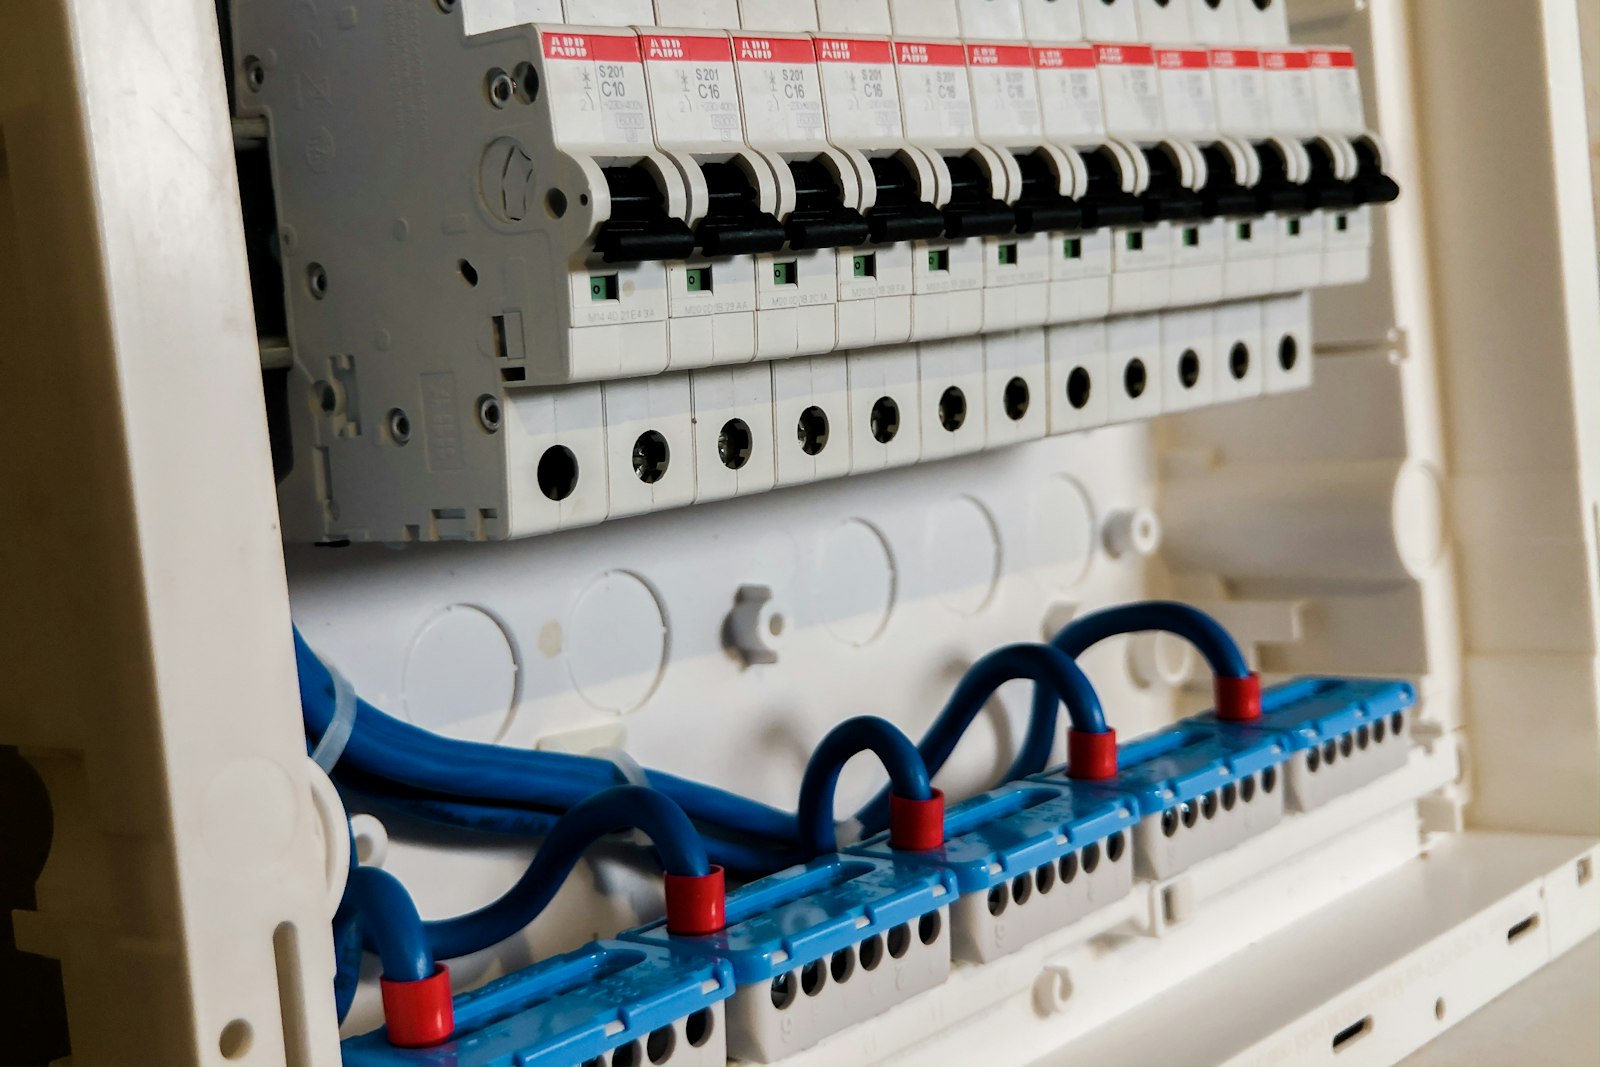
Know how much, who used it, and how well the electrical system is running.
Every feeder, floor and tenant measured below the main
- Main first
The main incomer is metered, then sub-meters explain where the total goes.
- Tenant billing
Measured use replaces square-foot allocation, so each tenant pays for the electricity they actually used.
- High use flagged
Unusual consumption on a feeder points to inefficient equipment or out-of-hours running.
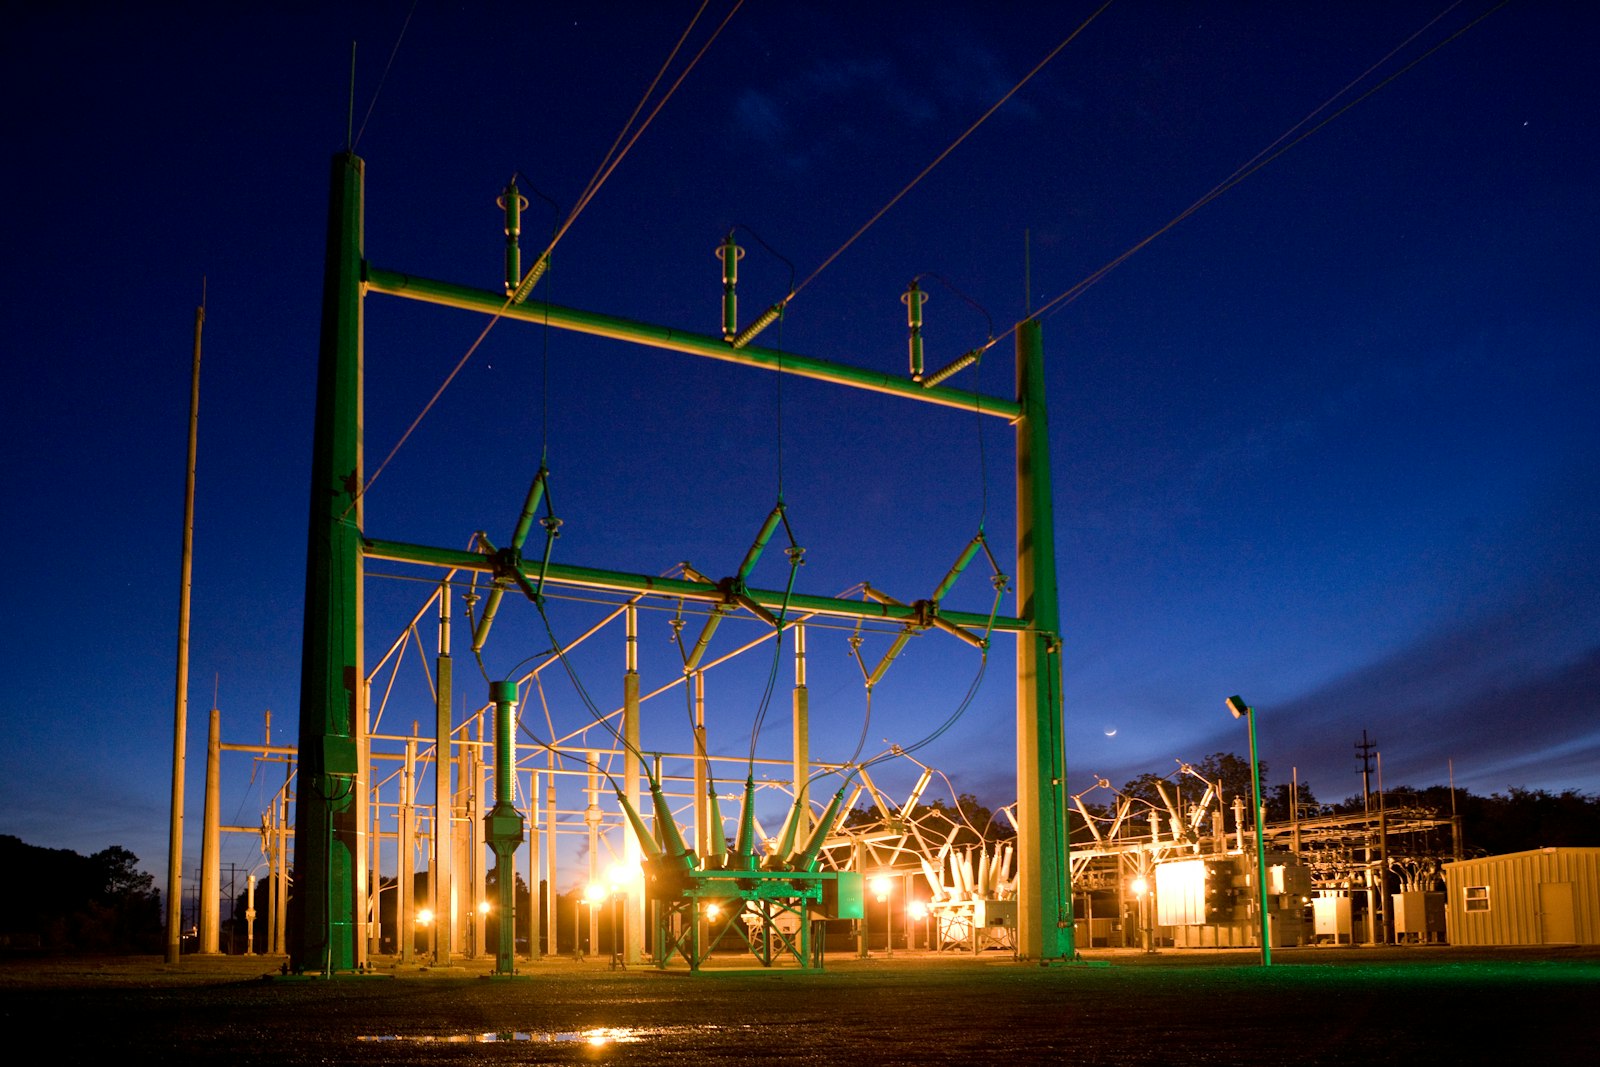
Power factor, imbalance and demand on a live single line
- Power triangle
Real, reactive and apparent power are shown together, with power factor per feeder.
- Imbalance caught
Voltage and current imbalance across phases are tracked as they develop, before they stress equipment.
- Peak demand
Demand is tracked against the peak, so load sequencing can keep it under the limit.
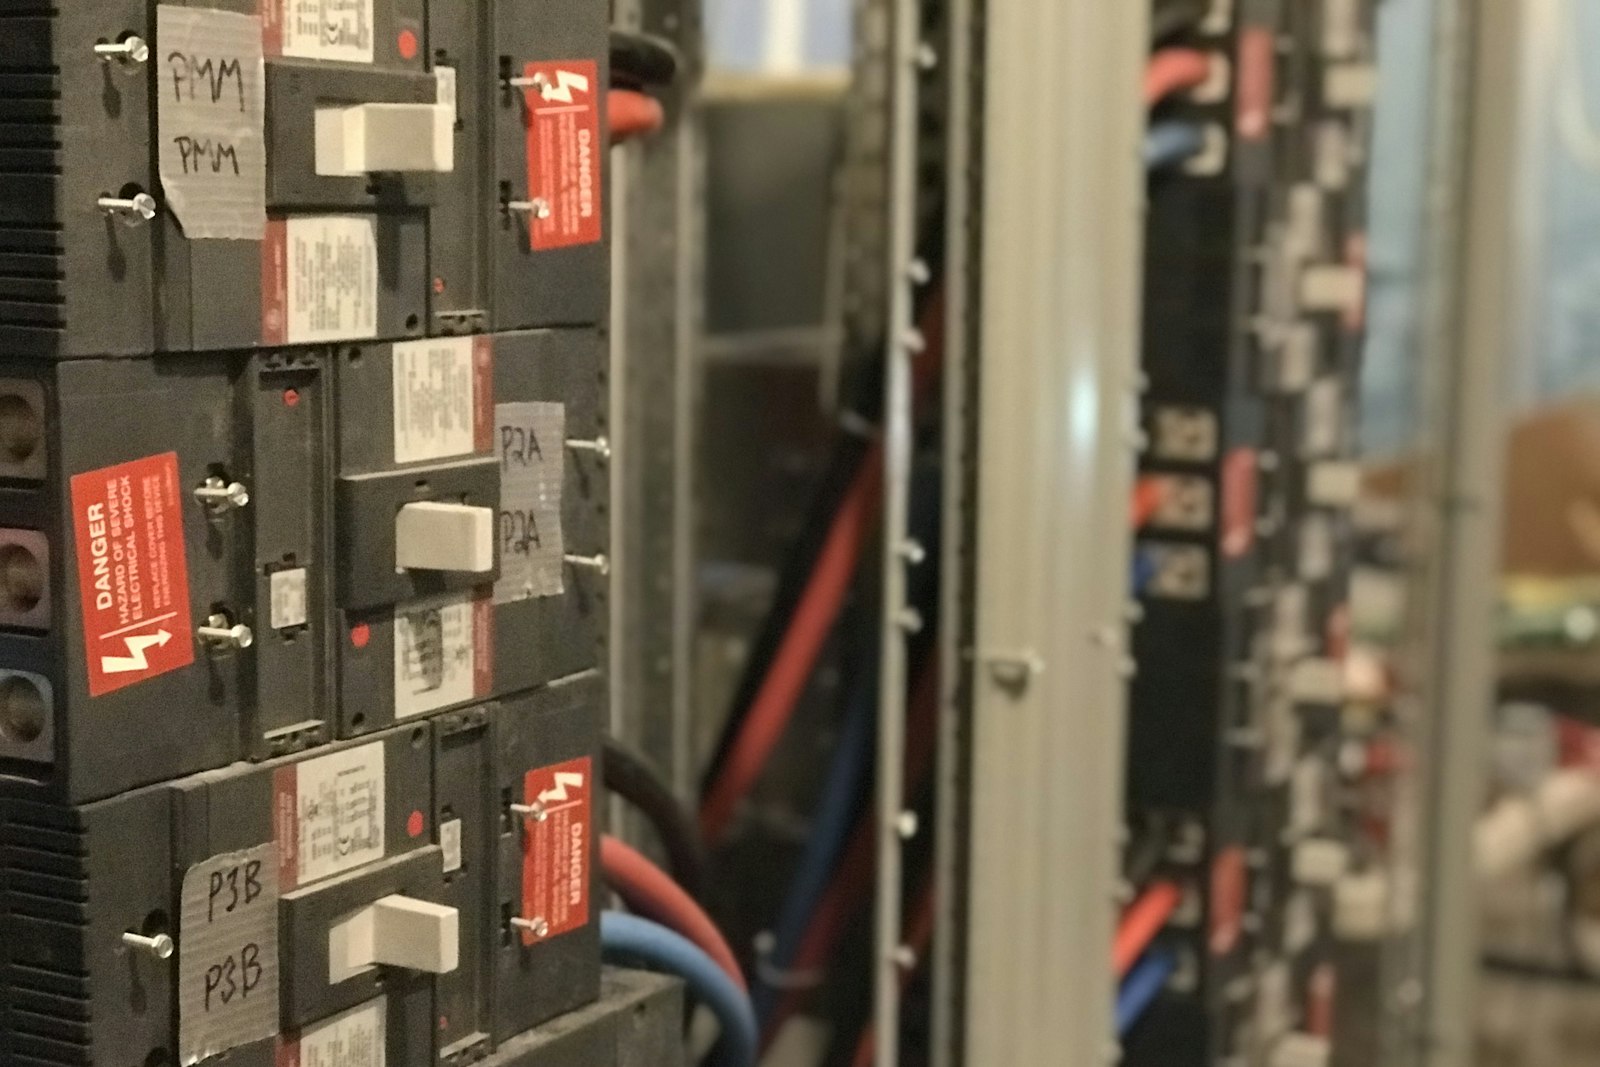
Pulse, CT clamp, Modbus or a camera on the meter face
- Pulse counters
Existing meters with a pulse output connect through a LoRaWAN pulse counter, with no meter replacement.
- Modbus bridges
Modbus meters report to the cloud through a Modbus-to-LoRaWAN bridge that sends readings securely.
- Camera reads
Meters with no output are read by camera and converted to kWh and kW.
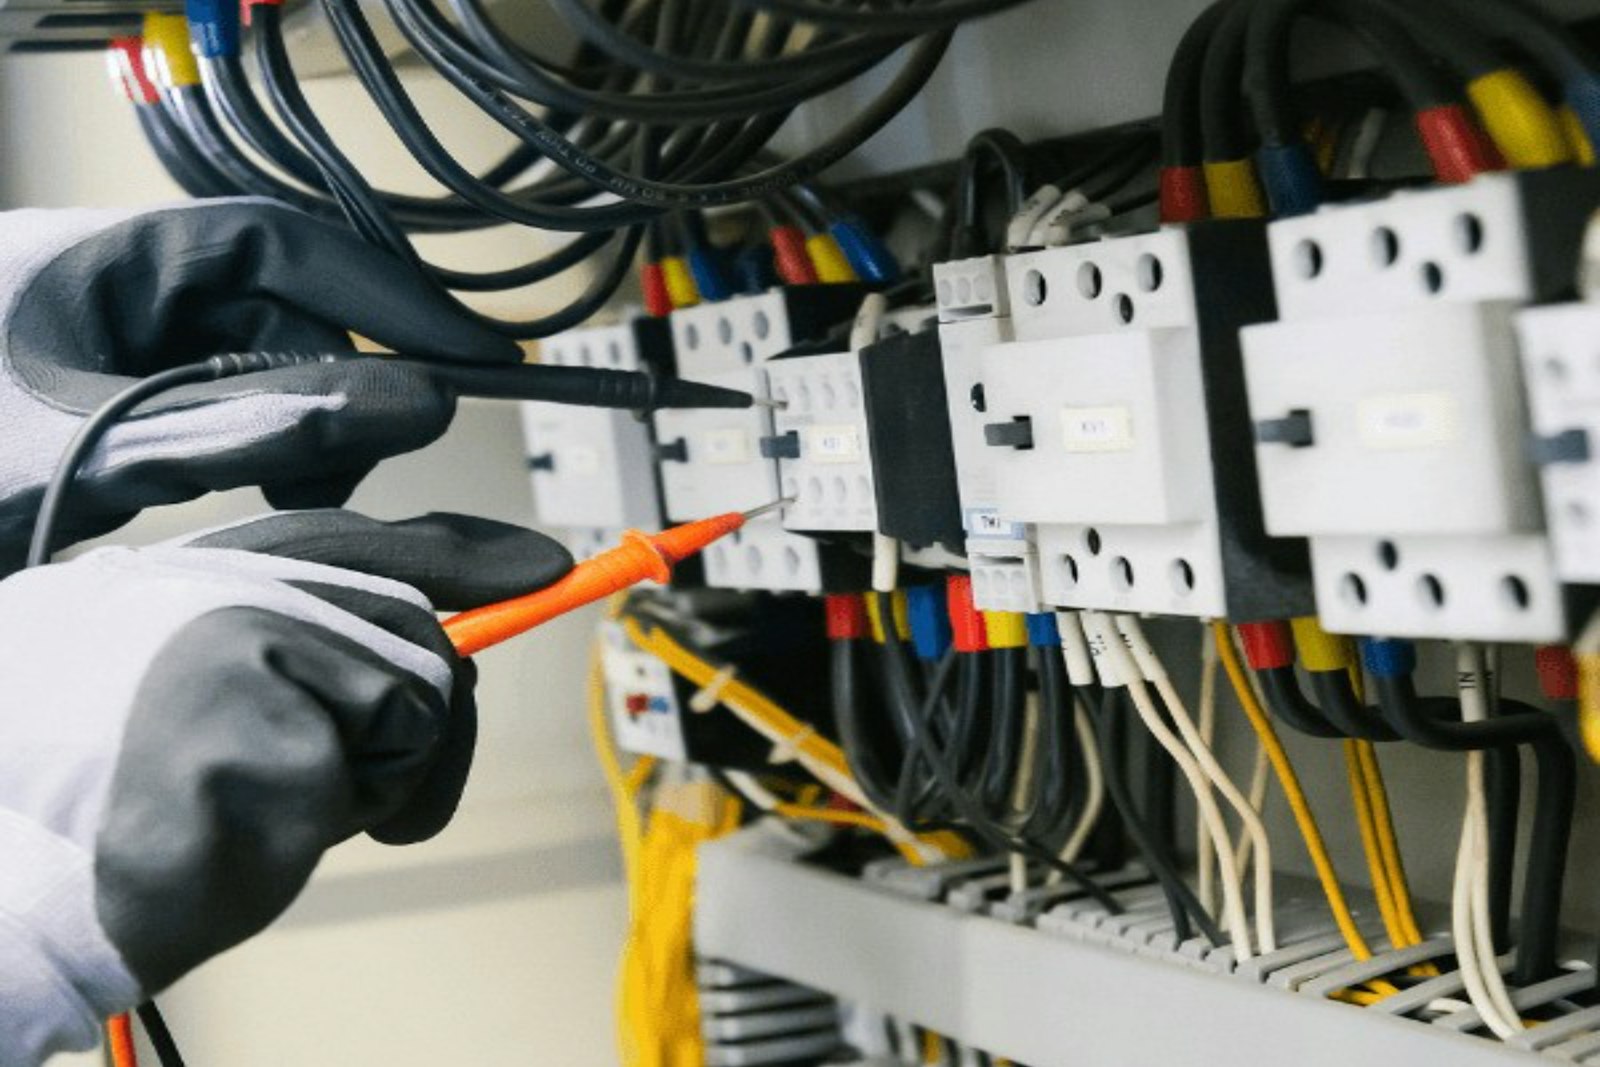
Electricity metering, before and after Aqueduct
- One utility meter and a monthly bill explain nothing.
- Tenants are billed by square foot, not by use.
- Power factor penalties show up on the bill unexplained.
- Old meters are read by hand once a month.
- Peak demand charges arrive after the peak has passed.
 The Aqueduct way
- Sub-meters show which feeder, floor or tenant used it.
- Tenant bills come from measured sub-meter data.
- Power factor is shown per feeder on the live single line.
- Pulse counters, bridges and cameras bring old meters online.
- Demand is tracked live so loads can be sequenced in time.
Electricity meter types and data points
Four ways to bring electricity data into Aqueduct.
| Device type | Data points |
|---|---|
| Electrical meter, pulse output | Pulse counts through a LoRaWAN pulse counter, converted in the cloud to cumulative kWh using the meter's pulse constant |
| Camera meter reading an existing meter | An image of the meter face is read with computer vision in the cloud, giving cumulative kWh and demand in kW from the change between images |
| CT clamp metering | The conductor passes through the current transformer. Provides metering, sub-metering and power monitoring data |
| Modbus meter | Meter data collected by a Modbus-to-LoRaWAN bridge and sent securely to the cloud |
Power monitoring measurements
Power monitoring includes all metering data plus a view of electrical performance and quality.
Metering, sub-metering and monitoring
| Layer | Answers |
|---|---|
| Metering | How much energy the building or system uses |
| Sub-metering | Who or what is using it: tenants, floors, feeders, equipment |
| Power monitoring | How efficiently and reliably the electrical system is running |
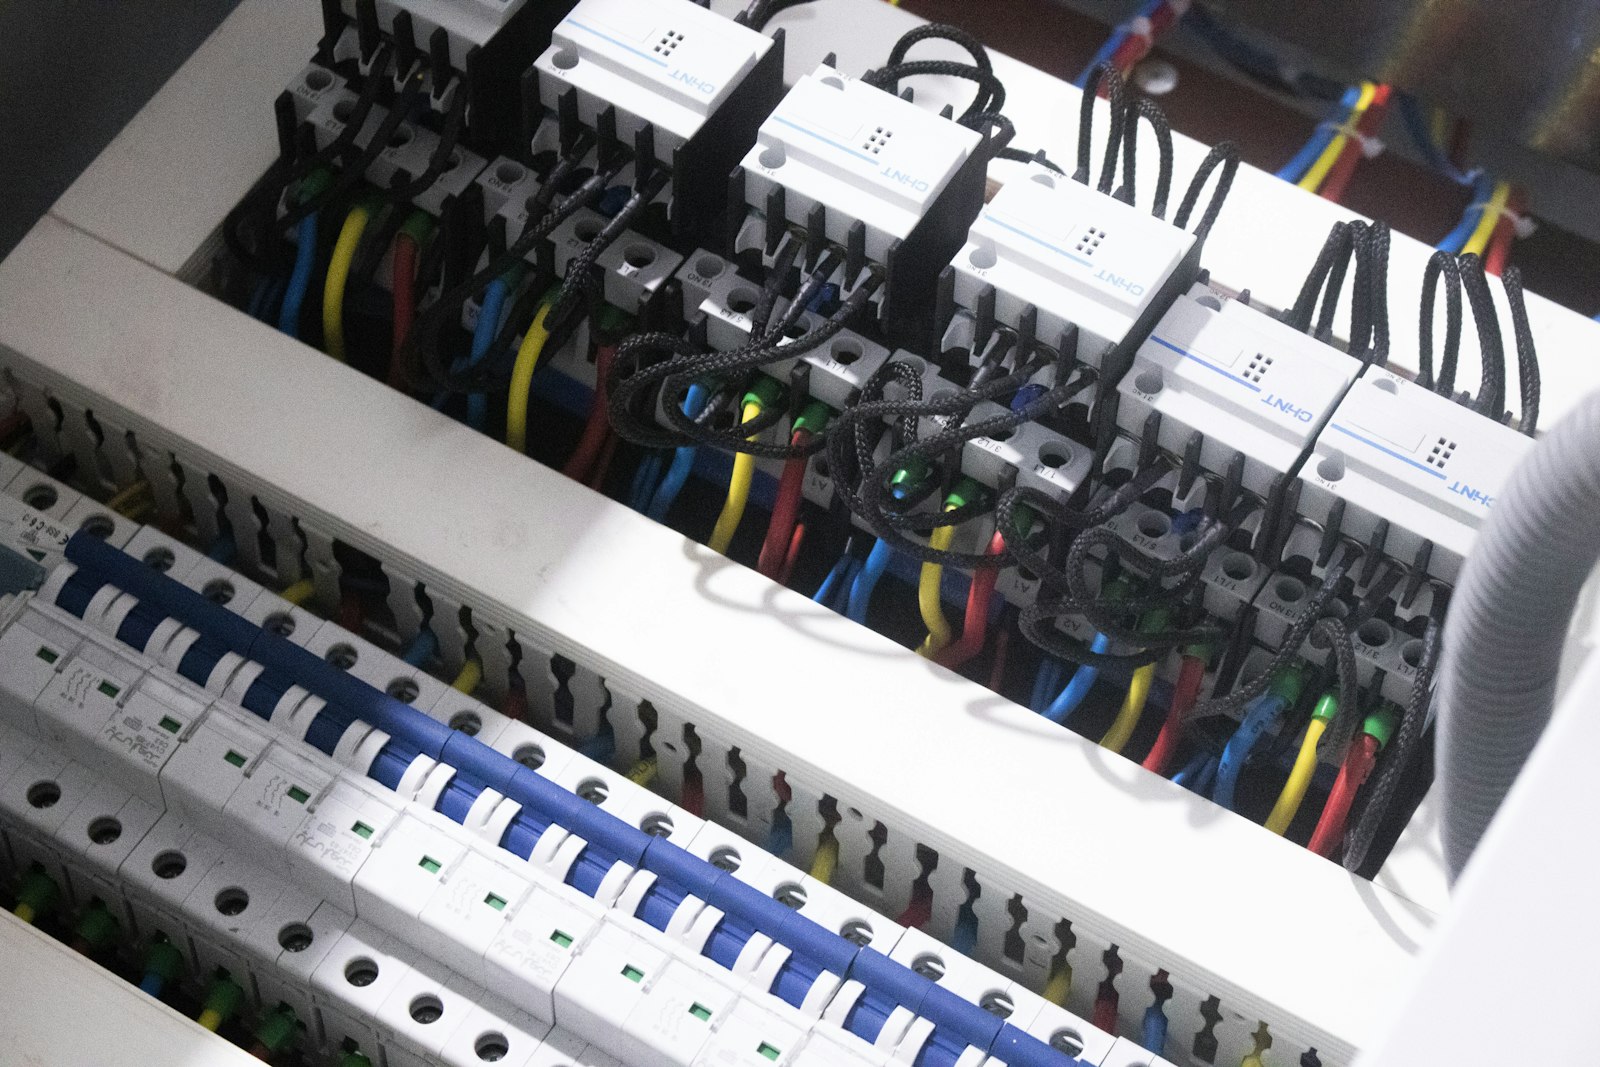
Metering tells you how much, sub-metering tells you who, monitoring tells you how well.
Talk to our teamFeatures and use cases this hardware powers
Tenant sub-metering and billing
Bill tenants on measured use, with shared and dedicated meters.
Learn moreWeather-normalized baselining
Expected use from history plus degree days, so savings are real.
Learn moreProtocols it speaks
An electricity meter or CT clamp monitor, chosen per site, that speaks these protocols.
Where teams put it to work
Bill tenants on measured electricity use
Sub-meters per tenant feed Aqueduct Billing Management, with shared and dedicated meters handled and anomalies flagged per tenant.
Learn more
Feeder-level visibility for critical loads
Power monitoring on each feeder shows loading, power factor and imbalance, so electrical issues are found before they become outages.
Learn more
Power quality where uptime matters most
Voltage, current, frequency and power factor are tracked continuously across the distribution, with peak demand on the same view.
Learn moreDevice agnostic, with leading manufacturers.
Exact make and model are selected per site. These are some of the manufacturers and standards Aqueduct works with.






sites in 21 countries run on Aqueduct.
and 9 clinics in one of India’s top hospital chains.
US airport running water intelligence on Aqueduct.
of commercial real estate under Aqueduct.
FMCG manufacturing campus.
operations run on Aqueduct.





Related
Common questions
Electricity sub-metering installs meters downstream of the main utility meter to measure individual tenants, floors, feeders or equipment. Aqueduct reads those meters so consumption can be attributed, billed and compared against a baseline.
Metering measures how much energy is used. Power monitoring adds how the electrical system performs: real, reactive and apparent power, voltage, current, frequency, power factor, imbalance and power quality.
Yes. Pulse output meters connect through a LoRaWAN pulse counter, Modbus meters through a Modbus-to-LoRaWAN bridge, and meters with no output can be read by a camera.
A current transformer clamps around a conductor and senses the magnetic field from the current. CT clamp metering gives metering, sub-metering and power monitoring data without breaking the circuit.
A low power factor means more current is needed for the same useful work, which raises losses and can bring utility penalties. Aqueduct shows power factor per feeder so correction can be targeted.
Yes. Aqueduct Billing Management bills tenants from sub-meter data, handles shared and dedicated meters, and flags bills that fall outside a tenant's usual range.
Aqueduct is device agnostic. Meters are chosen per site from the hardware we work with, based on panel layout, required measurements and protocol, and installed through partners.
See Aqueduct on your own facility.
Bring a site, a utility bill or a question. We will show you where the loss is.