Utility cost management software for CFOs, with savings verified at the meter
Utility cost management software helps finance teams control water, electricity and gas spend. Aqueduct compares what utilities billed with what your meters measured, separates usage changes from rate changes, flags demand charges, generates tenant bills and verifies savings at the meter against a weather-normalized baseline, so budgets and savings reconcile to real consumption.

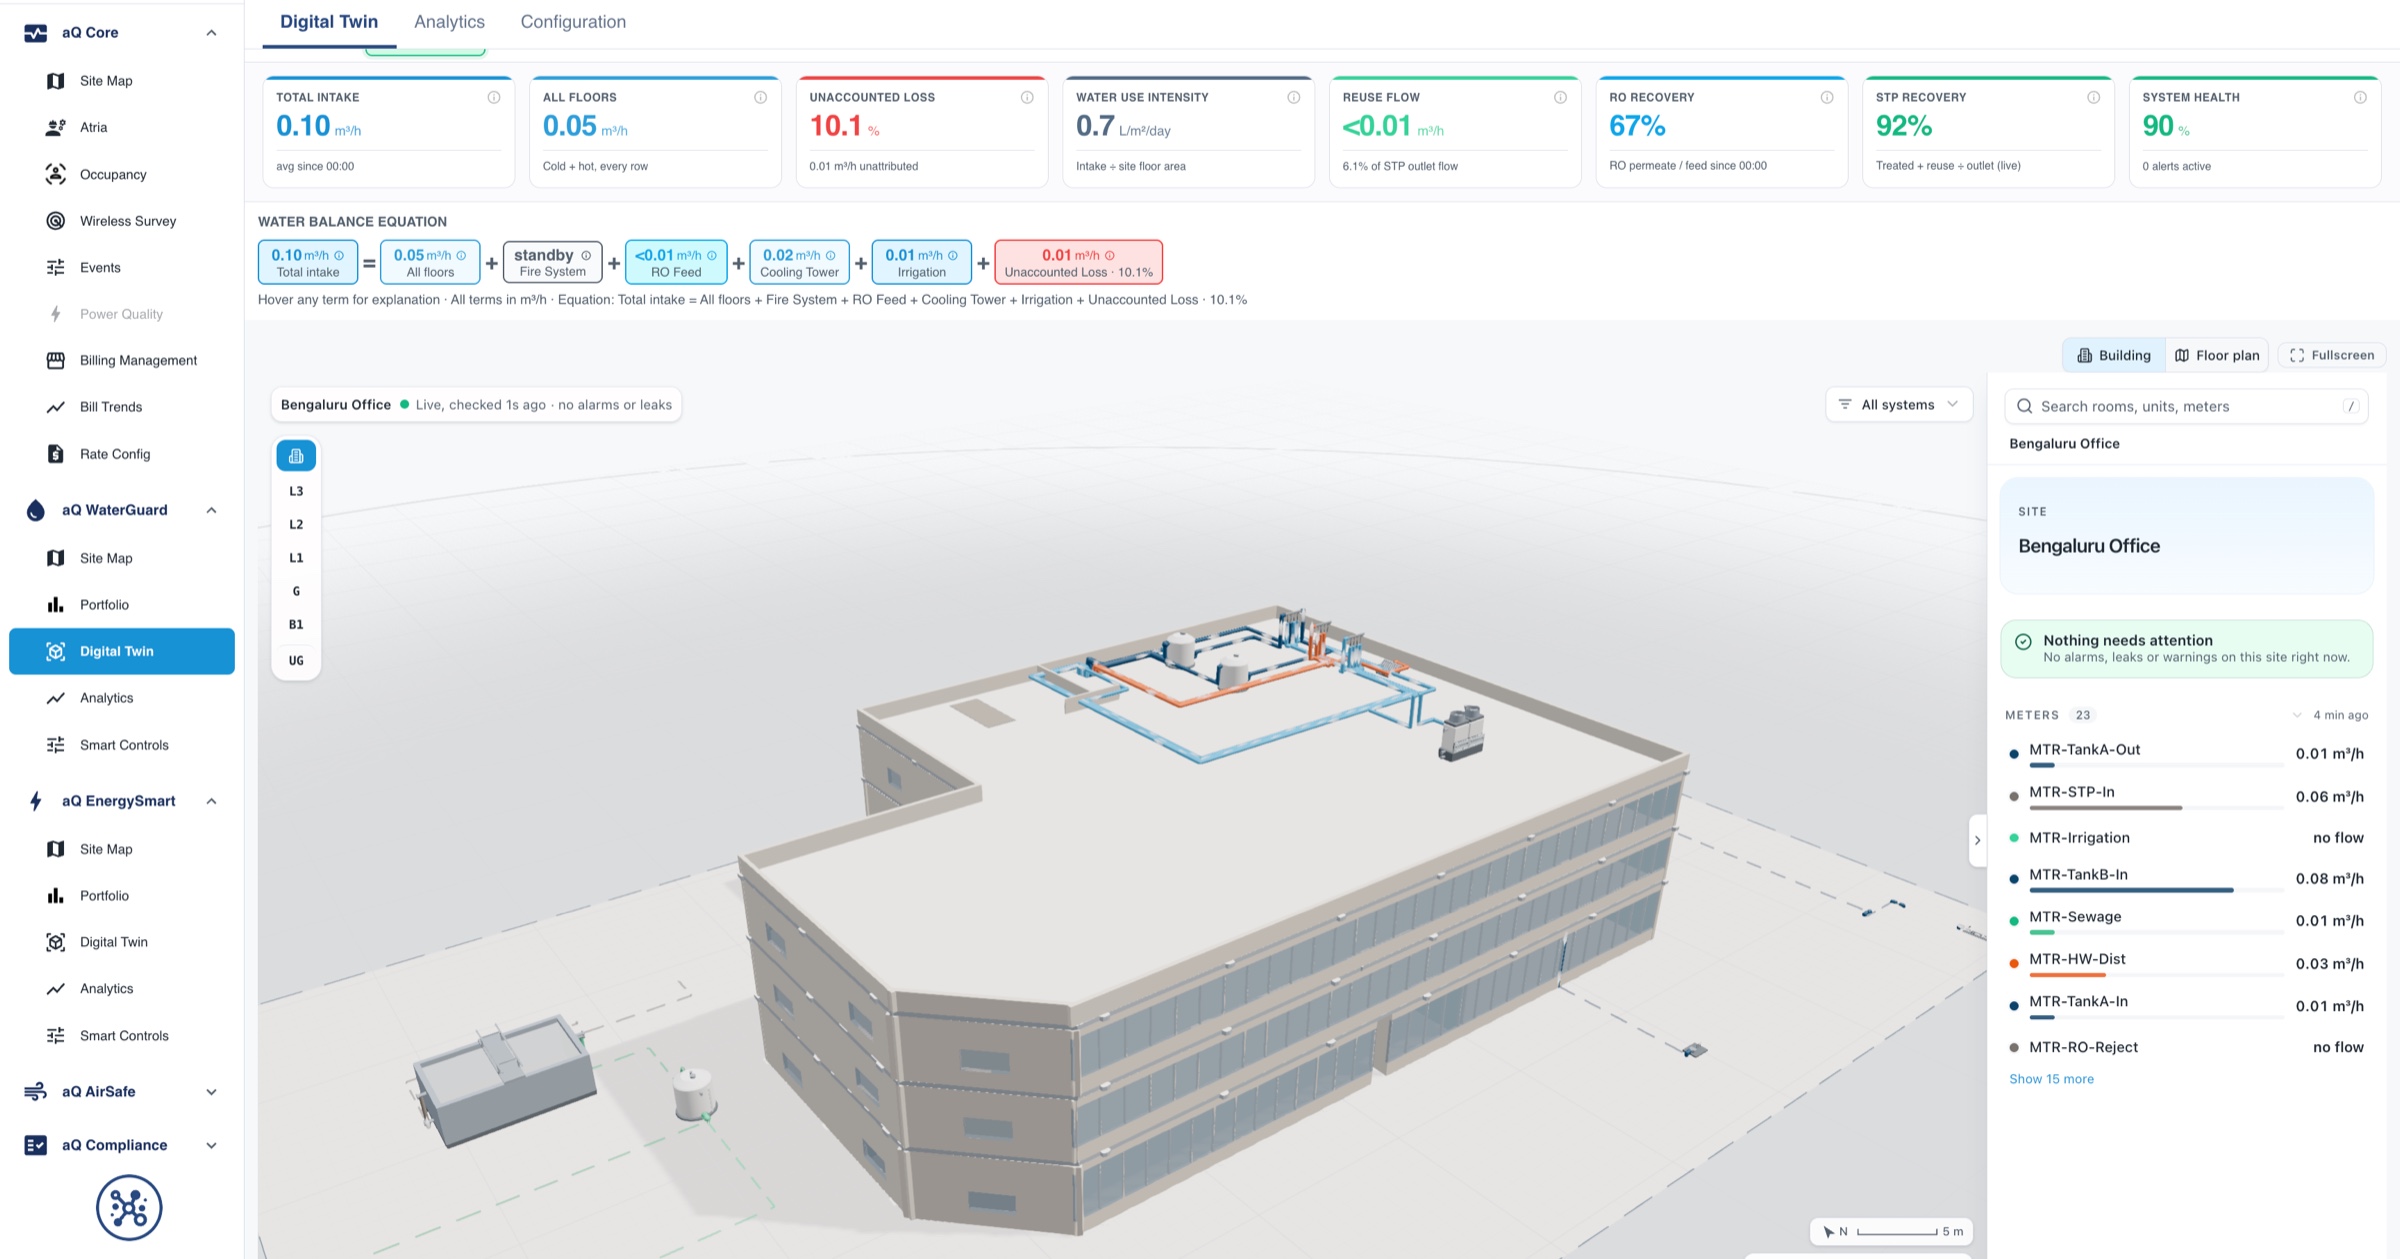
Every utility dollar tied to a meter, a cause and a verified result.
Bills checked against your own meters
- Billed versus metered
Utility consumption on the invoice compared with what your meters recorded for the same period.
- Mismatches flagged
Differences are raised before approval, with the meter data attached for the query.
- Usage or rate
Each cost change is split into usage and rate effects, by site and by meter.

Spend seen while the month is still open
- Current cycle
Accrued value for the cycle so far, from metered data rather than estimates.
- Month projection
A projection for the incomplete month, so budget variance shows up early.
- Peak demand watch
Demand tracked as it builds, before a single interval sets the monthly charge.
Savings that reconcile to the ledger
- Weather-normalized
Baselines use cooling and heating degree days, so weather does not distort the result.
- Priced from your bills
Rate configuration from your own utility bills turns verified units into money that finance recognizes.
- Measured, never promised
Energy and water savings verified at the meter against a weather-normalized baseline.

Utility spend, before and after Aqueduct
- Utility invoices are approved on trust, without a check.
- Spend variances arrive at month-end without a cause.
- Savings are claimed but never reconcile.
- Demand charges appear only on the bill.
- Tenant costs are allocated by floor area.
 The Aqueduct way
- Every invoice is checked against metered consumption.
- Variances split into usage, rate and weather.
- Savings are verified at the meter and priced.
- Peak demand is watched as it builds.
- Tenants are billed from dedicated and shared meters.
Why utility spend is hard for finance to control
Utilities are a large, recurring cost that finance sees only after it is paid.
Bills paid on trust
Invoices are approved without checking the billed consumption against any meter the business owns.
Variances without causes
Spend jumps and nobody can say whether usage rose, the rate changed or the weather was hotter.
Savings that never reconcile
Projects promise savings that never show up clearly in the ledger.
Demand charges as a surprise
One peak interval sets a demand charge for the month, and finance sees it only on the invoice.
What finance teams get from Aqueduct
Utility spend tied to real consumption, explained and verified.
Questions finance leaders ask
“Can I trust the savings figure?”
Yes, because it is measured. Savings are computed against a weather-normalized baseline and priced with your own utility rates, then verified at the meter.
“Why did utility spend rise this quarter?”
Aqueduct separates whether a cost change came from usage or from a rate change, by site and by meter, so the variance has a cause.
“Can we forecast utility spend mid-month?”
Yes. The current cycle shows accrued value and a projection for the incomplete month, from metered data rather than last year's bill.
“How do we catch billing errors?”
Billed consumption is compared with metered consumption every cycle, and mismatches are flagged before the invoice is approved.

How Aqueduct shows up in a finance team's month
An illustrative month-end for a multi-site business.
Day one
Utility invoices arrive. Billed consumption is compared with metered consumption, and two mismatches are flagged for query.
Mid-month
The current cycle projection shows one site trending above budget because of peak demand, and the engineering team is alerted.
Month-end
Variance commentary is written from data: usage up at one site, a rate change at another, weather explaining the rest.
Quarter-end
Verified savings against baseline are reported in money and reconcile with the bills.
Features and industries finance teams use most
Where utility spend is decided.
Where teams put it to work

Catch billing errors before payment
Billed consumption is compared with metered consumption each cycle, and mismatches carry the meter data finance needs to query the utility.
Learn more
Stay under the demand band
Peak kW is tracked as it builds, so loads can be sequenced before a single interval sets the month's demand charge.
Learn more
Recover costs from metered data
Tenant bills come from dedicated and shared meters, with anomalies flagged per tenant and recovery tracked across the portfolio.
Learn moreWhere finance meets the plant room
Utilities are one of the few large recurring costs most businesses pay without an independent check. These are the finance decisions that change once consumption is measured.
Approve or query an invoice
Billed consumption is compared with metered consumption for exactly the billing period. A mismatch goes to accounts payable with the meter data attached before payment.
- Electricity, water and gas validated the same way
- Estimated reads compared with measured use
- Demand and reactive charges checked against the tariff
- Measured
- consumption per billing period
- Decision
- approve, hold or query
- Aqueduct
- evidence attached to the query
Explain a variance
A higher bill can be more usage, a new rate or a hotter month. Splitting the three turns variance commentary into a sentence that holds up.
- Usage and rate effects by site and meter
- Weather share from degree-day baselines
- Sub-meters show which building or tenant moved
- Measured
- usage, rate and weather effects
- Decision
- who owns the variance
- Aqueduct
- a cause for every change
Forecast before the month closes
The current cycle accrues from metered data with a projection for the incomplete month, so budget pressure is visible while there is still time to act.
- Accrued value for the current cycle
- Projection for the incomplete month
- Peak demand tracked as it builds
- Measured
- consumption to date
- Decision
- intervene or accept
- Aqueduct
- early warning on budget
Book a saving
A project saving should reconcile to the bill. Aqueduct computes it against a weather-normalized baseline and prices it at your own rates, after the fix, not from the proposal.
- Regression on usage with cooling and heating degree days
- Rate configuration from your bills
- Each verified result becomes the new baseline
- Measured
- use after the fix against baseline
- Decision
- recognize or reject the claim
- Aqueduct
- measurement and verification
Recover cost from tenants
Tenant bills from dedicated and shared meters replace floor-area allocation. Anomalies are flagged against each tenant's own range before the bill goes out.
- Shares of shared meters calculated from data
- Bills on demand, with line items per meter
- Recovery tracked by tenant and facility
- Measured
- tenant consumption
- Decision
- bill, adjust or investigate
- Aqueduct
- billing from the meter in aQ Core
Utility metrics that reconcile to the ledger
Each metric ties to a meter, a period and a rate, so it can be reconciled rather than trusted.
| Metric | Source | Use in finance |
|---|---|---|
| Billed versus metered | Invoice against your own meters | Hold or query before approval |
| Usage effect and rate effect | Consumption and tariff by period | Variance commentary |
| Weather effect | Degree-day baseline per site | Separate operations from climate |
| Current cycle accrual | Metered consumption to date | Mid-month forecast |
| Peak demand against contract | Interval data from the main meter | Demand charge exposure |
| Verified savings | Use after fix against baseline, at your rates | Recognize project returns |
| Tenant recovery | Dedicated and shared meters | Recovery rate by facility |
Why utility spend deserves an independent check
rise in combined US household water and sewer bills from 2019 to 2024
Source: Bluefield Research: U.S. water and sewer bill has increased 24% in five yearsa year in uncaptured revenue from water lost in US utility networks
Source: Water Online: Water losses cost U.S. utilities US$6.4B annually (Bluefield Research)up to this share of a UAE building's electricity demand goes to cooling
Source: Heriot-Watt University: Retrofit options to reduce climate change impacts on UAE buildingsA finance team's first quarter
Upload 6 to 12 months of bills
Rates, periods and billed consumption load for every site, which sets the baseline and the rate configuration.
Validate the next cycle
The first live billing period is compared with metered consumption, and mismatches are queried with evidence.
Write variance commentary from data
Month-end commentary splits usage, rate and weather by site, without a request to the facilities team.
Report verified savings at quarter-end
Savings from completed fixes are reported in money and reconcile with the bills.
sites in 21 countries run on Aqueduct.
and 9 clinics in one of India’s top hospital chains.
US airport running water intelligence on Aqueduct.
of commercial real estate under Aqueduct.
FMCG manufacturing campus.
operations run on Aqueduct.





Related
Common questions
It is software that tracks, validates and reduces spend on water, electricity and gas. Aqueduct ties every bill to metered consumption, separates usage from rate changes, and verifies savings at the meter against a weather-normalized baseline.
By comparing the consumption the utility billed with consumption measured by their own meters. Aqueduct does this every cycle and flags mismatches before invoices are approved.
Aqueduct builds a weather-normalized baseline from usage plus cooling and heating degree days, measures actual use against it, and applies the rate configuration from your utility bills to turn the difference into money.
Yes. Aqueduct separates whether a cost change came from usage or from a rate change, by site and by meter, and the weather-normalized baseline shows how much the weather contributed.
No. Aqueduct measures savings rather than guaranteeing them. Each saving is verified at the meter against a weather-normalized baseline.
Uploading 6 to 12 months of utility bills gives a day-one baseline and rate configuration, so performance against baseline and bill validation start straight away.
Yes. Aqueduct Billing Management generates tenant bills from dedicated and shared meters, flags anomalies per tenant and shows how much cost has been recovered across the portfolio.
It holds consumption and tariff for each billing period, so a cost change can be split into the part caused by more or less usage and the part caused by a new rate. Weather is separated using the degree-day baseline.
Yes, where interval data from the main meter is available. Peak demand and power factor are measured and compared with what the tariff charged.
The metered consumption for the same period, the meter and site, and the difference against the invoice. Finance or the utility can trace each number back to the device.
Projected savings come from a proposal before work starts. Verified savings are measured after the fix against a weather-normalized baseline and priced at your own rates.
See Aqueduct on your own facility.
Bring a site, a utility bill or a question. We will show you where the loss is.