Tenant submetering and billing software that bills from the meter, not the floor plan
Tenant submetering and billing software charges each tenant for the utilities they actually use. Aqueduct Billing Management maps tenants to dedicated and shared meters, generates bills from metered data, shows the current cycle as it accrues, flags anomalies when a tenant's usage leaves its own usual range, and shows who drives cost and how much has been recovered.

Bill every tenant for what the meter measured, and show them how.
Every tenant mapped to the meters that serve it
- Dedicated or shared
Each meter is marked dedicated or shared, with utility type recorded per tenant.
- Role-based visibility
Landlords see total consumption and every tenant's share, while each tenant sees only its own share.
- Data confidence
Meter connectivity is shown as a percentage, so gaps are visible before billing.
Tenant bills generated from metered consumption, on demand
- Line items per meter
Each bill lists meters, period start and end, total and percentage change.
- Current cycle
Each tenant's accruing value is shown mid-month, plus a projection for the incomplete month.
- On demand
Bills can be generated at any time, not only when the cycle closes.
Disputes prevented early and recovery tracked across sites
- Per-tenant anomalies
Usage outside a tenant's own usual range is flagged before the bill goes out.
- Usage or rate
Cost changes are split into usage and rate effects, so tenants see why.
- Recovery insights
Who drives cost, where, and how much has been recovered, across the portfolio.
Tenant billing, before and after Aqueduct
- Tenants are billed by floor area.
- Shared meter splits cannot be explained.
- Usage spikes surface as tenant disputes.
- Nobody knows what is owed until month-end.
- Cost recovery is a manual spreadsheet exercise.
 The Aqueduct way
- Tenants are billed from metered consumption.
- Shared meter shares are calculated from data.
- Anomalies are flagged against each tenant's own range.
- The current cycle accrues visibly all month.
- Recovery is tracked by tenant and facility.
Why tenant utility recovery leaks
Most multi-tenant buildings still recover utilities by floor area or estimate.
Billing by square foot
Allocations by floor area overcharge light users and undercharge heavy ones, and both notice.
Shared meters, shared arguments
When tenants share a meter, nobody can show how the total was split.
Anomalies found by the tenant
A tenant's usage doubles and the landlord learns about it when the tenant disputes the bill.
Bills only at month-end
Nobody knows what a tenant owes until the cycle closes, so surprises arrive all at once.
How tenant billing works in Aqueduct
Billing Management sits under aQ Core and reads the same meters every other module uses.
Map tenants to meters
Each tenant is set up with its meters, marked as dedicated or shared, and its utility types: electricity, water or gas.
Accrue the current cycle
The current cycle in progress shows each tenant's accruing value mid-month, with a projection for the incomplete month.
Flag anomalies per tenant
An anomaly fires when a tenant's usage falls outside that tenant's own usual range, not on absolute size.
Generate the bill
Bills are generated per tenant with line items per meter, period start and end, totals and percentage change.
See recovery across the portfolio
Insights show who is driving cost, at which facility, and how much has been recovered.
What it needs on site
Existing tenant meters connect if they emit telemetry. New sub-meters are installed through partners.
| Device | What it measures or does | Why it matters |
|---|---|---|
| Dedicated tenant meters | Electricity, water or gas per tenant | Direct, undisputed consumption |
| Shared meters | Consumption across several tenants | Shares calculated from data, with role-based visibility |
| Main meters | Building totals | Reconciles tenant totals with the utility bill |
| Rates and tariffs | Price per unit for each utility | Turns consumption into each tenant's bill |
A tenant bill should be something the tenant can check for themselves.
Talk to our teamWho sees what
Landlord and tenant views on the same data.
| Role | Sees | Does not see |
|---|---|---|
| Landlord | Total consumption and each tenant's share of every shared meter | Nothing hidden |
| Tenant | Its own dedicated meters and its own percentage of shared meters | Other tenants' consumption |
| Finance | Bills, anomalies, cost drivers and recovery by facility | Not applicable |
Who cares about this
The seats that ask for this first.
Heads of real estate and portfolio leaders
Tenant recovery that holds up across the portfolio.
Learn moreWhere teams put it to work

Floors and suites billed from meters
Multi-tenant offices bill electricity and water per suite from dedicated and shared meters, with each tenant seeing only its own share.
Learn more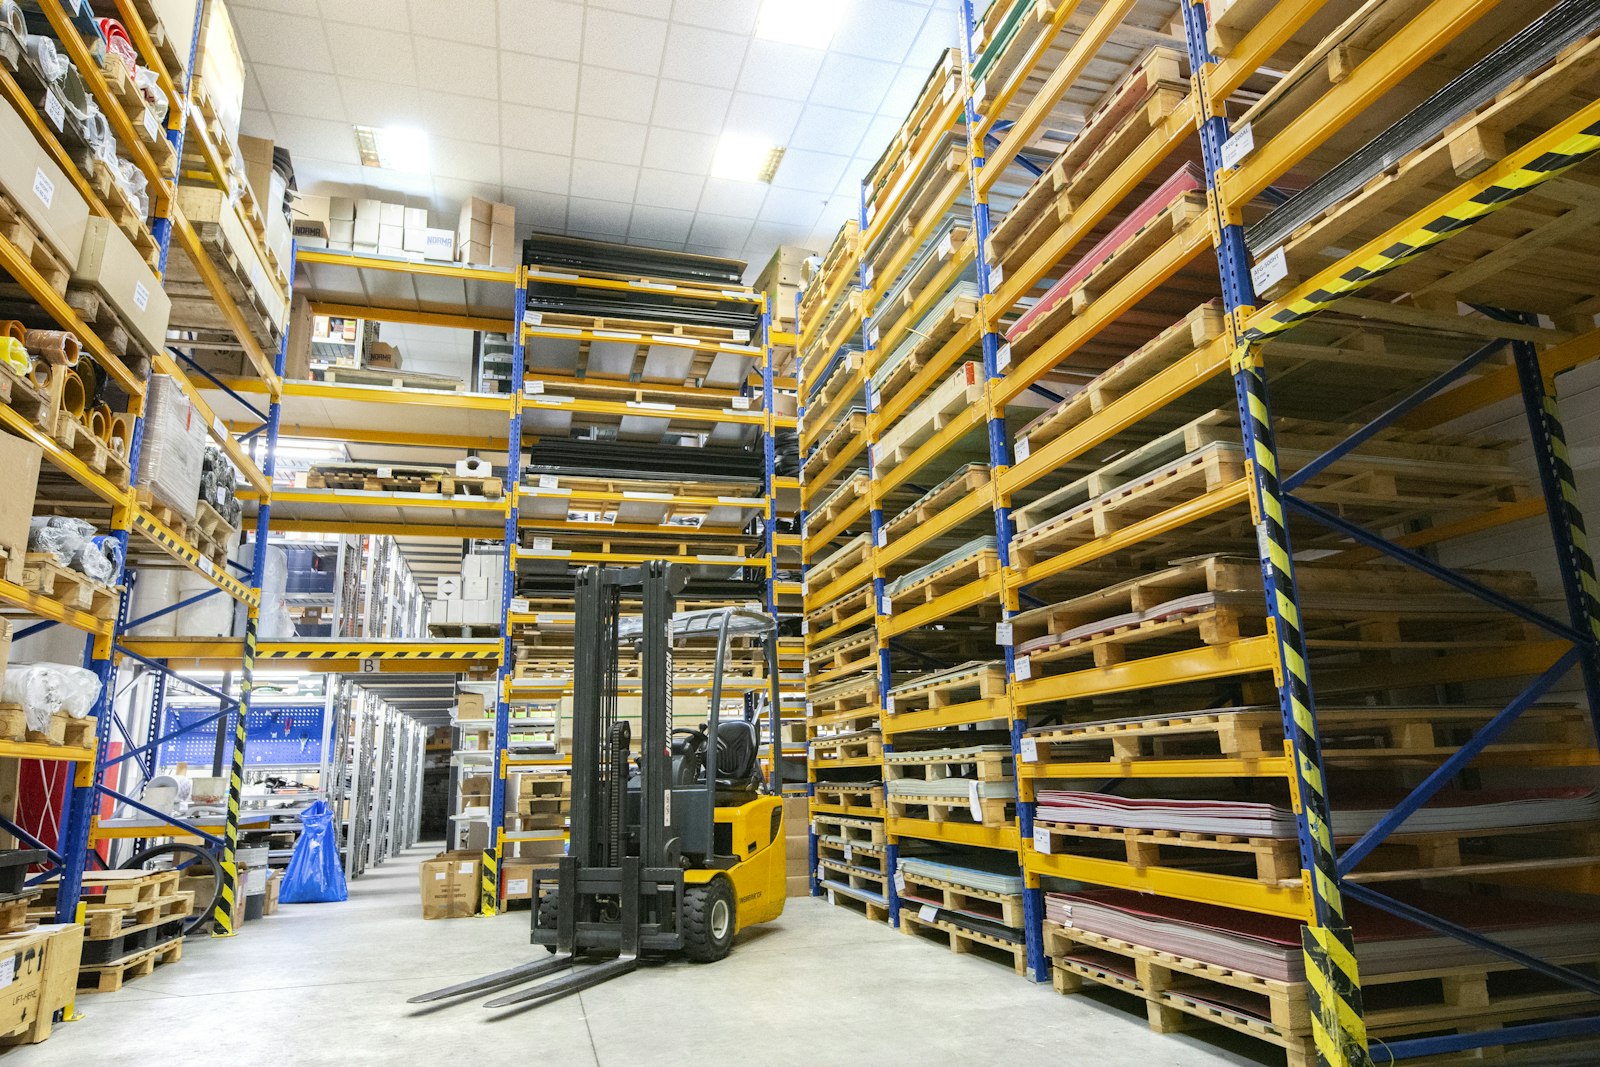
Tenants with process loads
Industrial tenants with heavy process loads are billed on metered use, with anomalies flagged before invoices go out.
Learn more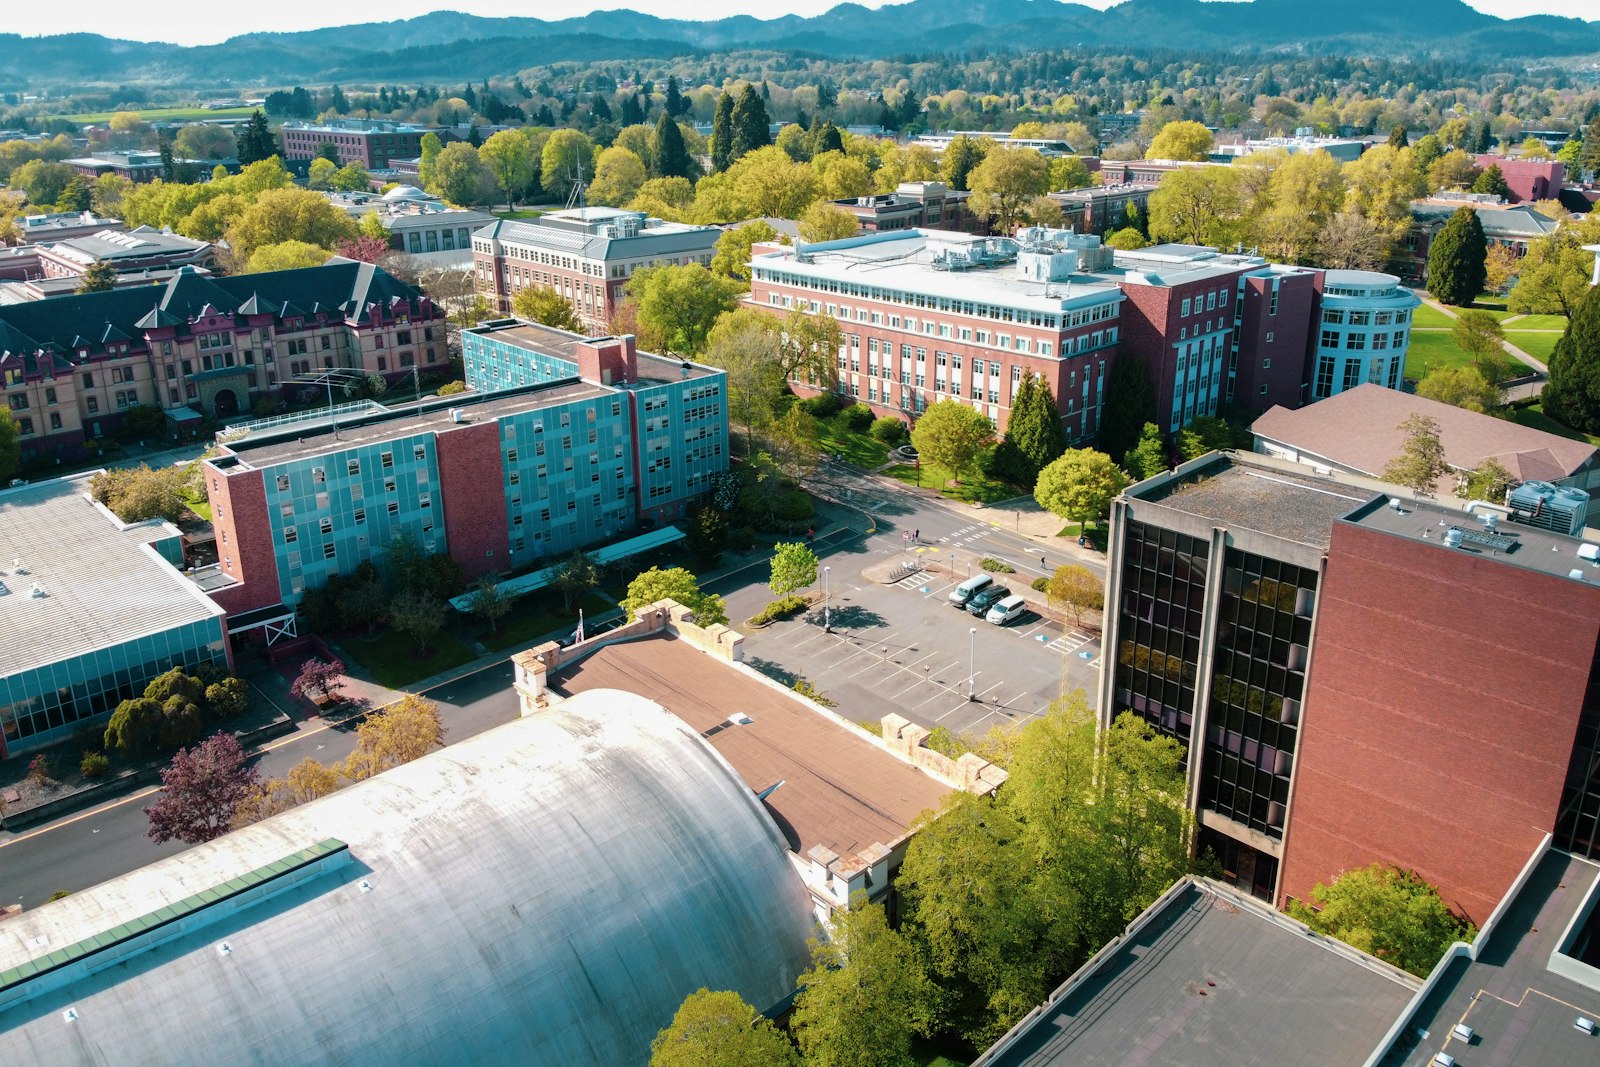
Departments charged on use
Universities allocate utility costs to departments, labs and residences from sub-meters rather than by floor area or headcount.
Learn moreWhere landlords lose utility recovery
Recovery leaks at a handful of predictable points, most of them in how meters are mapped and shared.
Floor-area allocation
Light users overpay, heavy users underpay, and both dispute
Dedicated tenant meters
Bills from consumption
Shared meters
Nobody can show how a shared total was split
Shared meter with tenant shares
Shares calculated from data, visible per role
Common areas
Landlord absorbs loads that could be recovered
Common area sub-meters
Separates common from tenant use
Meter gaps
Bills issued on incomplete data
Meter connectivity percentage
Shows data confidence before billing
Usage spikes
Tenant finds the anomaly on the bill and disputes it
Each tenant's usual range
Flags anomalies before the bill goes out
Rate changes
Tenants assume higher usage when the rate rose
Usage and rate by period
Splits usage and rate effects
Month-end surprises
Nobody knows what is owed until the cycle closes
Current cycle accrual
Mid-month projection per tenant
Which meter for which tenant situation
A practical guide to metering a multi-tenant building for billing.
| Situation | Meter approach | Bill basis |
|---|---|---|
| Single tenant on its own supply | Dedicated meter | Full consumption |
| Several tenants on one riser | Shared meter plus tenant sub-meters where possible | Calculated shares |
| Common areas and plant | Common area sub-meters | Recovered under lease terms or retained |
| Tenant with process load | Dedicated meter on the process feeder | Full consumption |
| Water and gas | Dedicated or shared meters per utility | Same method as electricity |
| Building total | Main meters | Reconciles tenant bills with the utility bill |
Moving a building from allocation to metered billing
Survey the meters you have
List each meter, the tenants it serves and whether it emits telemetry. Existing meters connect; gaps are filled through partners.
Map tenants in aQ Core
Each tenant is linked to its dedicated and shared meters, with utility types recorded.
Run a shadow cycle
Generate metered bills alongside the current method for one cycle and compare, so differences are understood before tenants see them.
Switch and track recovery
Bill from the meter, flag anomalies before issue and track recovery by tenant and facility.
What each party gets from metered billing
Landlord
Total consumption, every tenant's share of shared meters, anomalies before billing, and recovery tracked by facility.
Tenant
Its own dedicated meters and its own share of shared meters, with the current cycle visible mid-month and line items it can check.
Finance
Bills that reconcile to meters and to the utility invoice, cost drivers by tenant and site, and recovery rates across the portfolio.
sites in 21 countries run on Aqueduct.
and 9 clinics in one of India’s top hospital chains.
US airport running water intelligence on Aqueduct.
of commercial real estate under Aqueduct.
FMCG manufacturing campus.
operations run on Aqueduct.





Related
Common questions
Tenant submetering is installing meters below the main utility meter so each tenant's electricity, water or gas use is measured directly. Aqueduct reads those meters and uses them to bill tenants on actual consumption instead of floor area.
Shared meters are marked as shared and each tenant's share is calculated from data. A landlord sees the total and every tenant's share, while each tenant sees only its own percentage.
An anomaly fires when a tenant's usage falls outside that tenant's own usual range, rather than on an absolute threshold. That catches a small tenant doubling its use as well as a large one.
Yes. The current cycle in progress shows accruing value mid-month, and bills can be generated on demand, so neither side is surprised at cycle close.
Yes. Billing Management handles electricity, water and gas per tenant, with gas in therms or cubic meters.
Aqueduct Insights shows who is driving cost, at which facility, and how much has been recovered, with tenant versus tenant and site versus site comparison.
That depends on your leases. Many allow metered recovery already; your legal and leasing teams decide. Aqueduct generates bills on whichever basis the lease allows.
Shares are calculated from data such as tenant sub-meters on the same supply. A landlord sees the total and every share, and each tenant sees only its own.
A cycle where metered bills are generated alongside the existing allocation method without being issued. It shows how each tenant's bill would change before the switch.
Yes. Main meters give the building total, so tenant bills plus common areas can be reconciled against what the utility billed.
Yes. Electricity, water and gas meters are mapped per tenant in the same way, and bills carry line items per meter and utility.
Meter connectivity is shown as a percentage before billing, so a gap is visible before the bill is generated. Your team decides whether to estimate the gap under the lease terms or hold the bill until data is restored.
See Aqueduct on your own facility.
Bring a site, a utility bill or a question. We will show you where the loss is.