A facility operations management platform that acts, then verifies
A facility operations management platform gives operations leaders one view of uptime, losses and response across sites. Aqueduct finds faults and early signs of failure, explains the cause, routes work into your CMMS, acts where control is enabled with owner approval, and confirms each fix at the meter, so operations improve without replacing the systems teams already run.
Faults fixed, failures prevented, and every closure checked at the meter.
Failures caught before they stop the operation
- Early signs of failure
Rising vibration, a new sound signature or energy drift schedules maintenance first.
- Faults diagnosed
Each fault arrives with the component, the evidence and a recommended fix.
- Device health
Connection rate and battery voltage show which sensor needs attention, before the data goes quiet.
Work routed into the CMMS your teams already run
- Better tickets
Location, trace and cause travel with the ticket, so technicians start at the right asset.
- Ranked by impact
Findings across sites are ordered by cost and urgency, so crews go where it matters.
- Control where enabled
Schedules and setpoints adjust where control is enabled, with owner approval and every command logged.
Closed means the meter agrees the fix worked
- Verified at the meter
Flow, load or airflow must return to range before an item counts as fixed.
- New baseline
Every verified result becomes the next baseline, so gains hold over time.
- Portfolio view
Sites compared on one basis, with top improvers and sites needing attention.
Facility operations, before and after Aqueduct
- Downtime is the first sign of a failing asset.
- Every site works its own way, with its own tools.
- Technicians repeat the diagnosis on arrival.
- Closed work orders are assumed to be fixed.
- Head office learns about problems last.
 The Aqueduct way
- Early signs of failure schedule maintenance first.
- One platform, one way of working across sites.
- Tickets arrive with the cause and the evidence.
- The meter or sensor confirms every closure.
- Head office sees every site against baseline.
What operations leaders see across sites
Every site runs differently, and the head office learns about problems last.
Downtime discovered late
A chiller, compressor or pump fails and the first signal is a stopped line, a hot ward or an angry tenant.
Every site its own way
Different systems, vendors and habits mean no common view of response, closure or results.
Tickets without evidence
Work orders say what was reported, not what the data shows, so technicians repeat the diagnosis on site.
Closure is not confirmation
Work is marked complete, but nobody checks whether the asset is back in range.
What operations leaders get from Aqueduct
One way of working across every site, with the meter as referee.
Questions operations leaders ask
“Will this replace the CMMS my teams run?”
No. Aqueduct integrates with your CMMS. It sends better tickets in and confirms results after the work closes.
“Can I compare sites on one basis?”
Yes. Sites are ranked on performance against baseline and normalized intensity, with top improvers and sites needing attention.
“How do we catch failures before they stop a line?”
Early signs of failure, such as rising vibration, a new sound signature or energy drift, schedule maintenance before the equipment fails.
“Do we need more technicians?”
Aqueduct does not supply staff. It reduces search time by sending findings with a location and cause, so existing teams fix more in the same hours.
How Aqueduct shows up in an operations leader's week
An illustrative week across a regional set of sites.
Monday
The portfolio view shows two sites needing attention: one with a fault on an AHU, one with rising compressor vibration.
Tuesday
The AHU fault routes into the CMMS with the diagnosis. Compressor maintenance is scheduled before failure.
Thursday
Restroom sensors flag a running toilet in an unoccupied block. Plumbing is dispatched without waiting for a complaint.
Friday
Closed items are checked against the meter. Each verified result becomes the new baseline for its site.
Features and industries operations teams use most
Where uptime and response are won.
Where teams put it to work
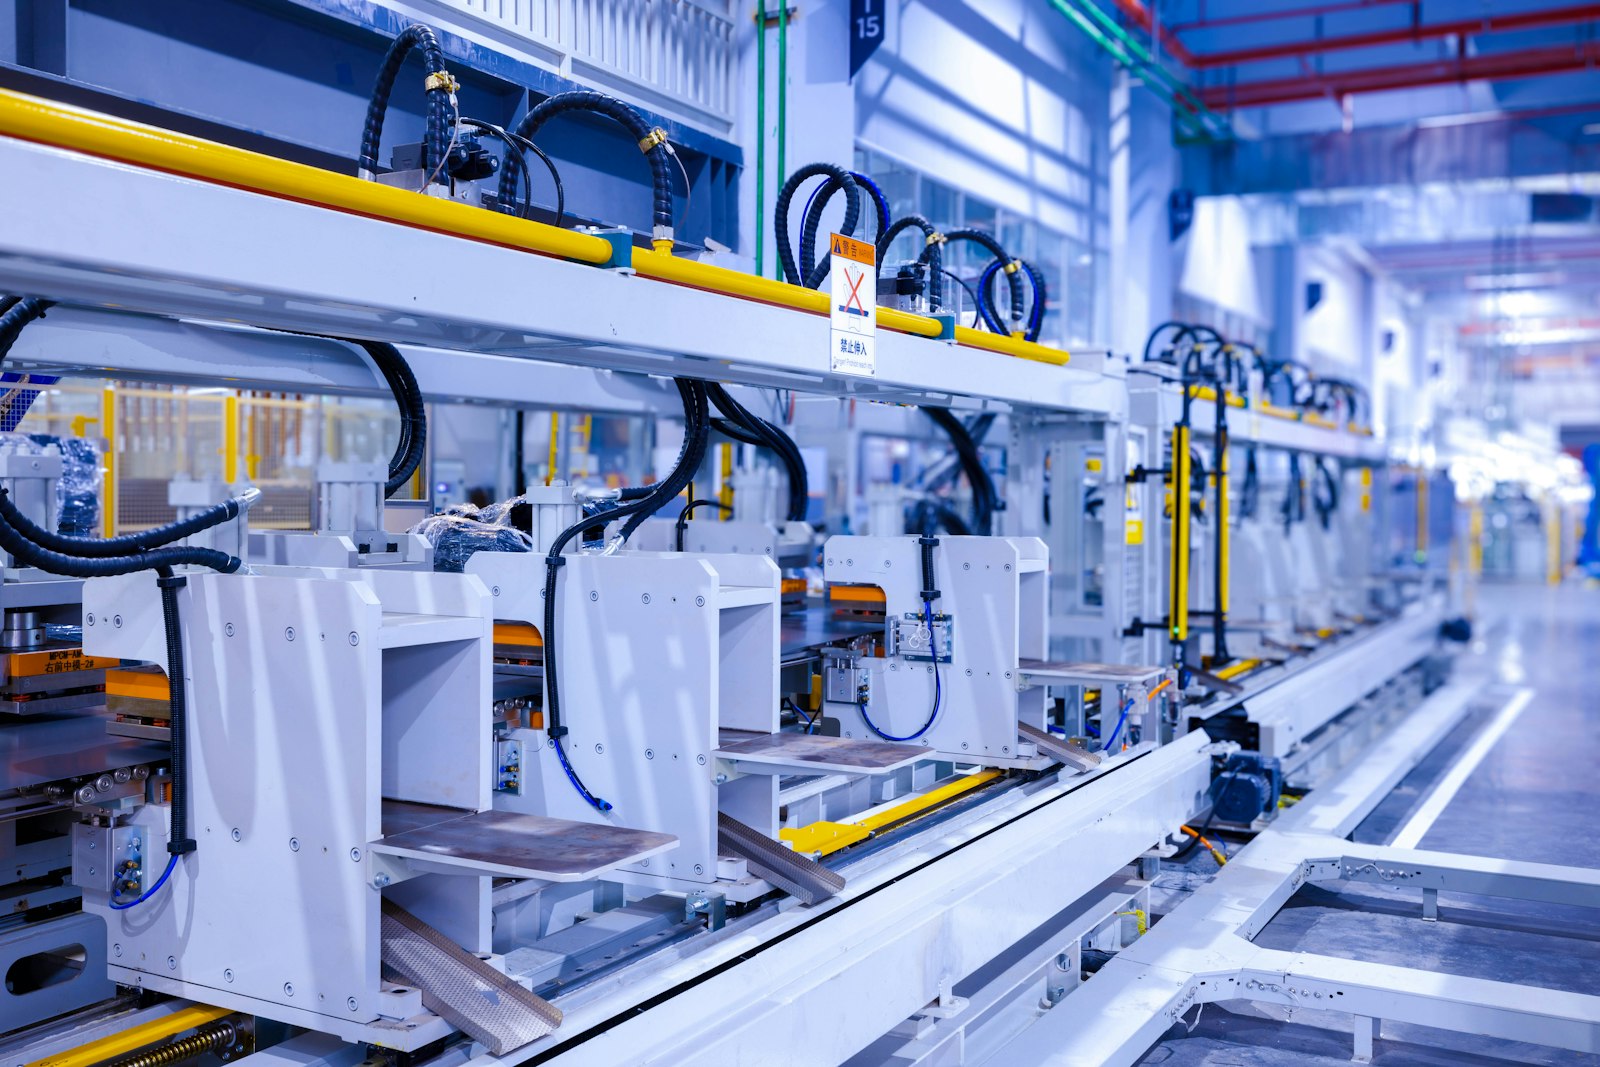
Lines kept running on early signals
Compressors, pumps and process utilities show early signs of failure, so maintenance is scheduled before a line stops.
Learn more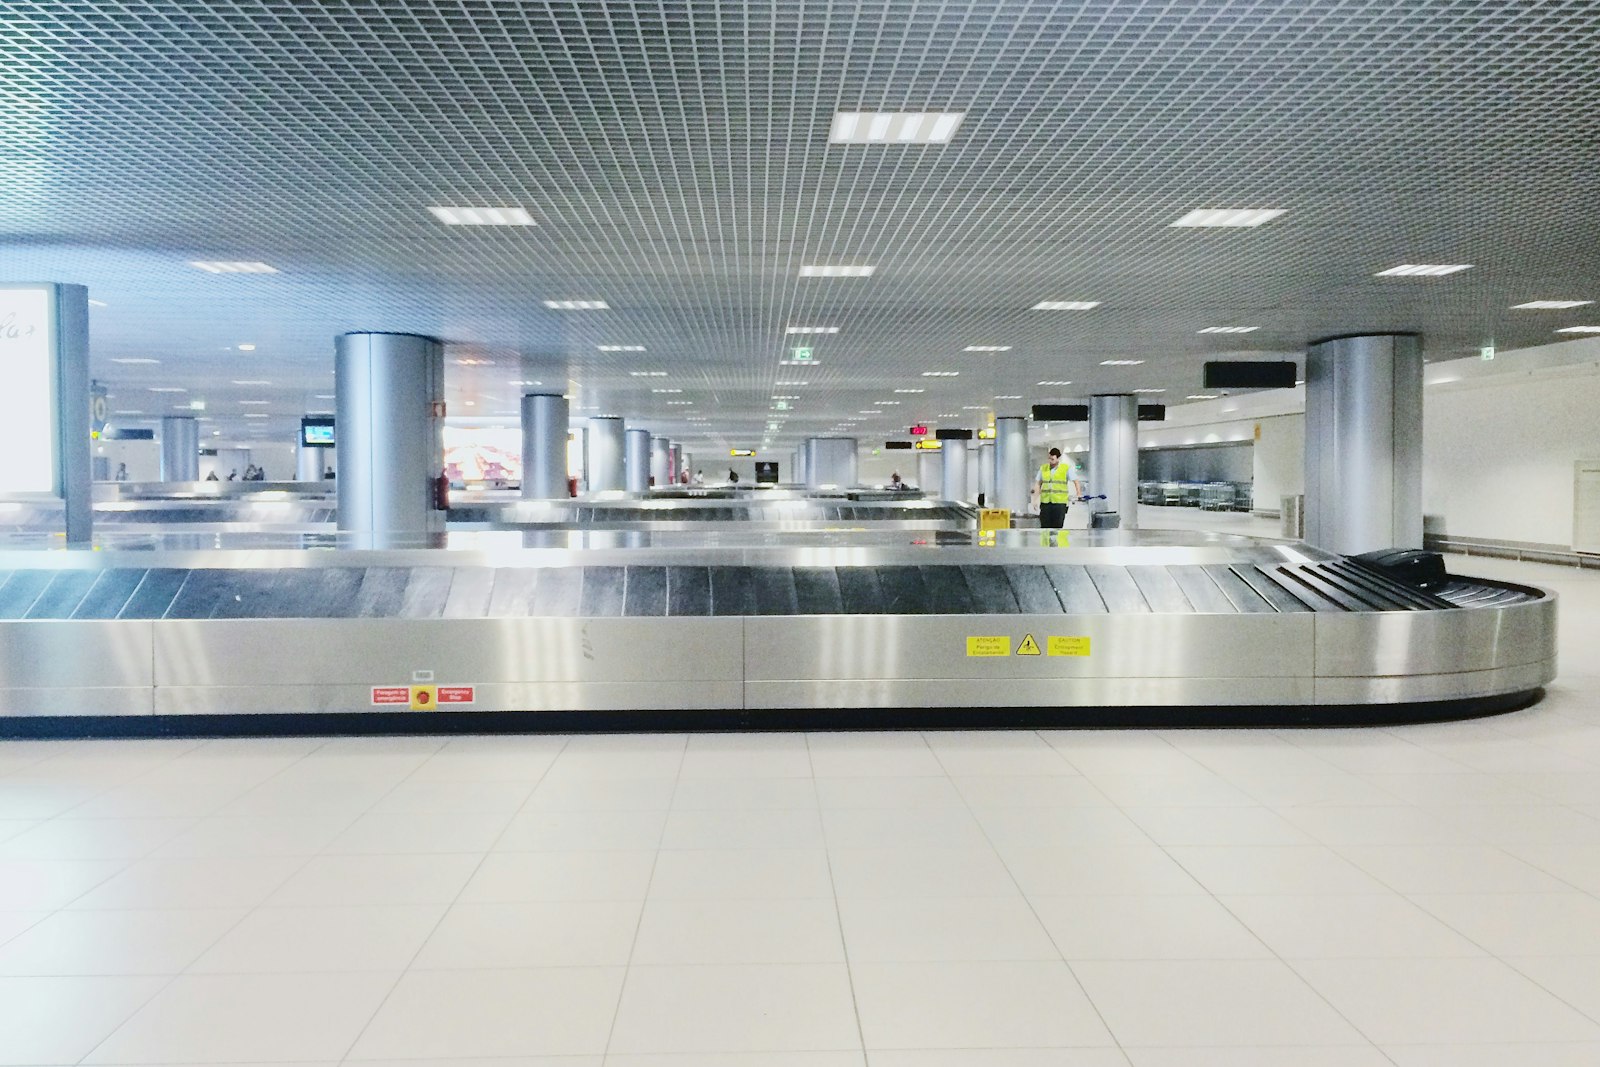
Around-the-clock operations, one view
Terminals run water, energy and air systems that never stop, with faults routed into the CMMS and confirmed closed.
Learn more
Cleaning and plumbing on real need
Odor, sound, occupancy and water data flag running fixtures and cleaning needs, replacing fixed rounds with targeted visits.
Learn moreHow a regional operations leader runs the week
Operations leaders manage exceptions across many sites. Here is what each day looks like when every site reports on the same basis.
Portfolio review
Sites are ranked on performance against baseline and on open critical findings. Two sites need attention before the regional call.
- Top improvers and needs attention filters
- Open faults on critical assets by site
- Device health exceptions
- View
- portfolio across water, energy and air
- Output
- the week's priority list
- Aqueduct
- one basis for every site
Risk on critical assets
A compressor shows rising vibration and energy drift. aQ PredictIQ schedules maintenance in a planned window instead of waiting for a trip.
- Vibration, sound signature and energy drift
- Recommended action and window
- Spares and contractor booked ahead
- Measured
- condition of rotating equipment
- Output
- planned work order
- Aqueduct
- early sign of failure
Closure audit
Closed tickets from last week are checked against the data. Two reopen because the asset is still out of range.
- Verified closure against baseline
- Reopened items with evidence
- Contractor performance by site
- Measured
- flow, load or airflow after repair
- Output
- confirmed or reopened
- Aqueduct
- the meter as referee
Standard work across sites
An automation that works at one site, such as raising cooling setpoints when a floor empties, is reviewed for rollout where control is enabled, with owner approval.
- Rules copied with site-specific limits
- Command history for each change
- Comfort compliance watched after rollout
- Measured
- energy and comfort
- Output
- a standard applied across sites
- Aqueduct
- controlled rollout
Report up
Verified results, avoided failures and open risks go to the COO on one page, built from data rather than site emails.
- Verified savings in money
- Planned versus emergency work
- Sites trending the wrong way
- Measured
- outcomes by site
- Output
- weekly operating report
- Aqueduct
- the numbers already reconciled
The operating metrics that compare sites fairly
Each metric is the same definition at every site, which is what makes a regional comparison meaningful.
| Metric | Definition | What it drives |
|---|---|---|
| Performance against baseline | Use against weather and history, per site | Where to look first |
| Open critical findings | Diagnosed faults on assets that stop operations | Crew allocation |
| Early warnings acted on | Condition alerts converted to planned work | Planned versus emergency mix |
| Verified closure rate | Closed items confirmed by data | Contractor and team accountability |
| Reopened items | Closures the data did not confirm | Quality of repair |
| Comfort compliance | Occupied time zones held in band | Whether savings cost comfort |
| Device health exceptions | Sensors with falling connection rate | Data you can trust next month |
Three habits that change across a region
Every closure is checked
A ticket is not done until flow, load, vibration or airflow is back in range. Repeat visits drop because problems are fixed once.
Every site works the same way
Different BMS vendors and meters still roll up into one data model in aQ Core, so procedures can be standardized.
Head office hears first
Exceptions surface centrally the same day, instead of arriving through a site email or a customer complaint.
sites in 21 countries run on Aqueduct.
and 9 clinics in one of India’s top hospital chains.
US airport running water intelligence on Aqueduct.
of commercial real estate under Aqueduct.
FMCG manufacturing campus.
operations run on Aqueduct.

Related
Common questions
It is software that gives operations leaders one view of asset health, losses and response across sites, and closes the loop on every fix. Aqueduct finds faults and early signs of failure, routes work into your CMMS and confirms each fix at the meter.
By catching faults and early signs of failure before they stop the operation. Aqueduct watches vibration, sound signature and energy drift to schedule maintenance first, and diagnoses faults with a recommended fix routed to your CMMS.
No. Aqueduct integrates with your CMMS. Technicians, inventory and work order workflows stay in the system you run; Aqueduct improves what goes in and verifies what comes out.
Yes. Aqueduct ranks sites on performance against a weather-normalized baseline and normalized intensity, with filters for sites that improved and sites that need attention. It is deployed in 275+ sites across 21 countries.
No. Milvian AI is a product company. Aqueduct does not provide facility staff or O&M contracts, and hardware installation runs through partners.
After the work closes, Aqueduct checks the meter or sensor against the baseline. Only when flow, load or airflow returns to range is the item verified, and that reading becomes the new baseline.
Every site is modeled in the same structure in aQ Core and measured with the same definitions. Rules and procedures that work at one site can be applied to others with site-specific limits.
It shows whether each closed item was confirmed by the data or reopened. Over time that gives a fair, evidence-based view of repair quality by contractor and site.
A fault is something already wrong, such as a fan that has stopped. An early warning is a trend, such as rising vibration or energy drift, that points to a failure that has not happened yet.
Telemetry refreshes every 60 seconds and findings appear in the portfolio view the same day. Notification routing follows your roles and your CMMS.
See Aqueduct on your own facility.
Bring a site, a utility bill or a question. We will show you where the loss is.