County water system loss control, pump stations and AWWA M36 audit data
County water system loss control means measuring how much water enters the network, how much reaches customers, and where the rest goes. Aqueduct reads SCADA, AMI and production meters alongside the systems the county runs, baselines night flow per district metered area, tracks pump station energy, and keeps the measured volumes the AWWA M36 water audit needs, while control stays with SCADA.
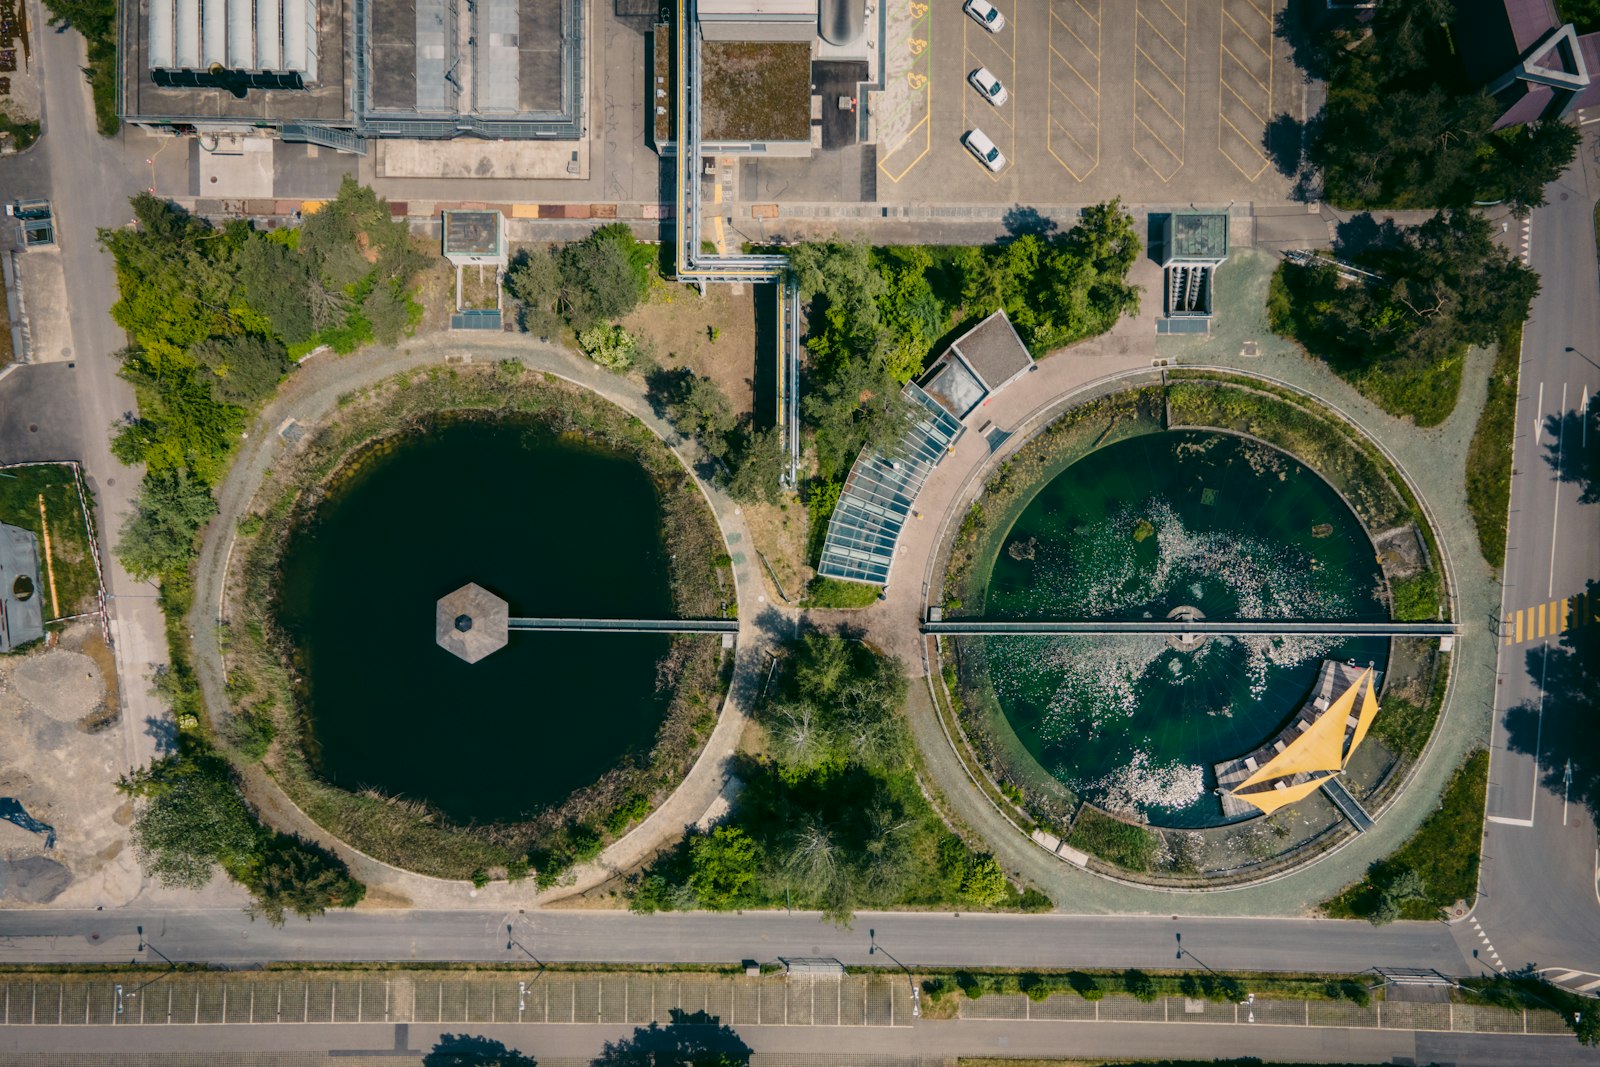
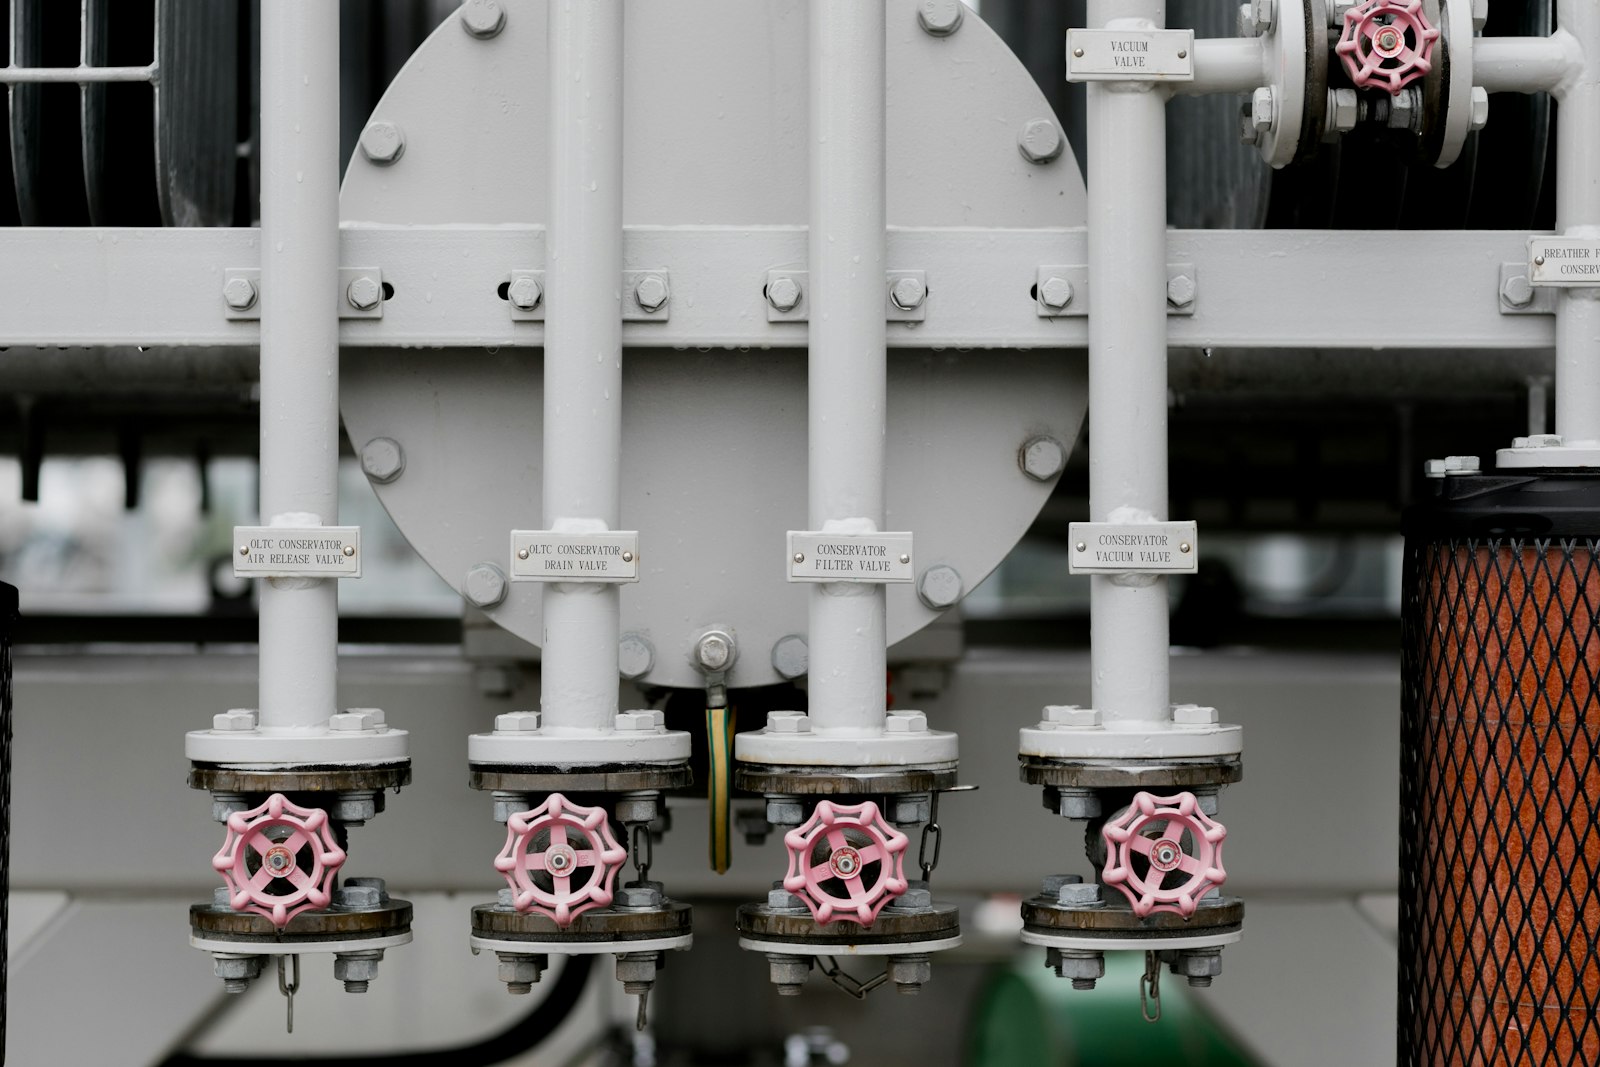
Every district balanced, every pump measured, and SCADA left in charge of control.
Real losses found per district, as they start
- Inlet metering
Each district metered area is balanced from its inlet meters against metered consumption.
- Night flow baselines
Minimum night flow per district is baselined, so a new leak shows as a rising floor.
- Loss priced
Lost volume is converted to cost from production and purchase rates, so districts are ranked by value.
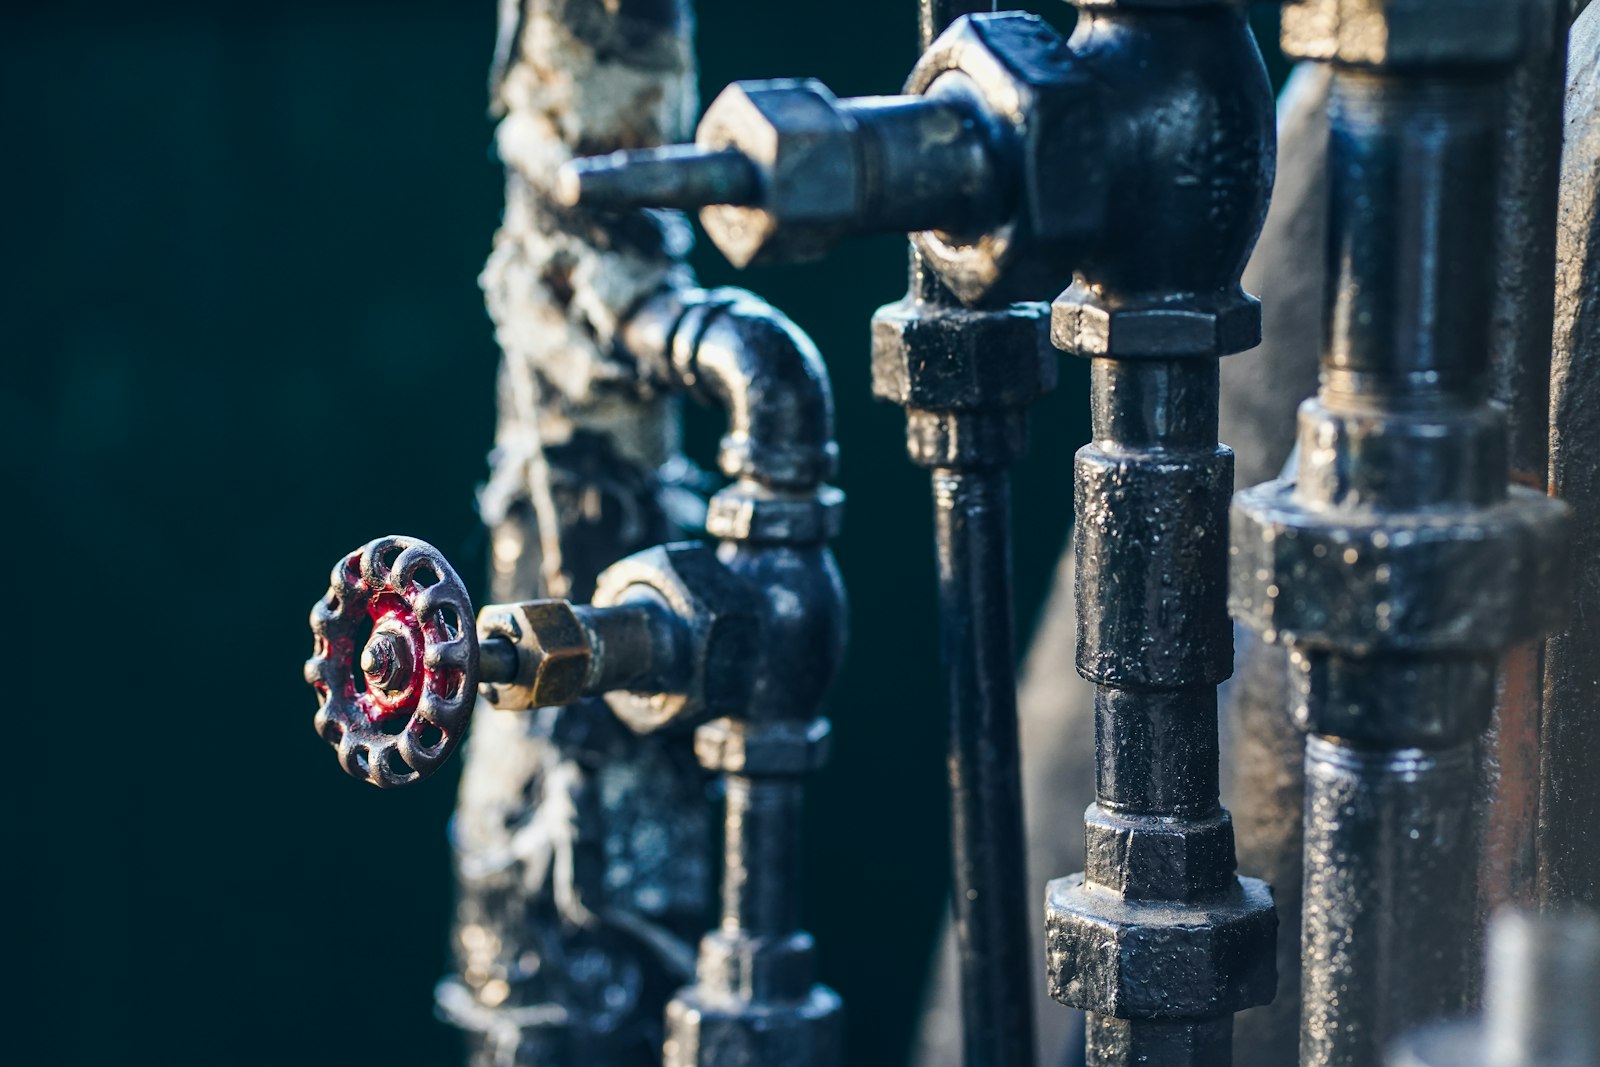
Pump and lift station energy measured against the water moved
- Energy per volume
Power and flow per station give energy per volume pumped, tracked over time.
- Early signs of failure
Rising energy for the same flow points to impeller wear or a stuck valve before failure.
- Peak demand
Station loads are shown against demand peaks, so pumping can be reviewed against tariffs.

Volumes and data quality ready for the AWWA M36 audit
- Volumes by period
System input, metered consumption and night flow are kept by period, with gaps flagged.
- Data validity
Coverage, connection rate and device health show the confidence behind each input.
- Council reporting
Verified repairs and recovered volumes are ready for council and grant reporting.

County water systems, before and after Aqueduct
- Real losses appear once a year in the annual audit.
- A pump wearing out shows up first on the power bill.
- SCADA, AMI and work orders each hold part of the picture.
- Audit inputs are gathered by hand at the deadline.
- Repairs are closed without checking the loss stopped.
 The Aqueduct way
- Night flow per district flags real losses as they start.
- Energy per volume pumped flags wear before failure.
- One data layer joins SCADA, AMI and your CMMS.
- Audit volumes and data quality are kept by period.
- The district balance confirms each repair worked.
What county water and sewer systems are up against
County systems are often rural, spread out and run by small crews, with infrastructure laid down over decades.
Loss found at audit time
Real losses on mains and service lines show up in the annual audit, months after they started.
Meters that under-read
Aging customer and production meters make apparent losses hard to separate from real ones.
Pump stations unwatched
Pumps run harder as impellers wear and valves stick, and the electricity bill is the first sign.
Data in separate systems
SCADA, AMI, billing and work orders each hold part of the picture, and nobody joins them.
What the water audit needs, and what Aqueduct supplies
The AWWA M36 method balances system input against authorized consumption and losses. Your team or auditor completes and validates the audit.
| Audit component | What it is | What Aqueduct supplies |
|---|---|---|
| System input volume | Water produced and imported into the network, corrected for meter error | Production and import meter volumes by period, with gaps flagged |
| Authorized consumption | Billed and unbilled metered and unmetered use | Metered consumption from AMI and customer meters by period |
| Apparent losses | Customer meter under-registration, data handling errors and unauthorized use | Meter performance trends and data quality scoring on each point |
| Real losses | Physical leakage from mains, service lines and storage | Night flow per district metered area and the trend over time |
| Data validity | Confidence in each input | Coverage, connection rate and device health for every meter |
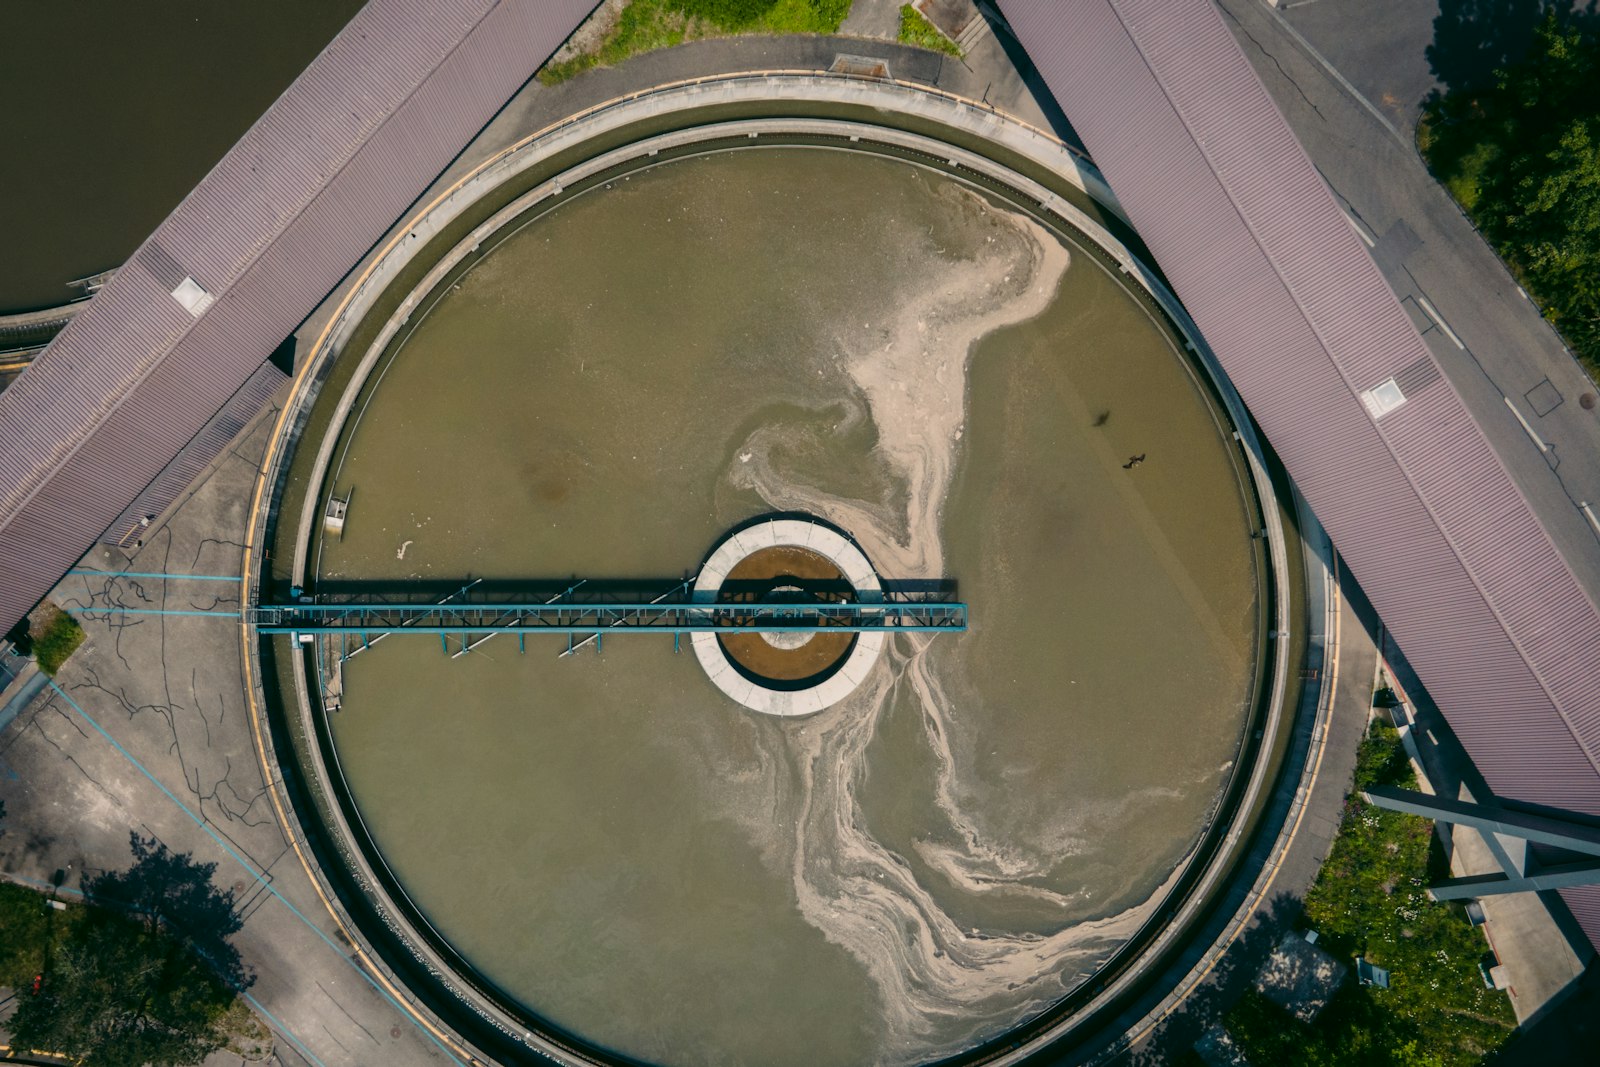
How Aqueduct runs a county water system
Monitor, Measure, Identify, Act, Verify, alongside the SCADA the county already runs.
Read what exists
SCADA, AMI, production meters and pump station panels are read into aQ Core. Control stays with SCADA.
Set up districts
District metered areas are defined with their inlet meters, so each district has its own balance.
Baseline night flow
Minimum night flow per district is baselined, so a rise in real losses stands out as it starts.
Route the field work
A rising district goes to your crew or leak detection contractor with the area and trend, through your CMMS.
Verify and report
After repair, night flow returns to baseline. Volumes are kept for the annual audit and for council reports.
Problem, solution, impact
Where county water and public works pay back.
Real losses found once a year in the audit.
Night flow baselined per district metered area.
Leaks found as they start, with the repair confirmed by the district balance.
Pump stations drawing more power for the same water.
Energy per volume pumped tracked per station.
Worn pumps and stuck valves found before the bill and the failure.
SCADA, AMI and work orders never joined.
One data layer with tickets routed to your CMMS.
Crews sent to a district with evidence, and the result measured.
Where teams put it to work

Long mains with small crews
District night flow points the crew to the area losing water, so a small team spends its time on the right section of main.
Learn more
Stations watched between visits
Power, run hours and flow per station are tracked between visits, so wear and stuck valves are found before a station fails.
Learn more
M36 inputs kept all year
Production, consumption and night flow volumes are kept by period with data quality, ready for your team or auditor.
Learn moreRelated
Common questions
AWWA M36 is the American Water Works Association manual for water audits and loss control. It balances the water a system puts in against authorized consumption, apparent losses and real losses, and grades the validity of each input. Aqueduct supplies the measured volumes and data quality the audit draws on.
No. Aqueduct supplies metered volumes, data coverage and meter performance trends. Your team or a qualified auditor completes and validates the AWWA M36 audit and files it where your state requires.
A district metered area, or DMA, is a section of the network with metered inlets and outlets, so its inflow can be compared with use. Minimum night flow in a DMA is a reliable indicator of real losses. Aqueduct baselines it per district.
No. Aqueduct works alongside SCADA. It reads SCADA and AMI data, and control of pumps, valves and treatment stays with SCADA.
Yes. Aqueduct reads pump station panels and meters for power, run hours and flow, tracks energy per volume pumped and flags pumps drawing more power for the same water, an early sign of wear or a stuck valve.
No. The same platform covers county buildings such as courthouses, jails and offices. A county can run its water system and its buildings on one data layer, with separate views for each team.
Yes. Aqueduct can run in the AWS cloud or on-prem, with on-prem AI on NVIDIA infrastructure, for agencies that keep operational data on their own network.
See Aqueduct on your own facility.
Bring a site, a utility bill or a question. We will show you where the loss is.