CIP water monitoring and a live process water balance for dairy plants
CIP water monitoring measures the water, chemicals and energy every clean-in-place cycle uses, per circuit and per step. Aqueduct reads CIP skid data alongside plant SCADA, baselines each cycle, flags cycles that use more than they should, and places CIP inside a live process water balance from source to discharge, so reuse of rinse water and condensate is measured, not assumed.
Every clean measured per cycle, every litre reused counted, every loss given an address.
Each CIP circuit measured against its own expected cycle
- Water per step
Pre-rinse, caustic, intermediate rinse, acid and final rinse volumes are tracked for every cycle on every circuit.
- Chemical and heat
Caustic and acid dosing and the steam behind hot washes are counted beside the water they travel with.
- Drift flagged early
A cycle running longer or using more water than its baseline is flagged with the step where it changed.
Process water balanced from source to discharge every interval
- Source to drain
Borewell, municipal and treated water are reconciled against CIP, process, boiler feed and discharge on one twin.
- Unaccounted loss
Water that does not reconcile to a metered use is tracked as loss, priced and narrowed to a line.
- Night and idle flow
Flow when lines are idle or between shifts shows overflows, leaks and taps left running.
Rinse recovery and condensate reuse reported from real volumes
- Recovery tanks
Level and diversion data show how much final rinse water returns for the next pre-rinse and how much overflows.
- Condensate and cow water
Evaporator condensate and treated cow water are metered into the balance where they are reused.
- Report ready
aQ Assurance keeps withdrawal, reuse and discharge records for your sustainability team to report and file.
CIP and process water, before and after Aqueduct
- CIP water hides behind one supply meter for the whole plant.
- A valve that does not seat wastes water on every cycle.
- Reuse figures come from the design drawings, not the meters.
- Water, chemical and steam costs of a clean are never added up.
- Overflow to drain is noticed when someone walks past the tank.
 The Aqueduct way
- Each CIP circuit is measured per cycle and per step.
- The drifting cycle is flagged with its step and circuit.
- Reuse is reported from metered recovery and condensate volumes.
- Every clean carries one cost for water, chemical and heat.
- Recovery tank overflow appears on the live balance as it happens.
Why CIP is the water line nobody can see
Cleaning is not optional in a dairy. How much water, chemical and heat each clean takes usually is.
One meter for the whole plant
CIP, process, boiler feed and washdown all sit behind one supply meter, so nobody can say what a single clean costs.
Cycles that drift
A valve that does not seat, a longer rinse or a sensor out of calibration adds water to every cycle without anyone noticing.
Reuse on paper
Final rinse recovery, cow water from evaporators and condensate return are in the design, but nobody measures how much is actually reused.
Volume, not cost
Water, caustic, acid, steam and effluent load are counted separately, so the full cost of one clean is never added up.
What Aqueduct measures for each CIP cycle
Read from the CIP skid PLC and plant SCADA where the data exists, with flow, conductivity and temperature added through partners where it does not.
| Step | Measured | What it tells you |
|---|---|---|
| Pre-rinse | Water volume, source (fresh or recovered), duration | How much recovered rinse water is actually used before fresh water |
| Caustic wash | Volume, temperature, conductivity, make-up chemical dosing | Chemical and heat use per clean, and whether strength is held |
| Intermediate rinse | Volume and return conductivity | Whether rinsing stops when the line is clean or runs on a fixed timer |
| Acid wash | Volume, temperature, conductivity, dosing | Acid use per circuit and per week |
| Final rinse and recovery | Volume, recovery tank level, diversion to drain | How much final rinse water goes back to the recovery tank |

How Aqueduct runs the CIP and process water loop
Monitor, Measure, Identify, Act, Verify. Process recipes and food safety validation stay with your team.
Model the water system
Source, treatment, storage, CIP circuits, process lines, boiler feed and discharge are built block by block on the water digital twin.
Baseline every circuit
Each CIP circuit gets an expected water, chemical and duration profile per cycle, compared with production and line type.
Flag the outliers
A cycle using more water than its baseline, or a recovery tank that keeps overflowing to drain, is flagged with the step and the circuit.
Route the fix
A ticket goes to your CMMS with the evidence and a recommended check, such as a valve not seating. Recipe changes stay with your validated process.
Verify at the meter
The next cycles confirm water and chemical use back on baseline. The verified result becomes the new baseline.
Problem, solution, impact
Where CIP and process water monitoring pays back.
CIP and process water hidden behind one supply meter.
A live water balance per line, with CIP measured per cycle and per step.
Each clean has a volume and a cost, and drifting cycles are found in days.
Hot caustic and rinse water heated, then sent to drain.
Steam and hot water per cycle tracked beside water use.
The heat cost of every clean is counted with its water cost.
Reuse figures quoted from the design, not the plant.
Recovery tanks, condensate and cow water metered into the balance.
Reuse reported from measured volumes your team can defend.
Where teams put it to work
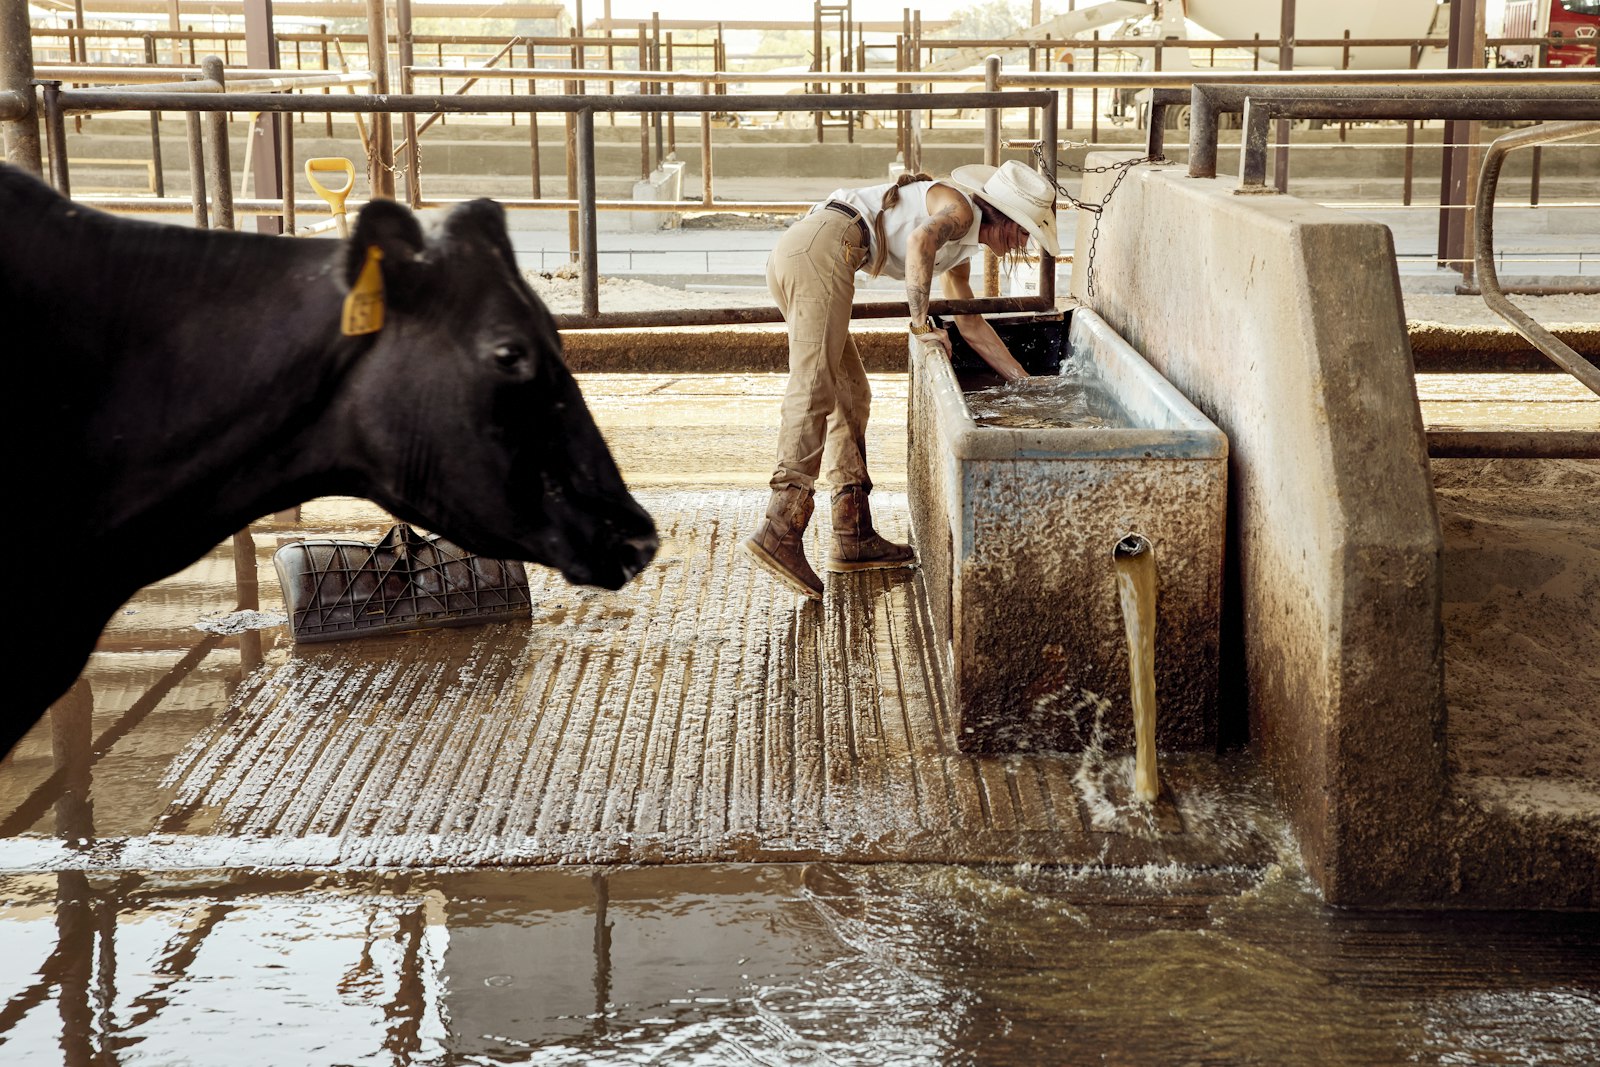
Tankers, silos and pasteurizer circuits
Tanker bay and silo CIP circuits are baselined per cycle, so the plant sees which circuits use the most water per clean and why.
Learn more
Condensate and cow water reused
Evaporator condensate and recovered cow water are metered into the balance, so reuse in boiler feed, cooling or cleaning is measured, not estimated.
Learn more
Comparing plants on water per litre
Plants are ranked on water use per litre of milk handled, so a small intense plant cannot hide behind a large one.
Learn moreRelated
Common questions
CIP, or clean-in-place, is the automated cleaning of tanks, pipes and process equipment without taking them apart, usually through rinse, caustic, rinse, acid and final rinse steps. It is one of the largest water, chemical and heat users in a dairy, which is why Aqueduct measures it per cycle.
Start by measuring each circuit per cycle and per step, then compare cycles against a baseline. Common findings include rinses running on fixed timers, valves not seating and recovered rinse water going to drain. Aqueduct flags these with the step and circuit, and your team decides the change.
No. CIP recipes and food safety validation stay with your team and your CIP supplier. Aqueduct reads the skid and SCADA data, finds cycles that use more than their baseline and routes the evidence to the people who own the recipe.
A process water balance accounts for every source of water against every use, reuse and discharge, so supply equals use plus loss. Aqueduct renders it live on the water digital twin, updated every 60 seconds from telemetry, so unaccounted loss shows up as it starts.
Yes. Final rinse recovery, evaporator condensate and treated water reuse are metered into the same balance as fresh water, so reuse is reported from measured volumes rather than design figures.
Yes, where production data is shared. Aqueduct divides measured water use by intake or output for the same period, so sites and lines can be compared on intensity rather than total volume.
Yes. Aqueduct reads plant SCADA, historians and PLCs read only. Process control stays where it is, and Aqueduct adds the water balance, baselines and evidence on top.
See Aqueduct on your own facility.
Bring a site, a utility bill or a question. We will show you where the loss is.