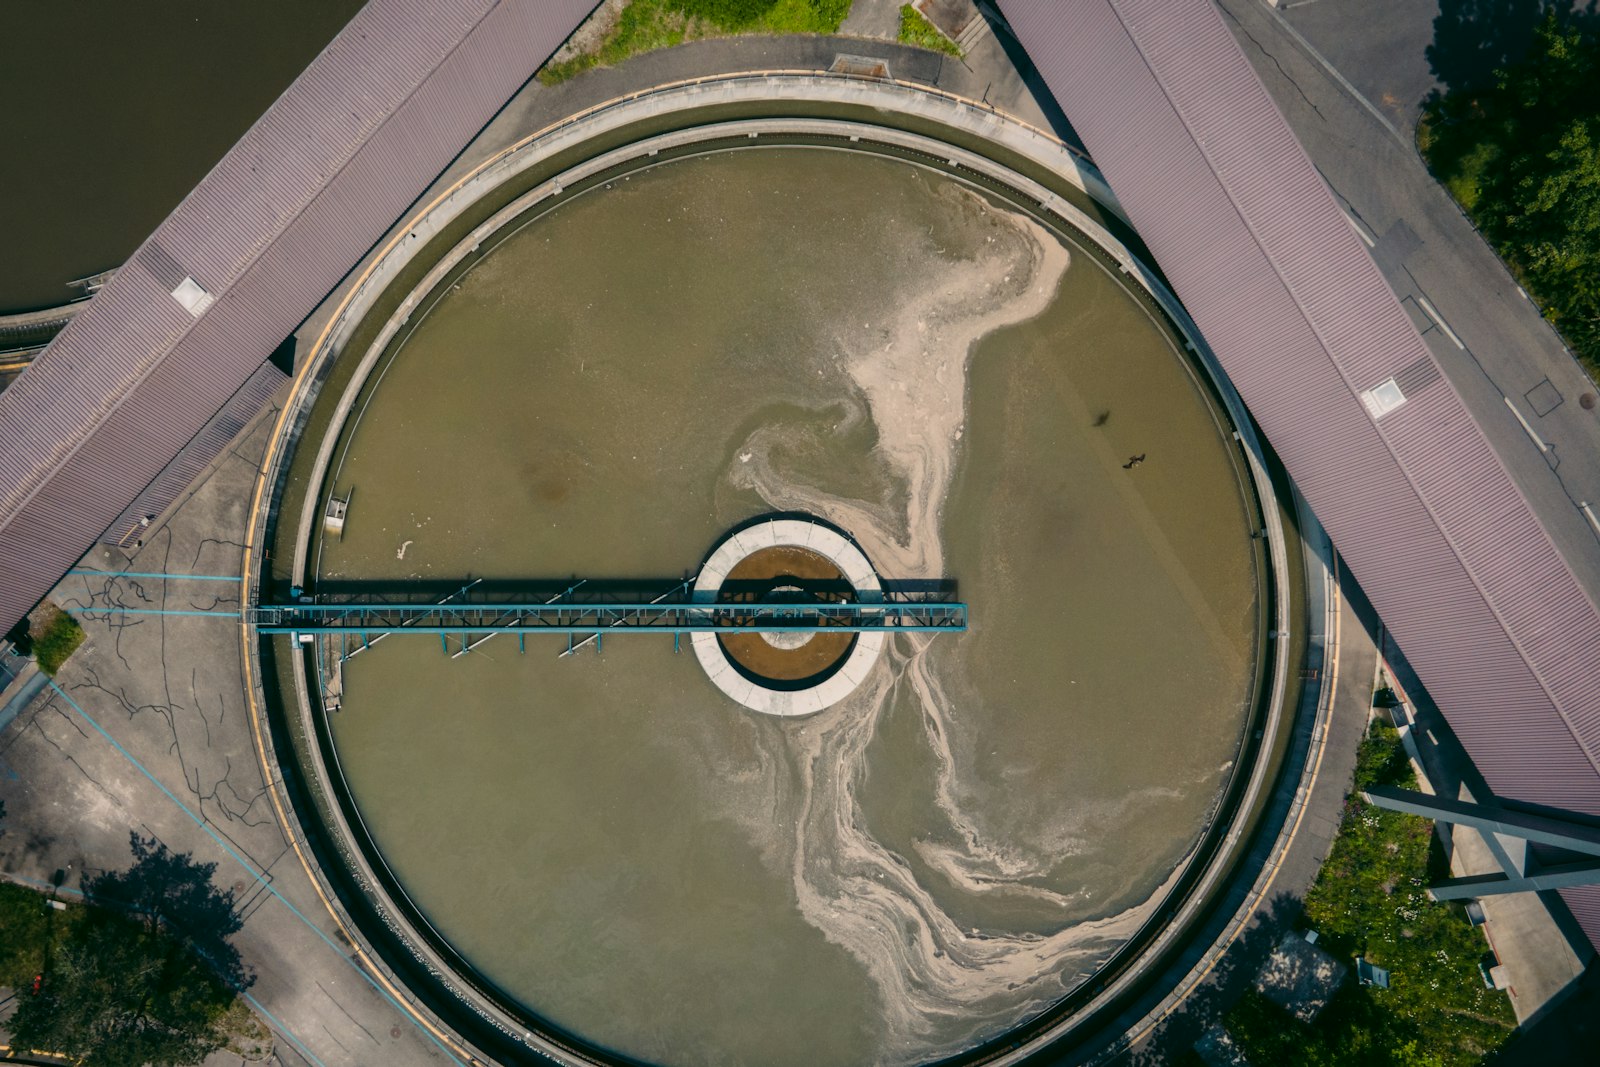
Dairy ETP monitoring, from effluent inflow to treated discharge
Dairy ETP monitoring measures effluent inflow, load, treatment performance and discharge continuously instead of by daily grab sample. Aqueduct reads flow, pH, temperature, dissolved oxygen and BOD or COD from online analyzers or lab results, links load spikes to the CIP cycle or product loss upstream, tracks sludge, and keeps a continuous evidence record for your team to report to the regulator.
Effluent load traced to its source, treatment measured hour by hour, discharge on record.
Effluent spikes traced back to the line that caused them
- Inflow load by hour
Flow and organic load at the equalization tank are tracked continuously instead of once a day.
- Events lined up
CIP cycles, changeovers and line stops from plant SCADA are placed on the same time line as ETP inflow.
- Source named
A spike that follows one circuit or event is routed to the process team that owns it.
Aeration energy and treatment efficiency measured against load
- Treatment efficiency
Inlet and outlet quality give a running view of how well each stage performs, as the twin does for an STP.
- Aeration energy
Blower power is baselined against organic load and dissolved oxygen, so over-aeration at night shows up.
- Sludge tracked
Sludge volume and dewatering hours are tracked per unit of load treated, so changes in yield are visible.
A continuous record of what left the site and where
- Discharge and reuse
Treated water to reuse and to discharge are metered into the site water balance every interval.
- Deviations with closure
Each excursion is recorded with its cause, the response and the time it closed.
- Ready to file
aQ Assurance exports the record for any period. Your team or consultant reports to the regulator.

Dairy effluent, before and after Aqueduct
- A daily grab sample stands in for the whole day.
- Load spikes arrive at the ETP with no known source.
- Blowers run at fixed speed whatever the organic load.
- Sludge and chemical use are tracked in a separate logbook.
- Regulator reports are compiled from logbooks at the deadline.
 The Aqueduct way
- Flow and quality form a continuous record between lab samples.
- Each spike is lined up with the CIP or line event upstream.
- Aeration energy is baselined against load and dissolved oxygen.
- Sludge and dosing sit on the same record as flow.
- The evidence record exists before anyone asks for it.
Why the ETP is where dairy losses surface last
Milk solids, fats and cleaning chemicals that leave the process end up at the effluent plant. Most dairies see them there only as a treatment problem.
Load spikes with no source
A COD spike arrives at the equalization tank, and nobody can say whether it came from a CIP dump, a spill or a product changeover.
Grab samples, not a record
Daily lab samples show a point in time. The hours between samples are where shock loads and bypass risks sit.
Aeration running blind
Blowers run at fixed speed whatever the load, which wastes power at night and starves the biology at peak.
Evidence gathered at deadline
Consent and disclosure reports are compiled from logbooks when the request arrives, not drawn from a continuous record.
What Aqueduct measures across a dairy ETP
Online analyzers and meters are read where they exist. Lab results can be uploaded against the same time line.
| Stage | Measured | What Aqueduct derives |
|---|---|---|
| Inflow and equalization | Flow, pH, temperature, tank level | Hydraulic and organic load by hour, linked to upstream events |
| Fat removal and DAF | Flow, chemical dosing, float removal | Dosing per unit of flow and fat recovered |
| Biological treatment | Dissolved oxygen, blower kW, MLSS where measured | Aeration energy per unit of load and DO held against target |
| Clarifier and sludge | Sludge volume, dewatering run hours, cake weight where recorded | Sludge produced per unit of load treated |
| Treated water and reuse | Outlet flow, BOD, COD, TSS, pH from analyzers or lab | Treatment efficiency, reuse volume and discharge volume |
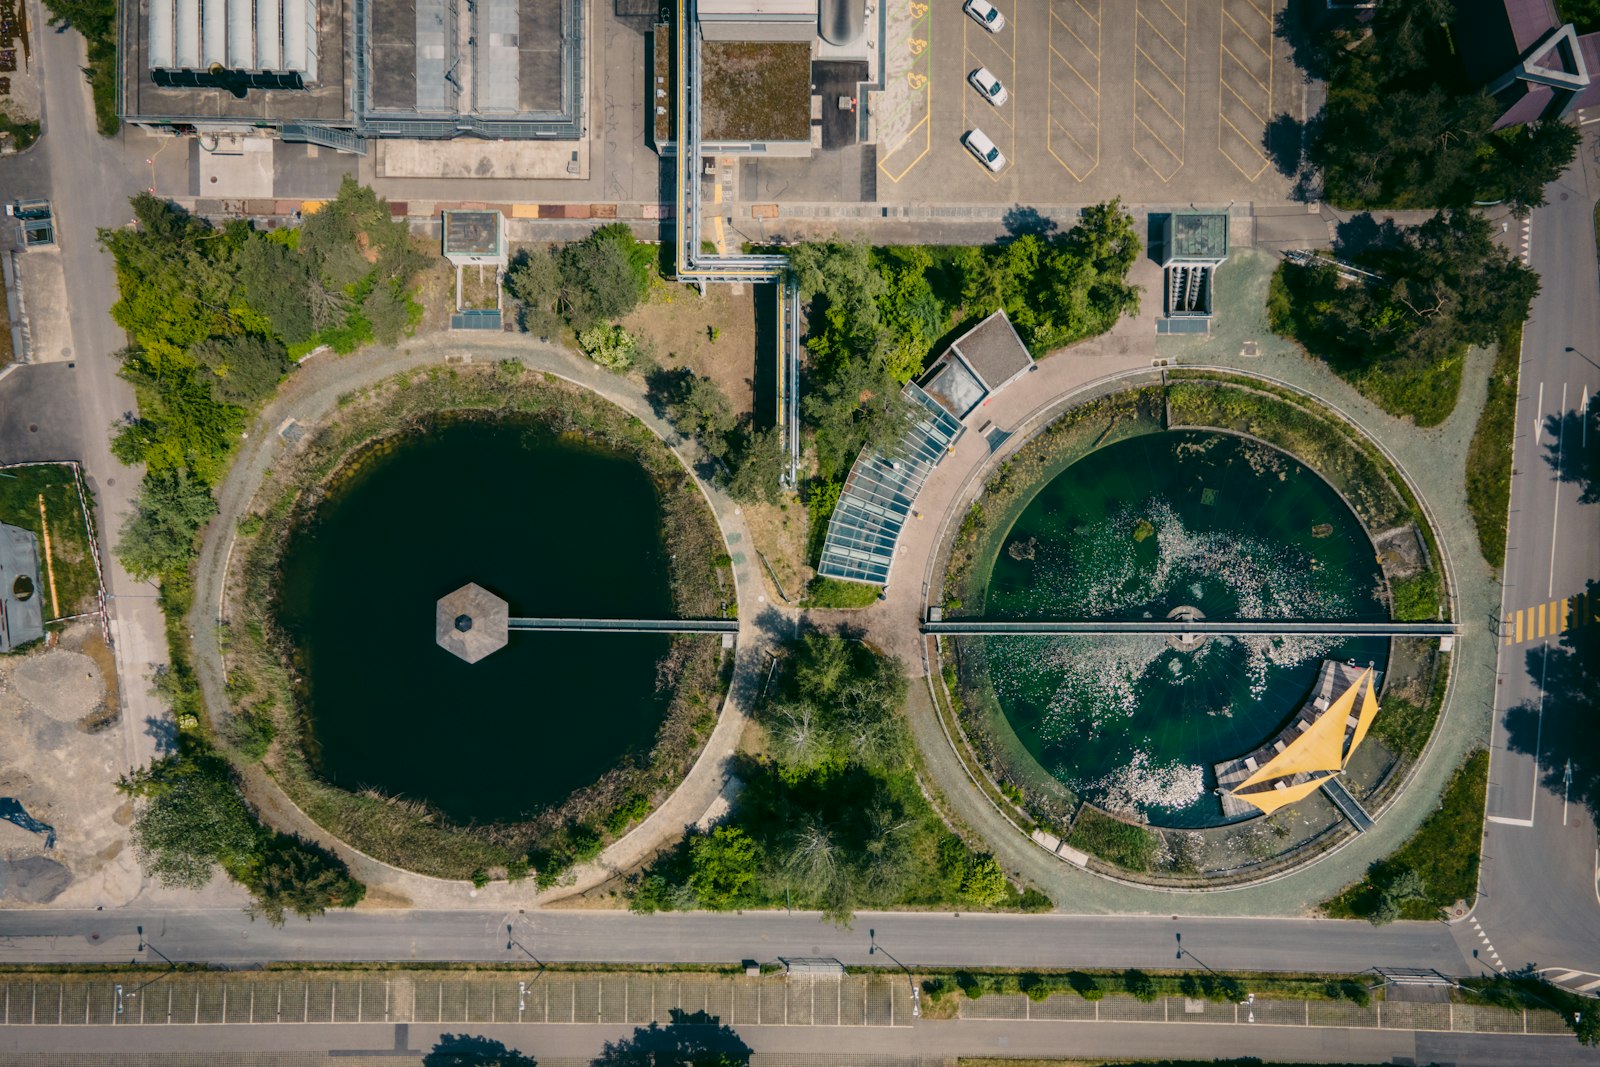
How ETP monitoring works in Aqueduct
The same loop as every other utility: Monitor, Measure, Identify, Act, Verify.
Connect the plant
Flow meters, analyzers, blower panels and the ETP PLC report into aQ Core. Gaps are filled through installation partners.
Baseline load and treatment
Inflow load, aeration energy and outlet quality are baselined by hour, day and production level.
Trace the spike
A load spike is matched against CIP cycles, changeovers and line events upstream, so the source has a name.
Act upstream and in the plant
Tickets go to the process team for the source and to the ETP operator for the treatment response, through your CMMS.
Keep the record
aQ Assurance keeps inflow, treatment and discharge as a continuous record. Your team or consultant files with the regulator.
Evidence your effluent reporting draws on
Aqueduct supplies measured data. Your team or your consultant files and certifies. Check the current rule for your site.
Where teams put it to work

Product losses caught before they upset biology
A milk or whey loss to drain shows up as a load spike, lined up with the event that caused it, so the process team can act the same shift.
Learn more
Treated water put back to work
Treated effluent sent to cooling tower make-up or washing is metered into the balance, so reuse claims rest on measured volumes.
Learn more
Effluent data ready for annual reporting
Withdrawal, discharge and reuse are kept as one timestamped record that your sustainability team draws on for BRSR and other disclosures.
Learn moreRelated
Common questions
An effluent treatment plant, or ETP, treats the wastewater a dairy produces from cleaning, product losses and process water before it is discharged or reused. It usually includes equalization, fat removal, biological treatment, clarification and sludge handling.
Dairy effluent carries milk solids, fats, lactose and cleaning chemicals, which give it a high organic load measured as BOD and COD. Product losses and CIP dumps are common causes of load spikes, which is why Aqueduct links ETP load to events upstream.
Aqueduct reads BOD, COD, TSS and pH from online analyzers where they are installed, and accepts lab results on the same time line where they are not. Either way, the values sit beside flow and load on one record.
It lines up ETP inflow load with CIP cycles, changeovers and line events from plant SCADA. When a spike follows a specific circuit or event, the ticket names it and goes to the process team that owns it.
No. Aqueduct supplies a continuous measured record of inflow, treatment and discharge, with deviations and their closure. Your team or your environmental consultant reports to the regulator and certifies compliance.
Aqueduct baselines blower energy against organic load and dissolved oxygen, and flags hours where aeration runs well above what the load needs. Where control is enabled, with owner approval, blower schedules can be adjusted, with every command logged.
Many dairies reuse treated water for non-product uses such as cooling tower make-up, gardening or floor washing, depending on local rules and treatment quality. Aqueduct meters that reuse into the water balance so it is reported from measured volumes.
See Aqueduct on your own facility.
Bring a site, a utility bill or a question. We will show you where the loss is.