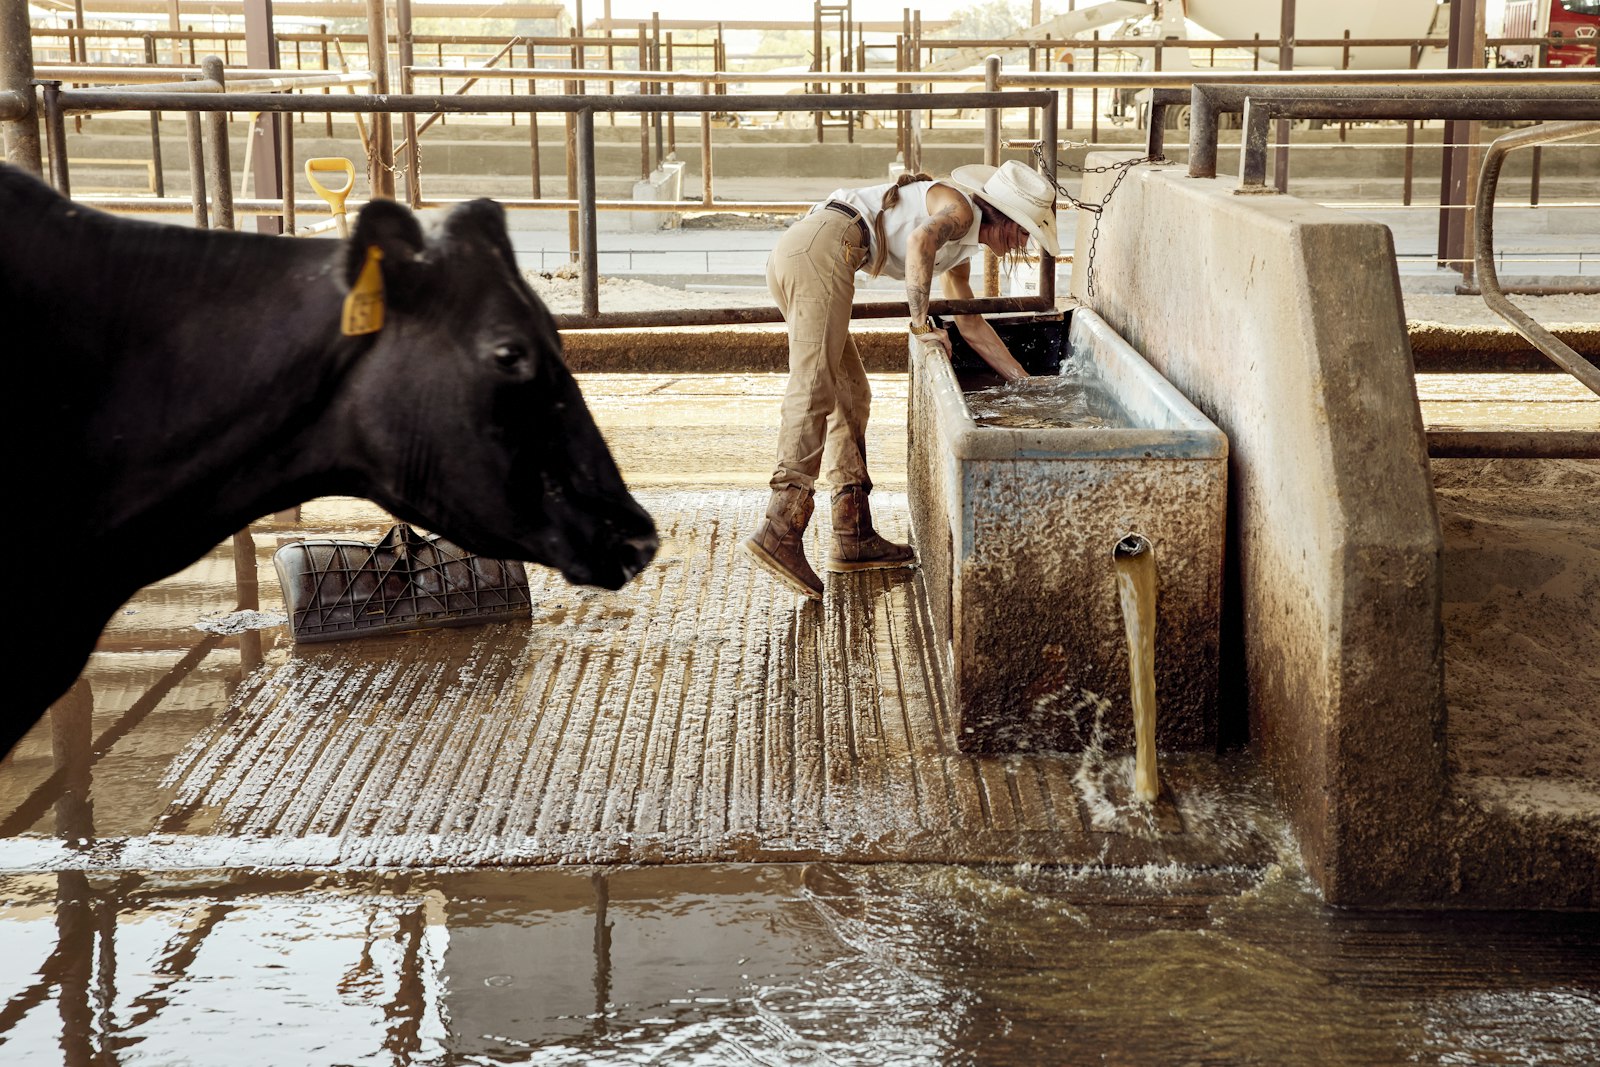
Dairy refrigeration monitoring, from the ammonia plant to the cold room
Dairy refrigeration monitoring means measuring every compressor, condenser, chiller and cold room against the cooling it actually delivers. Aqueduct reads pressure, temperature, condenser water flow and matched electrical input, works out kW per TR and COP under similar conditions, flags poor heat removal and early signs of failure, and keeps a continuous temperature record for every cold room and milk silo.
Every compressor, condenser and cold room measured against the cooling it actually delivers.
kW per TR and COP measured for each refrigeration group
- Matched electrical input
Compressor, pump and fan power are tied to the cooling each group delivers, not to a nameplate figure.
- Like for like comparison
Efficiency is compared under similar milk intake, weather and duty, so a hot week does not hide a fault.
- Load sharing visible
Part loaded compressors running together show up, so sequencing can be reviewed with the plant engineer.
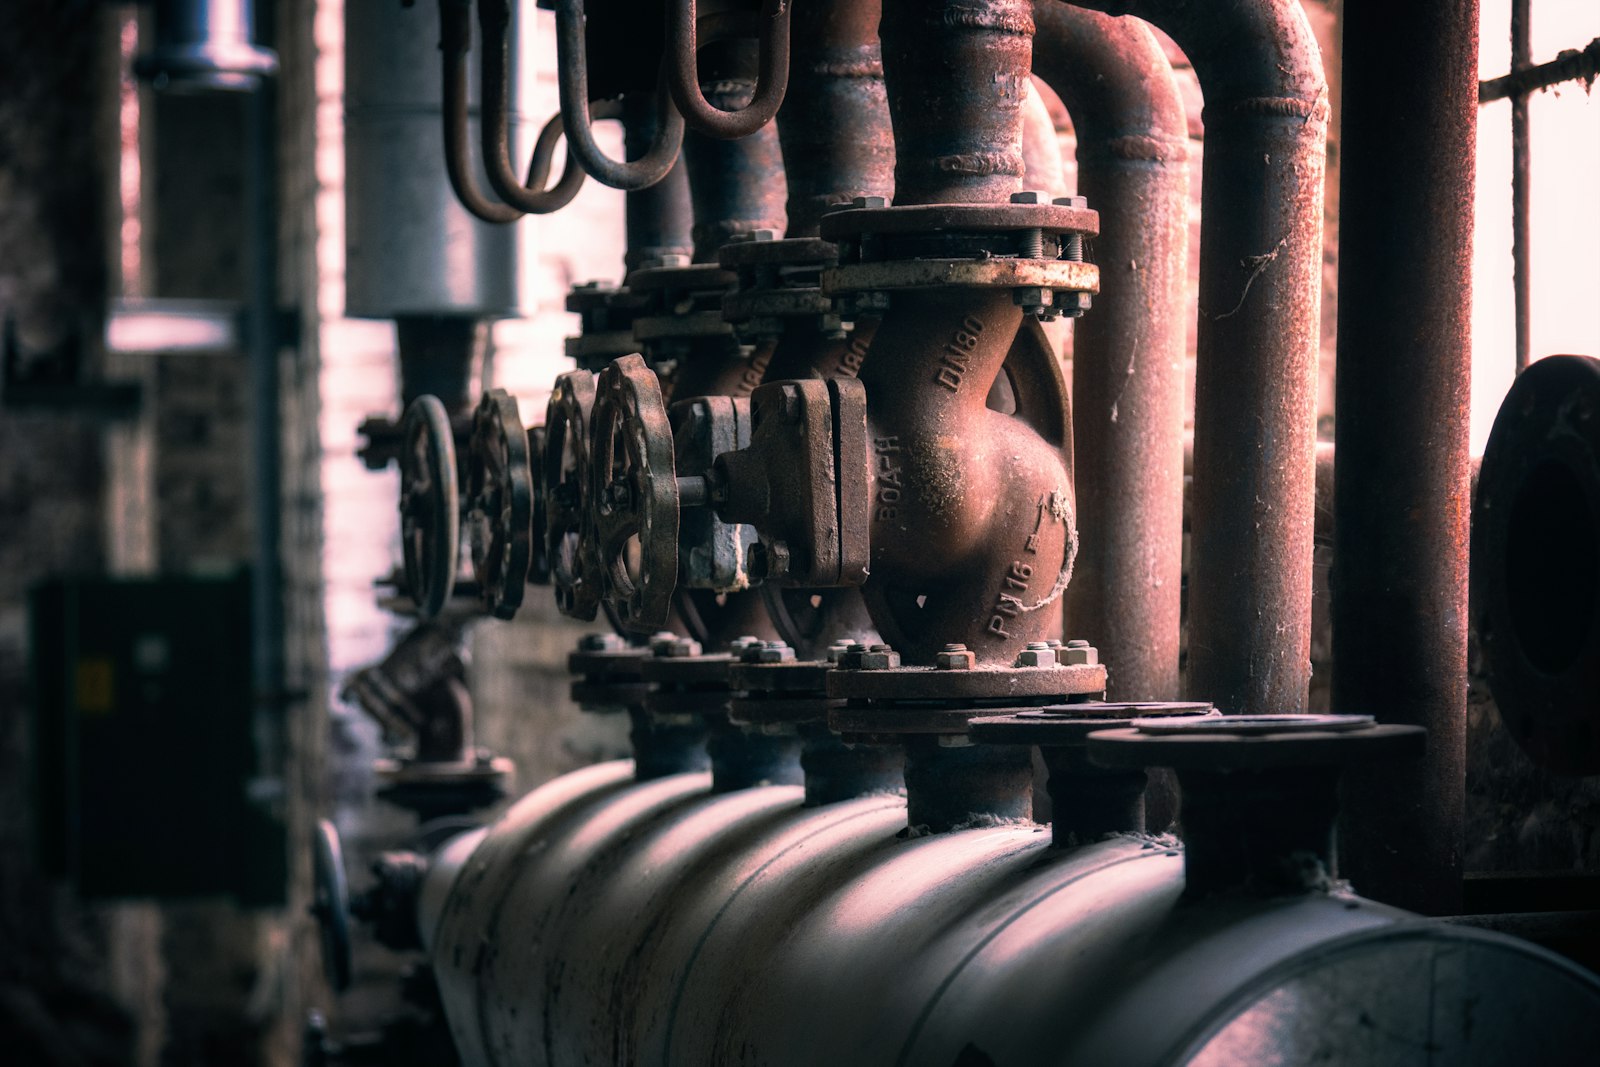
Condenser problems caught before compressors pay for them
- Pressure and power together
Rising discharge pressure and power at flat cooling output flags poor heat removal early, before a high pressure trip.
- Recommended checks
Aqueduct recommends checking condenser water flow, fills and spray nozzles, and the engineer confirms the cause on site.
- System energy counted
Any added pumping or fan load from the fix is counted, so the verified saving is the real net saving.
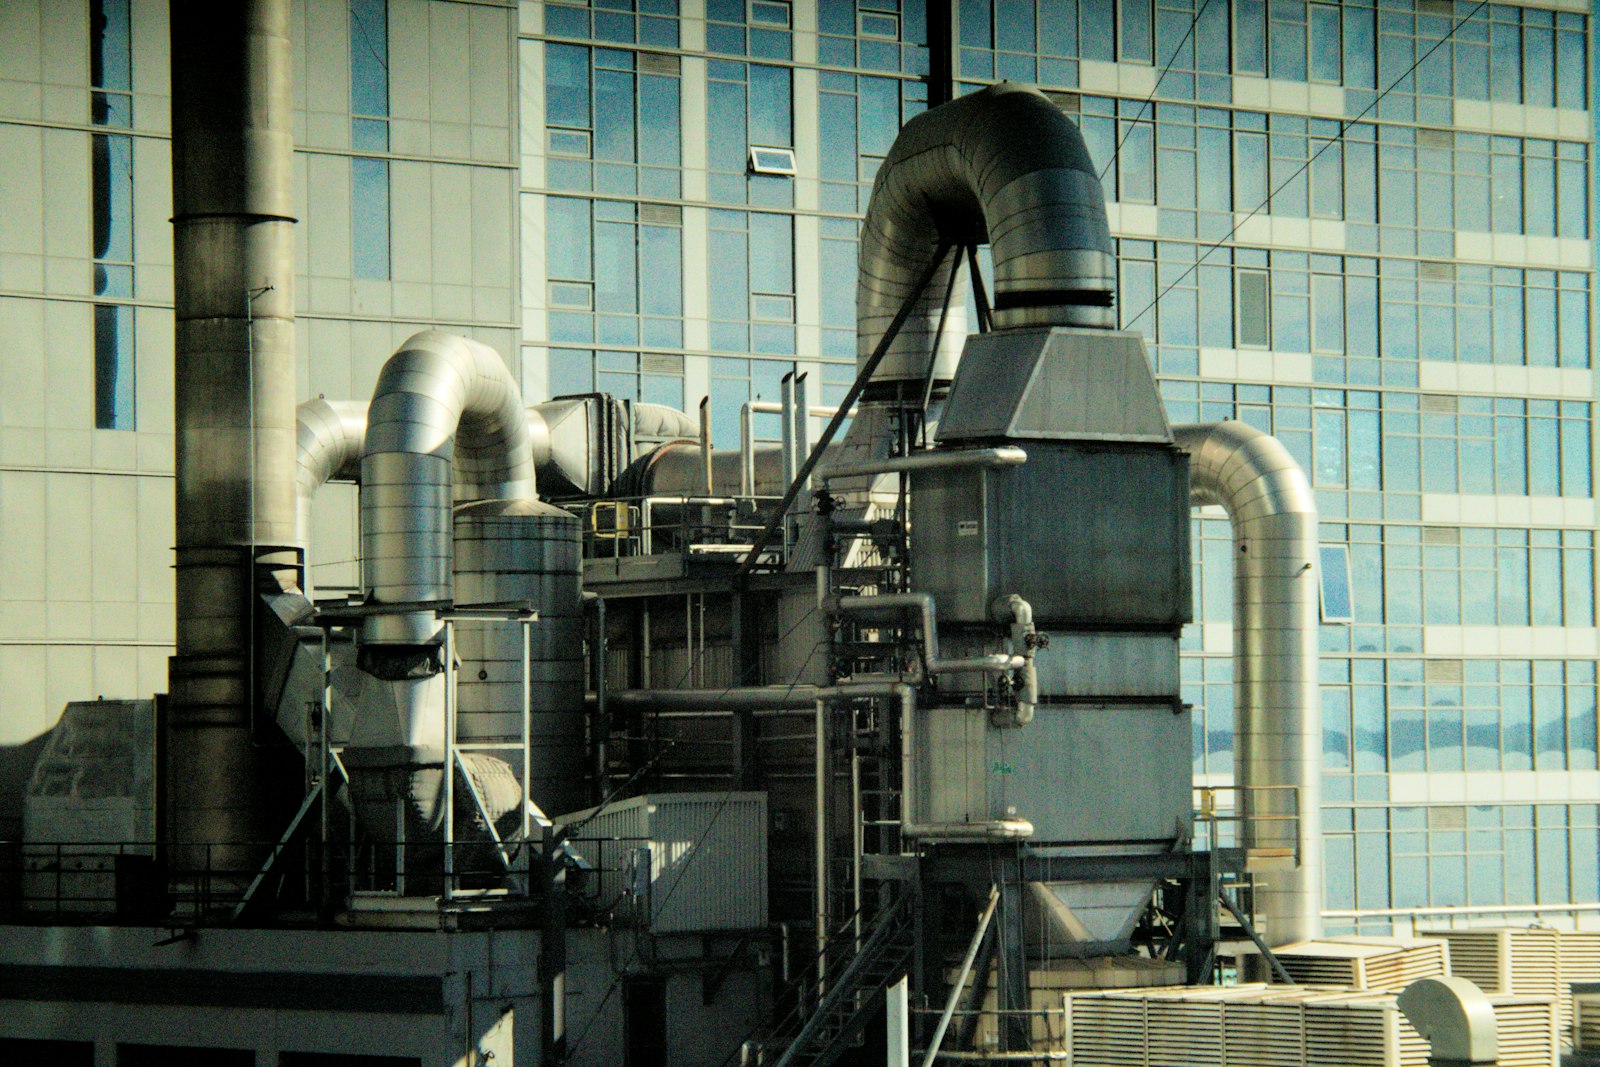
Cold rooms and silos on one continuous temperature record
- Every excursion kept
Each excursion is recorded with start time, duration and peak, then linked to the plant group serving that room.
- Early signs of failure
Compressor vibration, sound signatures and energy drift schedule maintenance before cooling capacity is lost.
- Ready for review
aQ Assurance exports the record for any period, so your quality team or auditor can review and file it.
Dairy refrigeration, before and after Aqueduct
- Plant efficiency is a nameplate figure nobody has measured recently.
- A fouled condenser shows up as a bigger electricity bill.
- Compressors run part loaded together because sequencing was never reviewed.
- A compressor failure is the first warning the plant gets.
- Cold room records are logbook entries taken between rounds.
 The Aqueduct way
- kW per TR is measured every interval for each refrigeration group.
- Rising pressure at flat cooling flags poor heat removal early.
- Load sharing across the group is visible and reviewed with engineers.
- Vibration and energy drift schedule maintenance before the failure.
- Every cold room keeps a continuous record with each excursion.
What Aqueduct measures in a dairy refrigeration plant
Existing plant SCADA, PLC and meter data is read first. New sensing goes in through partners only where the plant is blind.
| Equipment | Measured | What Aqueduct derives |
|---|---|---|
| Ammonia screw and reciprocating compressors | Suction and discharge pressure, discharge temperature, motor kW and kWh, run and load state, vibration | Energy per unit of cooling, load sharing across the group, early signs of failure |
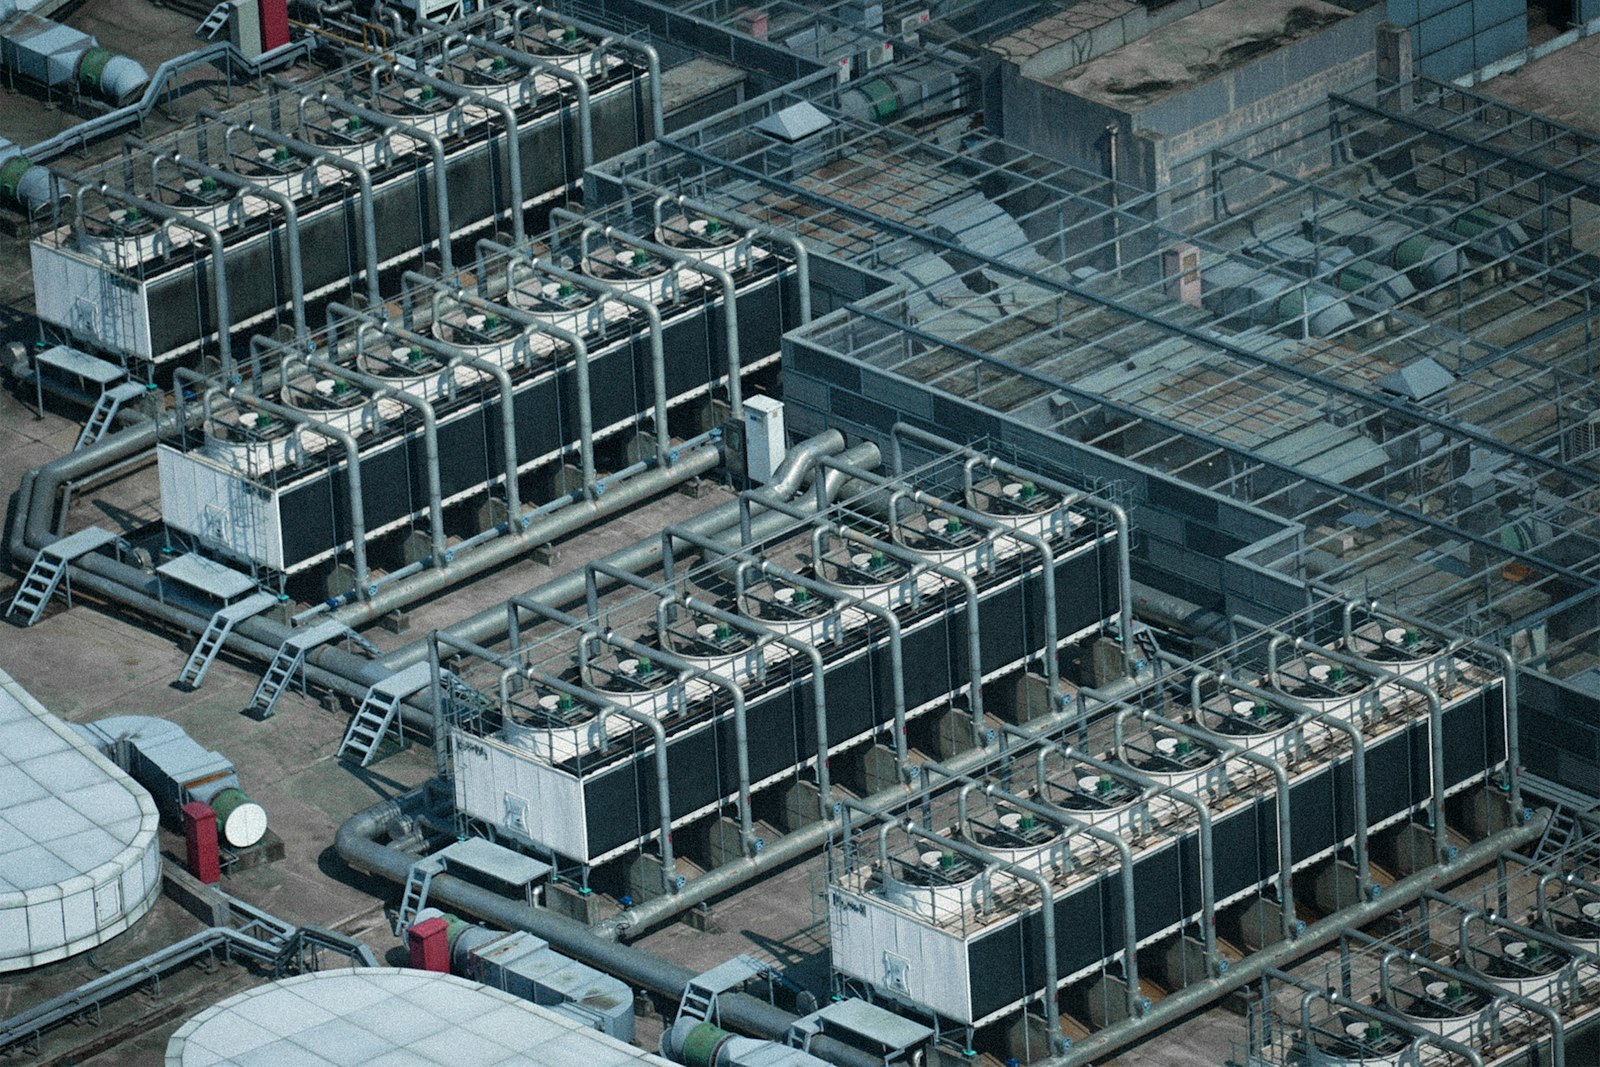
| Evaporative condensers and cooling towers | Condenser water flow, inlet and outlet temperature, fan and pump power, make-up water | Heat removal performance and the pumping and fan energy that goes with it |
| Chillers, ice banks and glycol loops | Supply and return temperature, flow, BTU meter readings, ice bank level where fitted | Cooling delivered in TR, COP and kW per TR, ice build against the milk intake plan |
| Cold rooms and milk silos | Room and product temperature, humidity, door open time where sensed | Excursions with time and duration, linked to the plant group that serves the room |
| Plant rooms | Ammonia detector readings, ventilation fan status | A shared record beside the site safety system, which keeps its own alarms and shutdowns |
Where dairy refrigeration loses money quietly
Refrigeration is often the largest electrical load in a dairy, and most of its waste never trips an alarm.
Fouled condensers
Scale on the condenser or low condenser water flow pushes discharge pressure up, and every compressor works harder for the same cooling.
Compressors fighting each other
Several machines run part loaded instead of a few running well loaded, because sequencing was set once and never checked.
Efficiency nobody can state
The plant has nameplate figures, but nobody can say what a TR of cooling costs this week against last month.
Cold rooms checked by hand
A room drifts between rounds, and the record is a logbook entry instead of what actually happened.
How dairy refrigeration monitoring works in Aqueduct
The same loop for every plant: Monitor, Measure, Identify, Act, Verify.
Group the plant the way it runs
Compressors, condensers and the loads they serve are modeled as refrigeration groups on aQ Core, so cooling and power belong together.
Measure cooling against power
Electrical input is matched to cooling output from BTU meters or temperature and flow, and compared under similar intake, weather and duty.
Investigate the drift
When power rises and cooling stays flat, Aqueduct reviews pressure and temperature trends for poor heat removal and recommends a check.
The engineer approves
The plant engineer confirms the cause and approves the response, such as restoring condenser flow or cleaning fills. Work goes to your CMMS.
Verify the whole system
Total refrigeration energy, including any added pump and fan load, is compared after the change. The verified result becomes the new baseline.
Built for major dairy operations
Major dairy operations run on Aqueduct. One dairy scope covers 5 refrigeration plants, 21 compressors and 2,080 TR of installed capacity.
Plant by plant efficiency
Plants that have their own electrical feed report efficiency individually. Plants on a shared feed report as one group.
Learn moreQuestions in plain language
aQ Assistant answers which refrigeration group used more energy per unit of cooling, with the measurements and period shown.
Early signs of failure
aQ PredictIQ reads compressor vibration, a new sound signature and energy drift, and schedules maintenance before the failure.
Learn moreContinuous cold room evidence
aQ Assurance keeps temperature records and excursions with closure, ready for your quality team or auditor to review.
Learn moreWhere teams put it to work
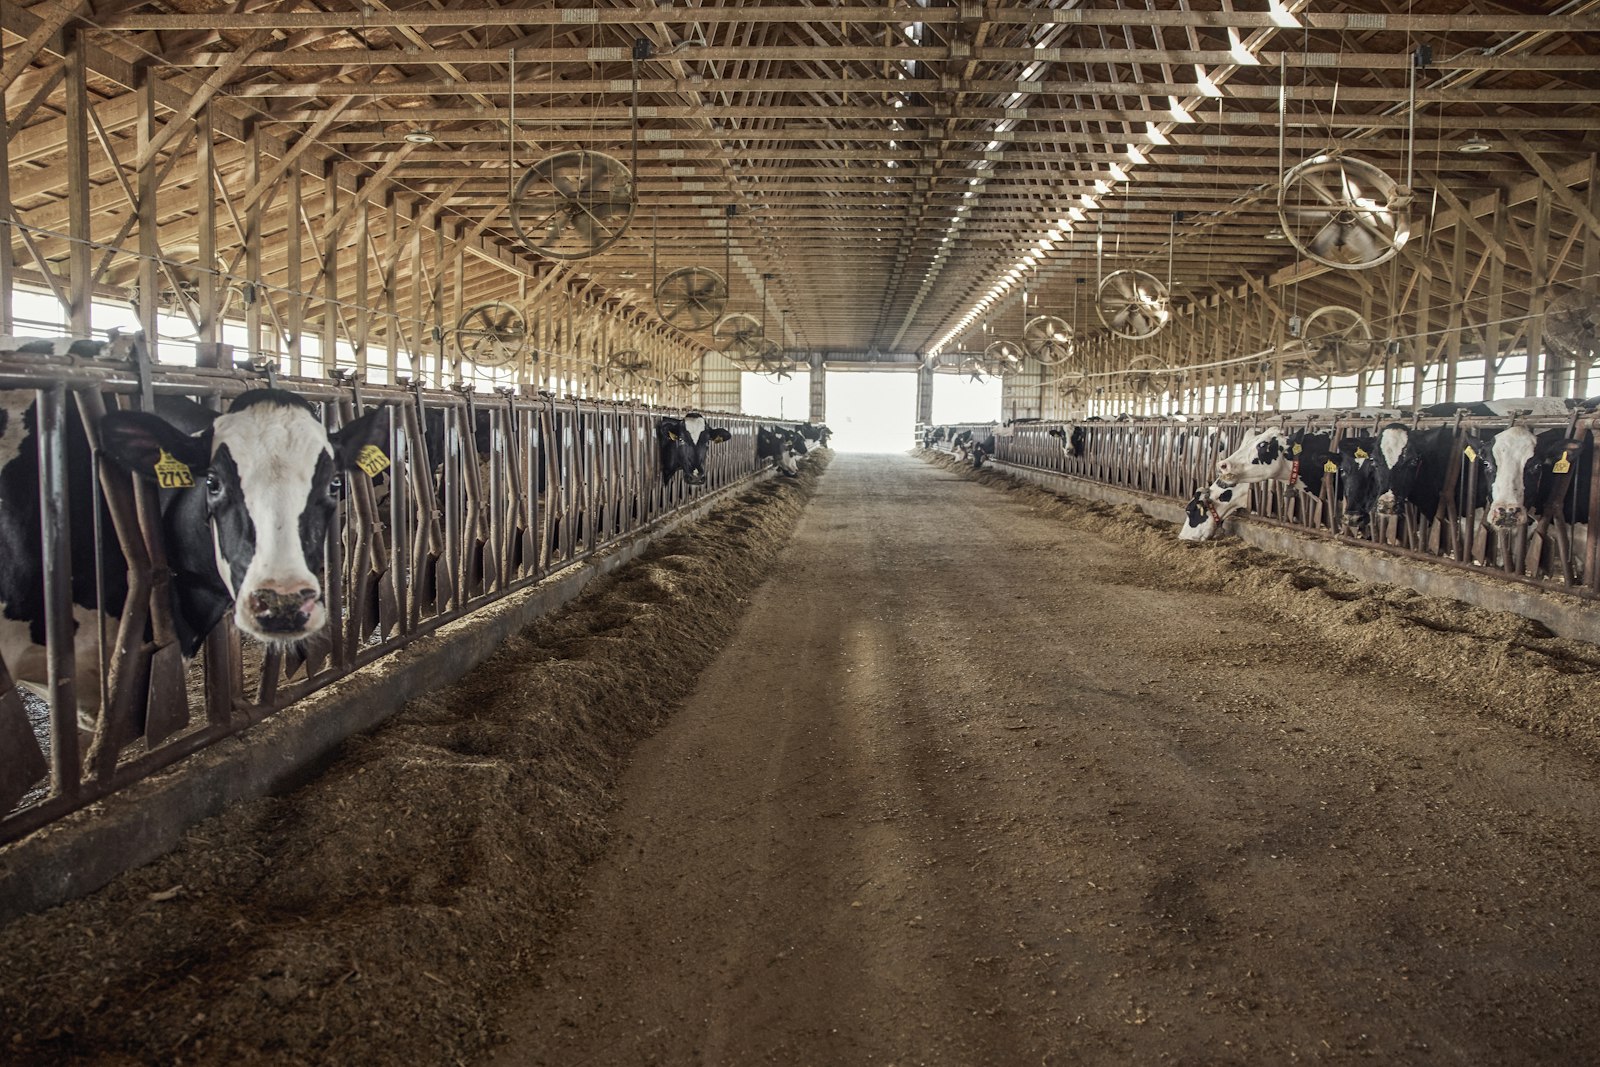
Chilling raw milk the moment it arrives
Plate chillers and ice banks are measured against the intake plan, so the plant knows whether cooling kept pace with tankers arriving through the day.
Learn more
Chilled water and glycol loops held to target
Supply and return temperatures, flow and power show whether pasteurizers, separators and CIP returns are getting the cooling they need at the lowest energy.
Learn more
Cold stores that keep their own record
Butter, cheese and packed milk stores keep a continuous temperature record with excursions and closure, linked to the refrigeration group that serves them.
Learn moreRelated
Common questions
Dairy refrigeration monitoring is the continuous measurement of compressors, condensers, chillers and cold rooms against the cooling they deliver. Aqueduct reads pressure, temperature, flow and electrical input, works out efficiency under similar conditions and flags poor heat removal and early signs of failure before product temperature moves.
Divide the electrical input of the compressors and their auxiliaries by the cooling delivered in tons of refrigeration, measured with BTU meters or with temperature and flow on the chilled water or glycol loop. Aqueduct calculates it continuously per refrigeration group and compares periods under similar intake and weather.
Yes. Aqueduct reads ammonia compressor, condenser and plant room data from existing SCADA, PLCs and meters, and adds sensing through partners where needed. The site safety system keeps control of ammonia alarms, ventilation and shutdowns, and Aqueduct keeps a shared record beside it.
Common causes include fouled condenser surfaces, low condenser water flow, poor cooling tower condition and non-condensable gases in the system. Aqueduct flags rising power and discharge pressure at flat cooling output and recommends condenser and cooling tower checks for the engineer to confirm.
Only where control is enabled, with owner approval. Many dairies run Aqueduct read only beside the plant controller, and the engineer carries out the approved change. Where control is enabled, every command is logged with lockouts that prevent short cycling.
Aqueduct keeps a continuous temperature record for each cold room and silo, with every excursion, its duration and its closure. Your quality team or auditor reviews and files that evidence. Aqueduct does not certify the cold chain.
Major dairy operations run on Aqueduct. Its scope covers 5 refrigeration plants, 21 compressors and 2,080 TR of installed capacity, alongside water and electricity.
See Aqueduct on your own facility.
Bring a site, a utility bill or a question. We will show you where the loss is.