
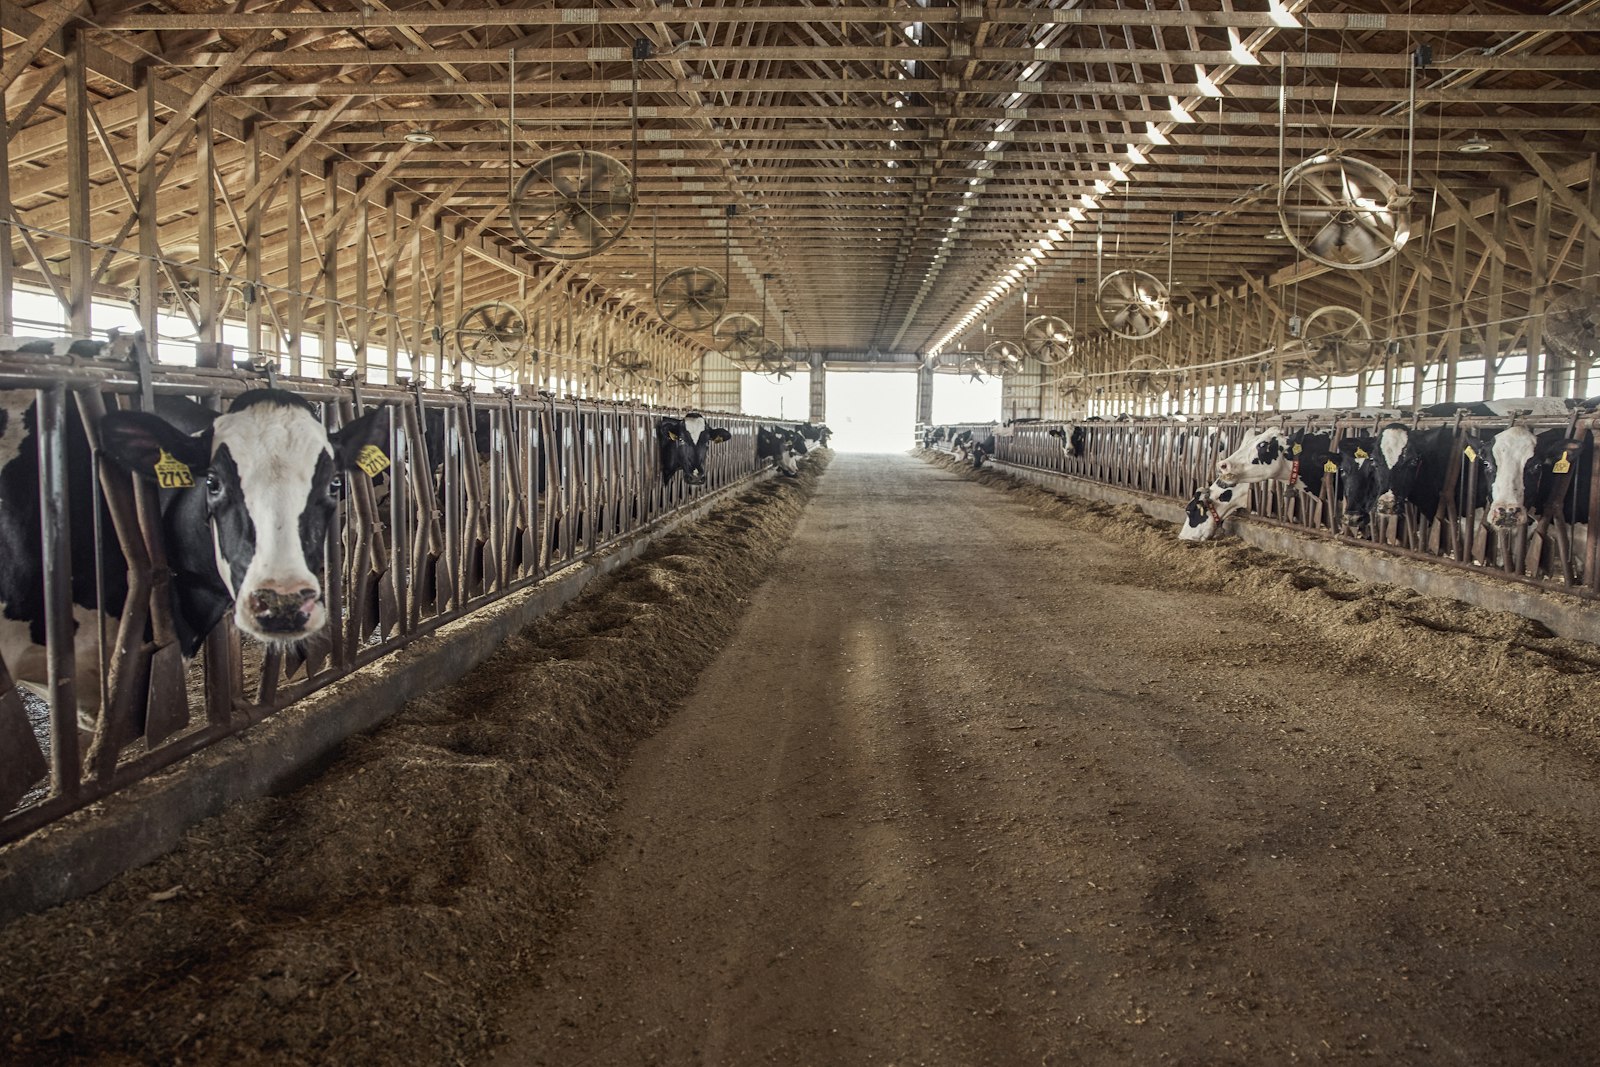
Utility intelligence at a major dairy operation: water, electricity and refrigeration
The dairy's engagement with Aqueduct covers water, electricity and refrigeration on one platform. The scope spans 5 refrigeration plants, 21 compressors and 2,080 TR of installed capacity, with 41 SCADA sources supporting 48 reporting assignments. aQ WaterGuard and aQ EnergySmart on aQ Core link readings to equipment, and the engineer approves every response.
A major dairy operation runs on refrigeration, water and electricity at once. Five refrigeration plants with 21 compressors and 2,080 TR of installed capacity in scope draw a large share of site power, and water moves from source through treatment, storage and distribution. When electricity use rises, the plant team needs to know whether cooling output rose with it, or whether the plant is working harder for the same result.
Each utility had its own data, and none of it was linked to the equipment and conditions behind it. Condenser and cooling tower problems were seen late, overnight water flow and losses were hard to locate, and there was no shared record of the issue, the check and the result.
Aqueduct is designed to read the three utilities together on aQ Core. Water is measured from source to distribution. Electricity comes from 41 SCADA sources supporting 48 reporting assignments. Refrigeration is measured through pressure, temperature, flow and matched electrical input. Digital twins link each reading to its equipment, so aQ EnergySmart can compare electricity for cooling with the cooling delivered under similar conditions. Plants 1 to 3 report efficiency individually, and plants 4 and 5 share one group.
When performance looks unusual, AI helps find the cause. If electricity use rises while cooling output stays similar, Aqueduct reviews power and pressure trends for signs of poor heat removal and recommends a check of condenser water flow and cooling tower condition. The engineer confirms the cause and approves the response, such as a flow correction or cleaning. Aqueduct then compares total refrigeration energy, including any added pump and fan load, and records the measured result.
Savings are established only after an operating change, under comparable production, cooling duty and weather, while product quality, hygiene and required temperatures are maintained. aQ Assistant answers plain language questions with the measurements and comparison period behind each answer, and management reviews savings, open issues and outcomes with the supporting trends.
The next step is to confirm the inputs and the installed proposal. Milvian AI then installs the measurement network and configures the intelligence layer, and the dairy directs the operating response.
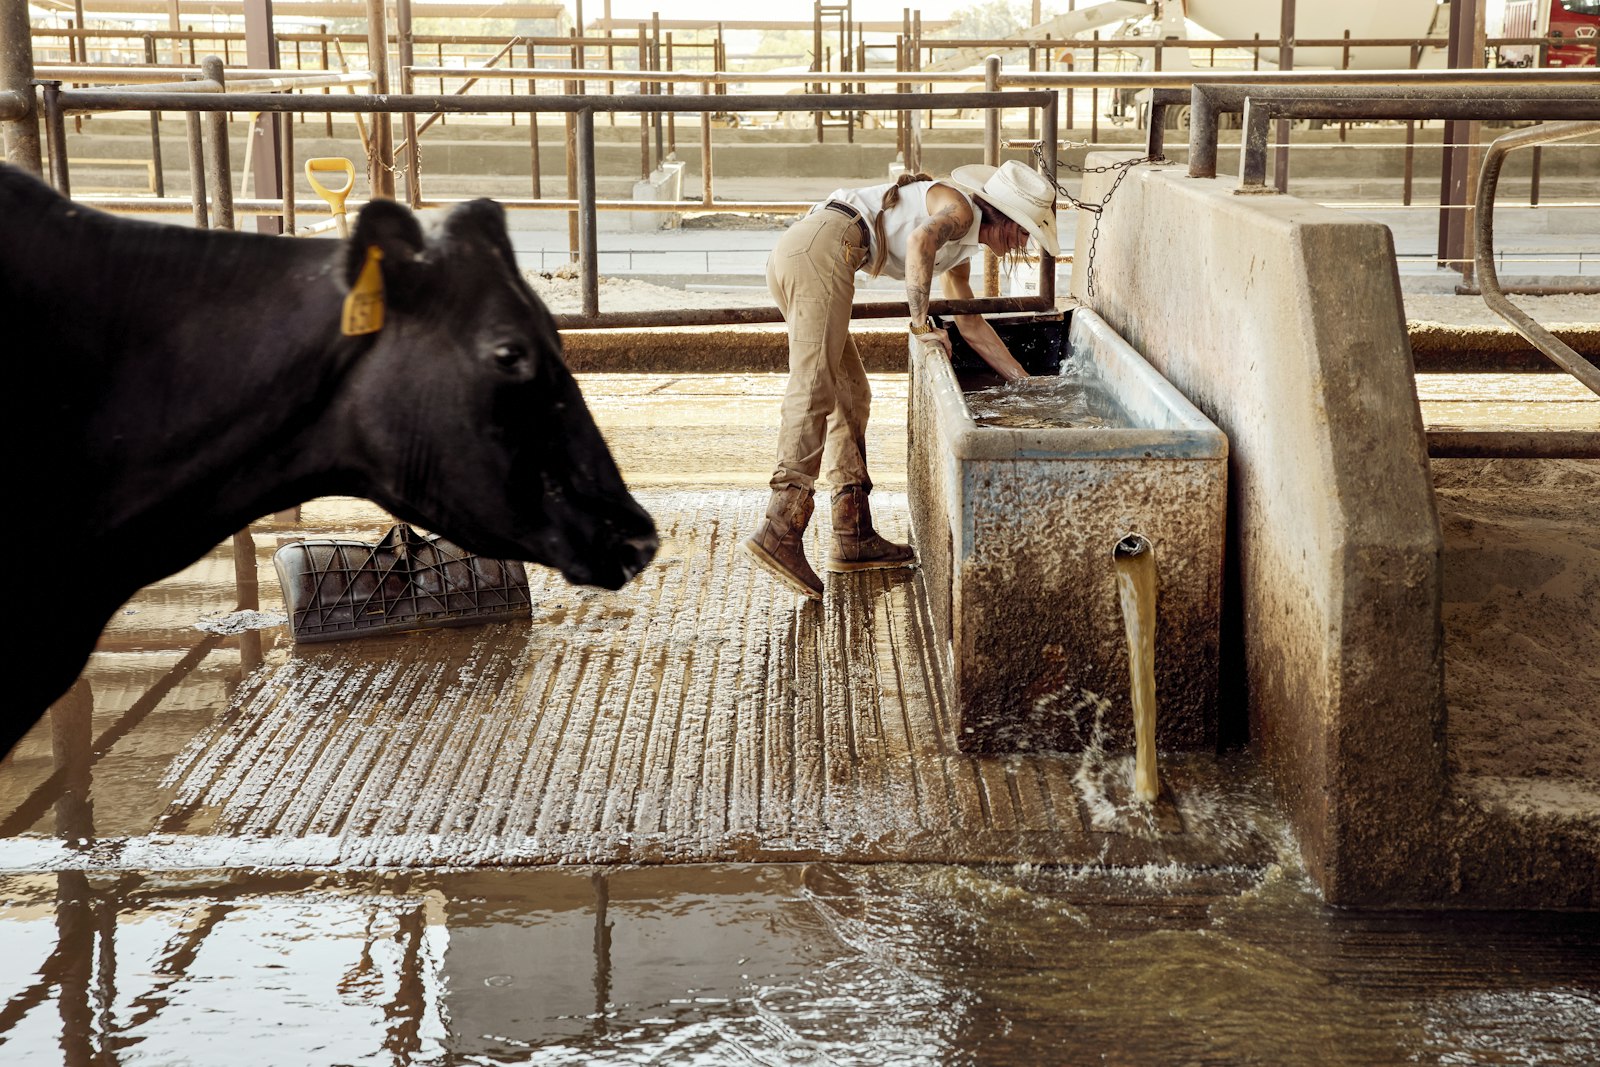

Five plants, one dairy
Refrigeration, water and electricity are mapped together in aQ Core, plant by plant.
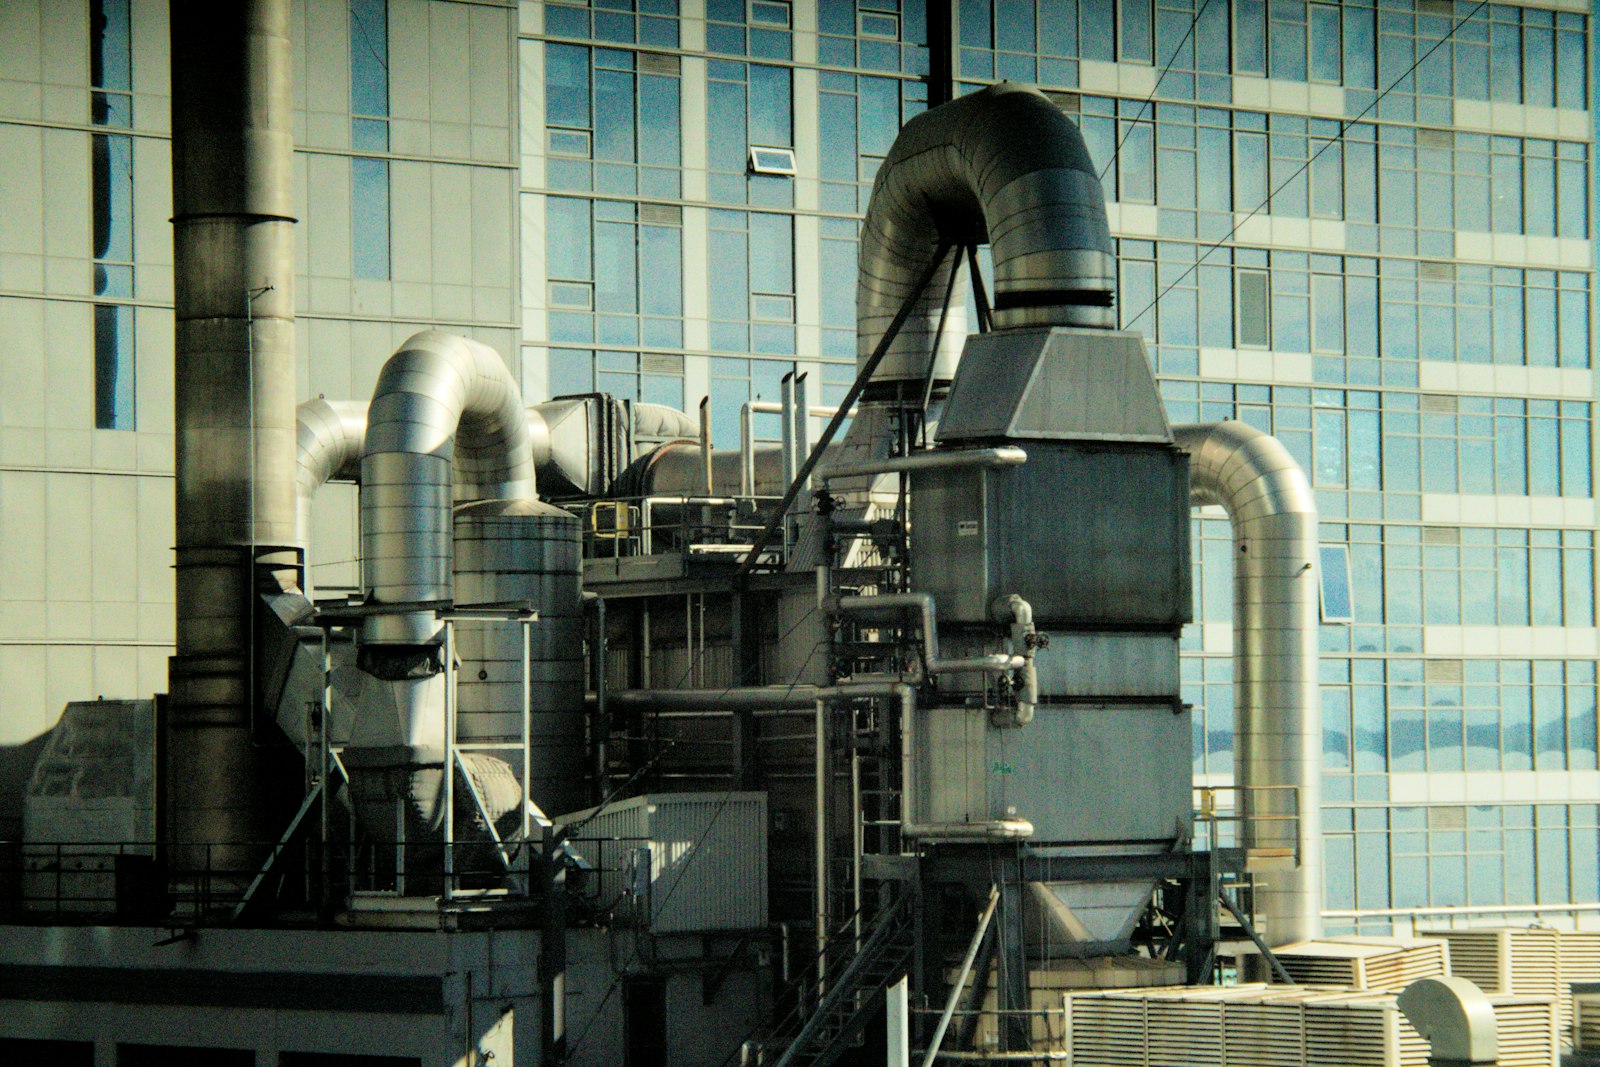
Readings matched to equipment
Pressure, temperature, flow and electrical input are linked to each compressor and plant through digital twins.
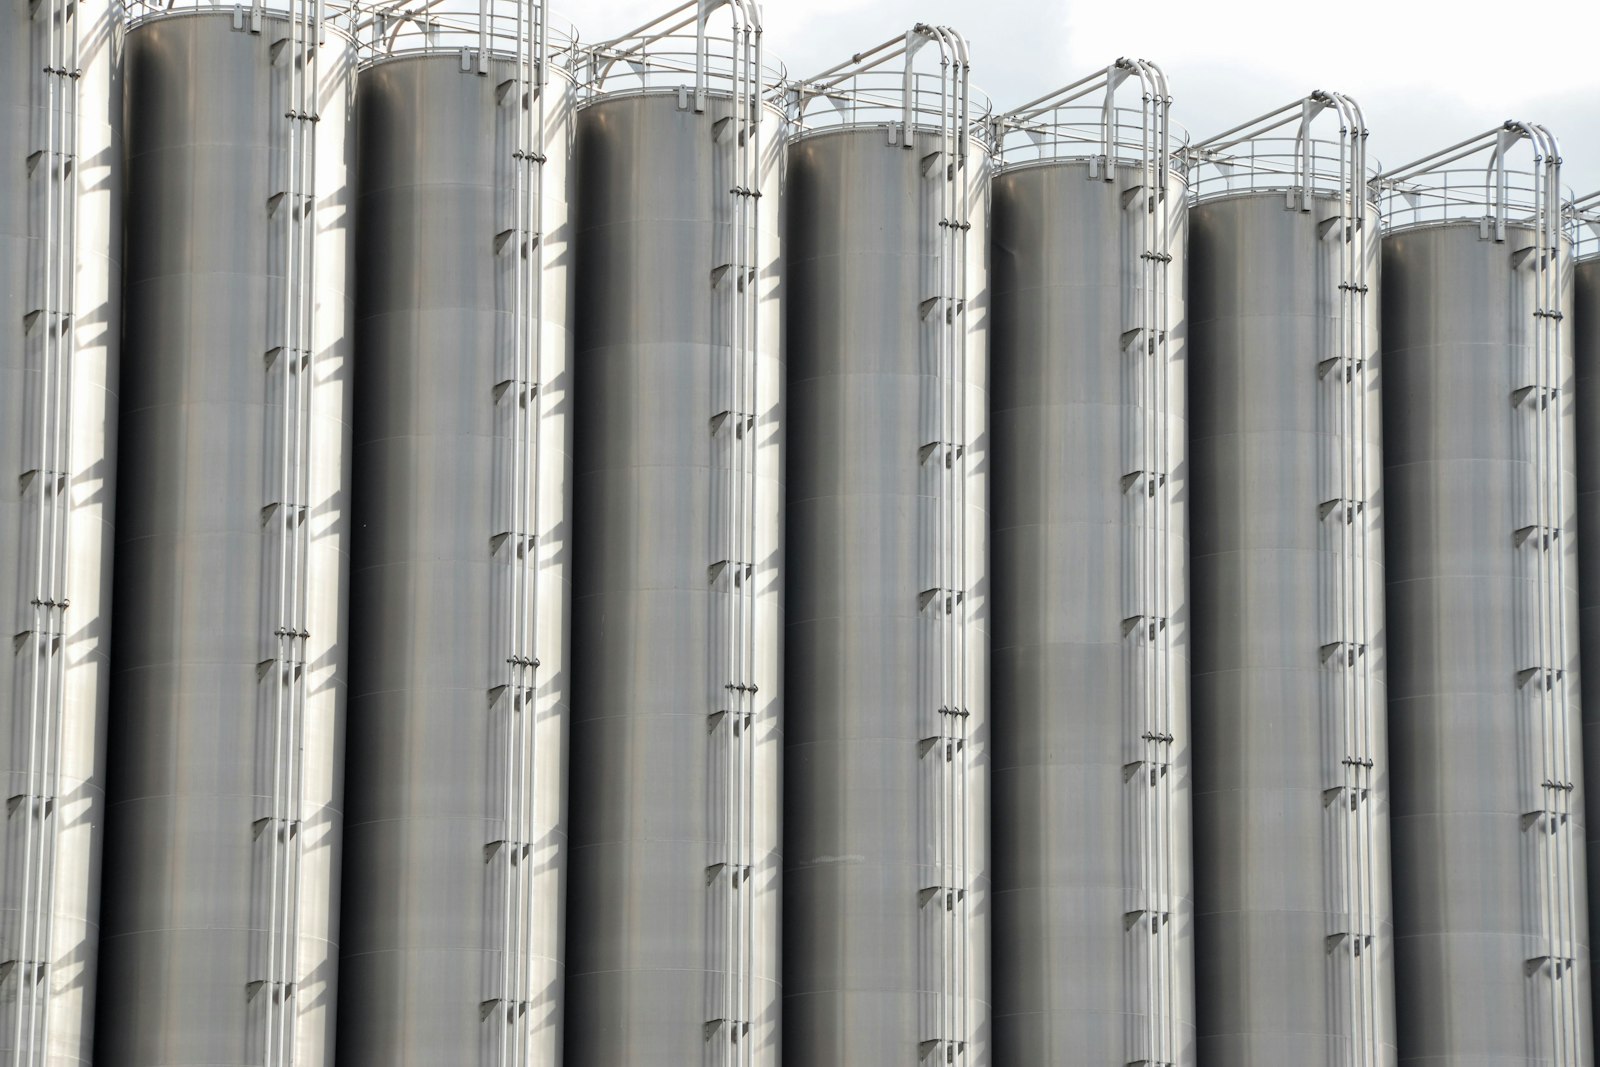
More power, same cooling
Electricity use has increased while cooling output is similar under comparable conditions.
Check condenser heat removal
AI reviews power and pressure trends for poor heat removal and recommends a check of condenser water flow and the cooling tower.
Engineer approves the fix
The engineer confirms the cause and approves a flow correction or cleaning. Aqueduct records the decision.
Total energy compared
Total refrigeration energy, including any added pump and fan load, is compared under comparable production, duty and weather.
How it works at A major dairy operation.
Cooling, water and power that had to be read together
A dairy runs on refrigeration, water and electricity at once. When electricity use rises, the plant team needs to know whether cooling output rose with it or whether the plant is working harder for the same result.
The dairy's five refrigeration plants and 21 compressors draw a large share of site power. Water moves from source through treatment, storage and distribution. Each utility had its own data, and none of it was linked to the equipment and conditions behind it.
- Electricity not compared with the cooling actually delivered
- Condenser and cooling tower problems seen late
- Overnight water flow and losses hard to locate
- No shared record of the issue, the check and the result
Digital twins that link readings to equipment
Aqueduct models link readings to equipment and utility systems. Water is measured from source to distribution. Electricity comes from 41 SCADA sources. Refrigeration is measured through pressure, temperature, flow and matched electrical input.
When performance looks unusual, AI helps investigate the cause and recommends a check. The engineer confirms the cause and approves the response, and Aqueduct records the measured result. aQ Assistant answers plain language questions using the relevant measurements and operating history.
- 01
Confirm inputs
Utility inputs, the installed proposal and the operating owners are confirmed with the dairy's team.
- 02
Install and configure
Milvian AI installs the measurement network and configures the intelligence layer across water, electricity and refrigeration.
- 03
Compare like with like
Electricity for cooling is compared with cooling delivered under similar conditions. Plants 1 to 3 report efficiency individually and plants 4 and 5 share one group.
- 04
Investigate and approve
An alert such as higher electricity at similar cooling output prompts a check of condenser water flow and cooling tower condition. The engineer approves the response.
- 05
Verify and report
Total refrigeration energy, including any added pump and fan load, is compared after the change, and management reviews the measured outcome.
| Layer | What the scope delivers |
|---|---|
| Water | Source, treatment, storage and distribution meters |
| Electricity | 41 SCADA sources supporting 48 reporting assignments |
| Refrigeration | Pressure, temperature, flow and matched electrical input across 5 plants and 21 compressors |
| Investigation | AI review of power and pressure trends with recommended checks |
| Action history | The issue, the engineer's checks, the approved response and the observed change |
| Questions | Plain language answers that show the measurements and the comparison period |
Expected outcomes
The program targets clearer decisions on where to act and a measured record of each result. Savings are established only after an operating change, under comparable production, cooling duty and weather, while product quality, hygiene and required temperatures are maintained.
- Faster leak response and clearer ownership of water losses
- Earlier investigation of temperature deviations and abnormal loads
- Runtime matched to need
- Management reporting on savings, open issues and outcomes with supporting trends
Once the inputs and the installed proposal are confirmed, Milvian AI installs the measurement network and the dairy directs the operating response. Over time, the same platform can add Smart Controls for pumps and refrigeration auxiliaries, where control is enabled, with owner approval.
From the field to a verified result.
What changed on site.
- Electricity not compared with the cooling delivered
- Condenser and cooling tower problems seen late
- Overnight water flow and losses hard to locate
- No shared record of issue, check and result
- Electricity for cooling compared under similar conditions
- AI recommended checks when power rises at similar output
- Water measured from source to distribution
- Every issue, check, decision and result on record
- In a dairy, refrigeration, water and power move together, so efficiency only makes sense when they are read together.
- The engineer stays in charge: AI recommends the check, people approve the response, and Aqueduct records the measured result.
- Savings counted only under comparable conditions, with quality and temperatures held, give management numbers it can stand behind.
 Logistics and corporate real estate
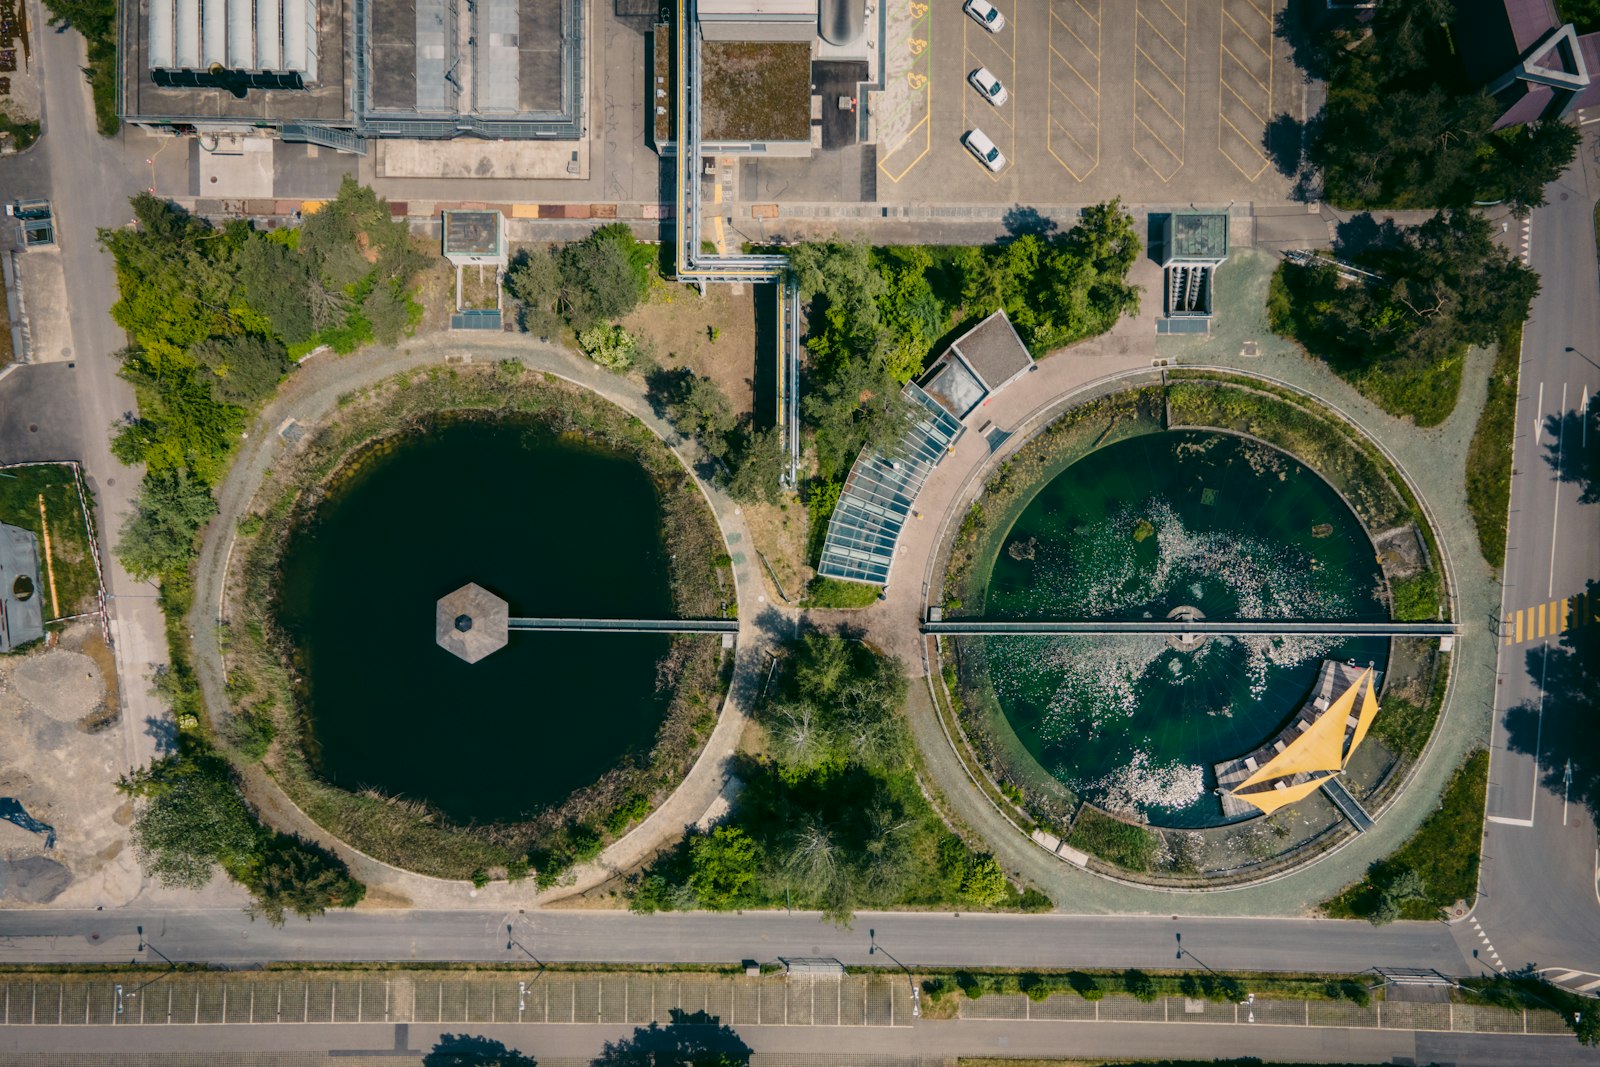
Water stewardship across Amazon's sites, measured in real time
 Aviation
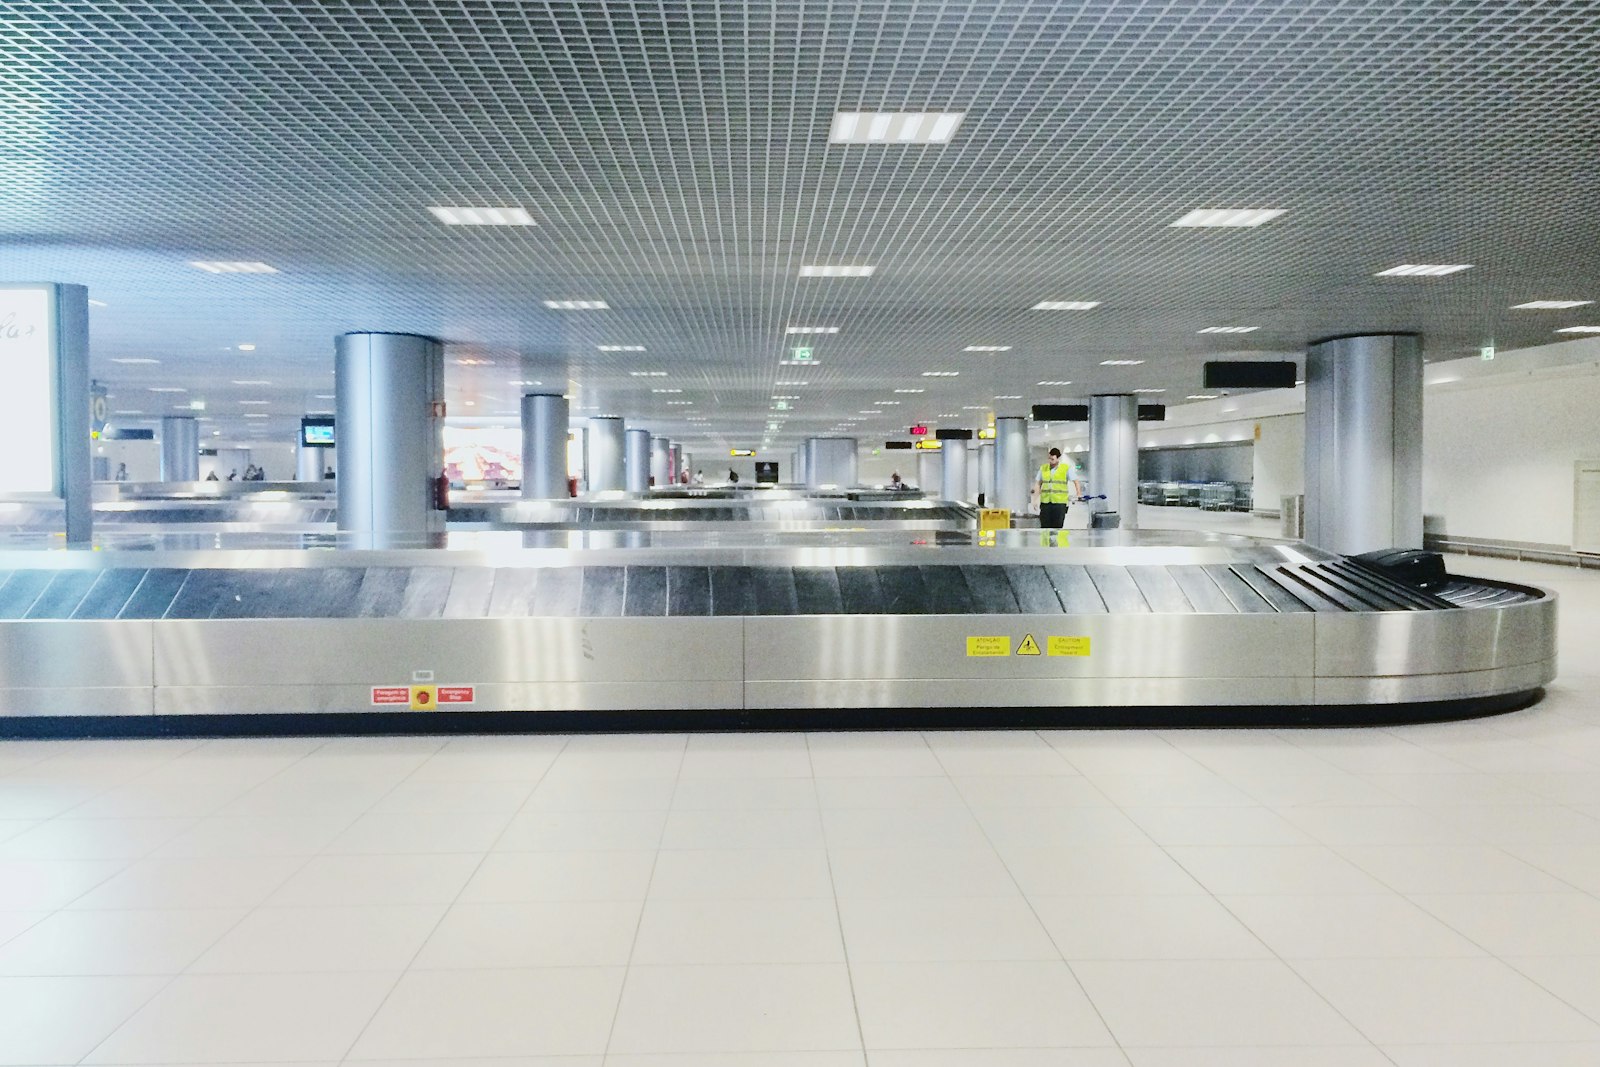
A top 25 US airport live on Aqueduct in two weeks, with a major leak found at once
 Healthcare
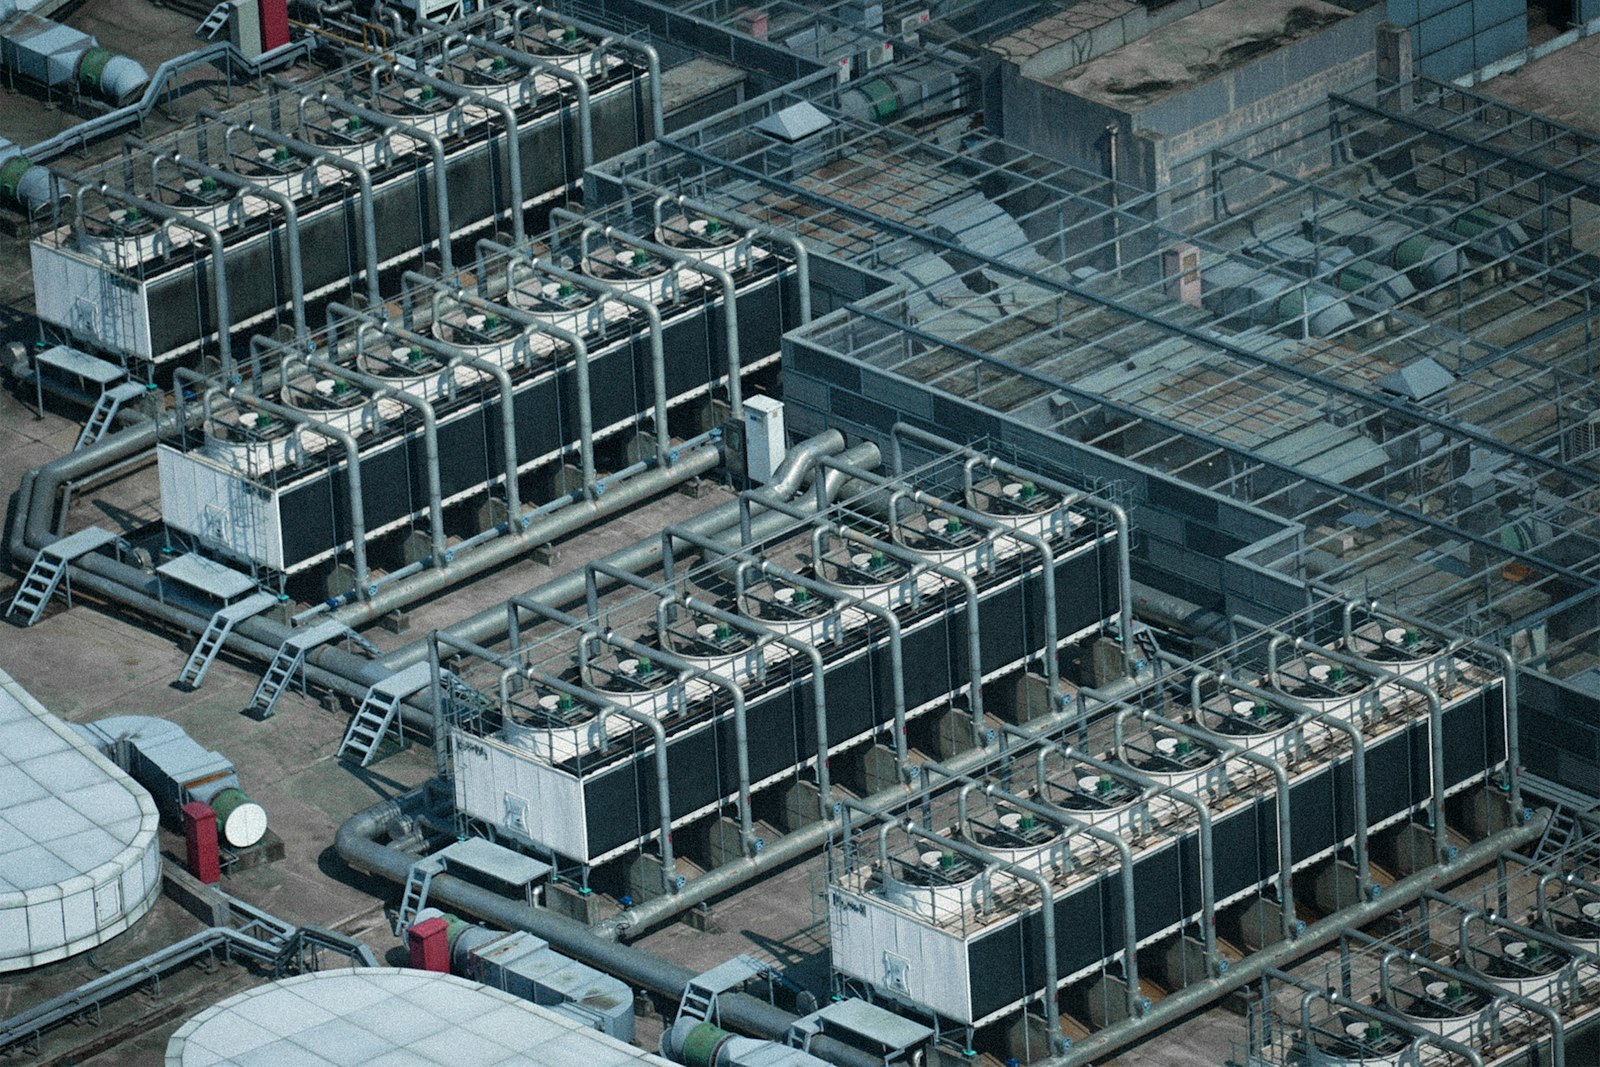
Utility and critical room intelligence for one of India's top hospital chains
Common questions
Aqueduct compares the electricity a refrigeration plant uses with the cooling it delivers under similar conditions. At a major dairy operation this covers 5 plants, 21 compressors and 2,080 TR of installed capacity.
AI reviews power and pressure trends for signs of poor heat removal and recommends a check, such as condenser water flow or cooling tower condition. The engineer confirms the cause and approves the fix, and Aqueduct records the measured result.
Yes. At a major dairy operation, 41 SCADA sources support 48 electricity reporting assignments. Aqueduct reads existing systems and adds measurement only where it is missing.
Savings are measured after an operating change under comparable production, cooling duty and weather. Total system energy includes compressor, pump and fan load, and each saving is counted once.
Yes. aQ Assistant answers questions such as where water kept flowing overnight or which refrigeration group used more energy per unit of cooling, and shows the measurements and period behind each answer.
See Aqueduct on your own facility.
Bring a site, a utility bill or a question. We will show you where the loss is.