WELL Building Standard air quality, monitored continuously per zone
The WELL Building Standard is the International WELL Building Institute's performance-based standard for health in buildings. Its Air concept rewards continuous monitoring of indoor air quality. Aqueduct records CO2, PM2.5, PM10, VOCs, temperature and humidity per zone, tracks exposure in zone-hours and verifies ventilation fixes. Your WELL AP and project team prepare documentation and performance verification.

Healthy air proven every occupied hour, not on the day of the test.
Every zone recorded, every hour people are in it
- Core pollutants
CO2, PM2.5, PM10 and VOC index are recorded per zone alongside temperature and humidity.
- Exposure in zone-hours
Time above target is counted, because duration matters as much as the peak level.
- Data you can trust
Device health shows connection rate and battery voltage, so gaps are visible before a report.
A zone rating with the reason printed beside it
- Why this rating
Each rating names the driving pollutant, the zone affected and the guideline it references.
- Weather aware advice
When outdoor air is mild, the recommendation notes that more fresh air is low cost right now.
- Patterns surfaced
Nightly cleaning VOCs or crowded meeting rooms appear as repeatable patterns, not random alarms.
Fixes that return the zone to range, verified
- Owner approved
Ventilation changes happen only where control is enabled and the owner approves.
- Verified in range
A finding closes only when the zone holds its target band again through occupied hours.
- Recertification ready
Zone histories export by site and period for annual reporting and for recertification.
WELL air evidence, before and after Aqueduct
- Air is tested once during a quiet week and assumed after.
- A crowded meeting room never shows up in the test.
- Cleaning products spike VOCs every night unnoticed.
- Occupants complain before facilities know there is a problem.
- Recertification means retesting with no record in between.
 The Aqueduct way
- Air is recorded per zone every occupied hour.
- Crowded rooms show up as exposure in zone-hours.
- Nightly VOC patterns are flagged with time and zone.
- Zones drifting out of range are flagged before complaints.
- Recertification starts from a continuous zone record.
What WELL is and who it applies to
The WELL Building Standard is administered by the International WELL Building Institute (IWBI). It certifies buildings, interiors and portfolios on features that affect human health, grouped into concepts including Air, Water, Light, Thermal Comfort, Sound, Materials, Mind, Movement, Nourishment and Community.
WELL is performance based. Projects meet preconditions and earn optimizations, and on-site performance verification tests air and water quality. Within the Air concept, continuous indoor air monitoring and occupant awareness are rewarded, which is where measured zone data matters.
WELL is voluntary and open to any building type. Owners and tenants use it to show employees and investors that a space is healthy, and that claim is stronger when the data is continuous rather than a single test.
WELL requirement areas and the evidence Aqueduct supplies
Aqueduct supplies the continuous data. Performance verification and submission stay with the project team.
| Requirement area | Evidence Aqueduct supplies |
|---|---|
| Air quality monitoring | Continuous CO2, PM2.5, PM10 and VOC index readings per zone |
| Ventilation effectiveness | CO2 and occupancy per zone with ventilation response recorded |
| Thermal comfort | Temperature and humidity per zone over occupied hours |
| Pollution events and source control | Spikes such as cleaning VOCs or vehicle exhaust flagged with time and zone |
| Occupant awareness | Zone health ratings with a plain-language explanation of each rating |
| Water quality and use | Metered water and treatment plant efficiency where WaterGuard is deployed |
| Ongoing performance | Exportable zone histories for annual reporting and recertification |
How Aqueduct supplies WELL air evidence
Continuous data, explained in plain language, acted on and verified.
Place sensors by zone
Each zone gets an air quality sensor sized to its coverage. Sensors are device agnostic and installed through partners.
Rate every zone
Aqueduct rates zone air health and explains the rating, naming the driver and the guideline referenced.
Find the cause
Patterns such as nightly VOC spikes from cleaning or CO2 from crowded rooms show up with time and place.
Act and confirm
Ventilation adjusts where control is enabled, with owner approval, and the zone is verified back in range.

What stays with your WELL team
Aqueduct is the monitoring layer, not the certifier.
Feature selection
Your WELL AP selects preconditions and optimizations and maps evidence to each feature.
Performance verification
On-site testing is carried out by approved performance testing agents. Aqueduct does not replace it.
Certification
IWBI reviews documentation and awards certification. Aqueduct does not certify spaces.
Related standards
Often paired with WELL.
Where teams put it to work
Healthy air as a tenant promise
Owners pursuing WELL can show tenants continuous zone records for every floor they lease, rather than a test certificate from two years ago.
Learn more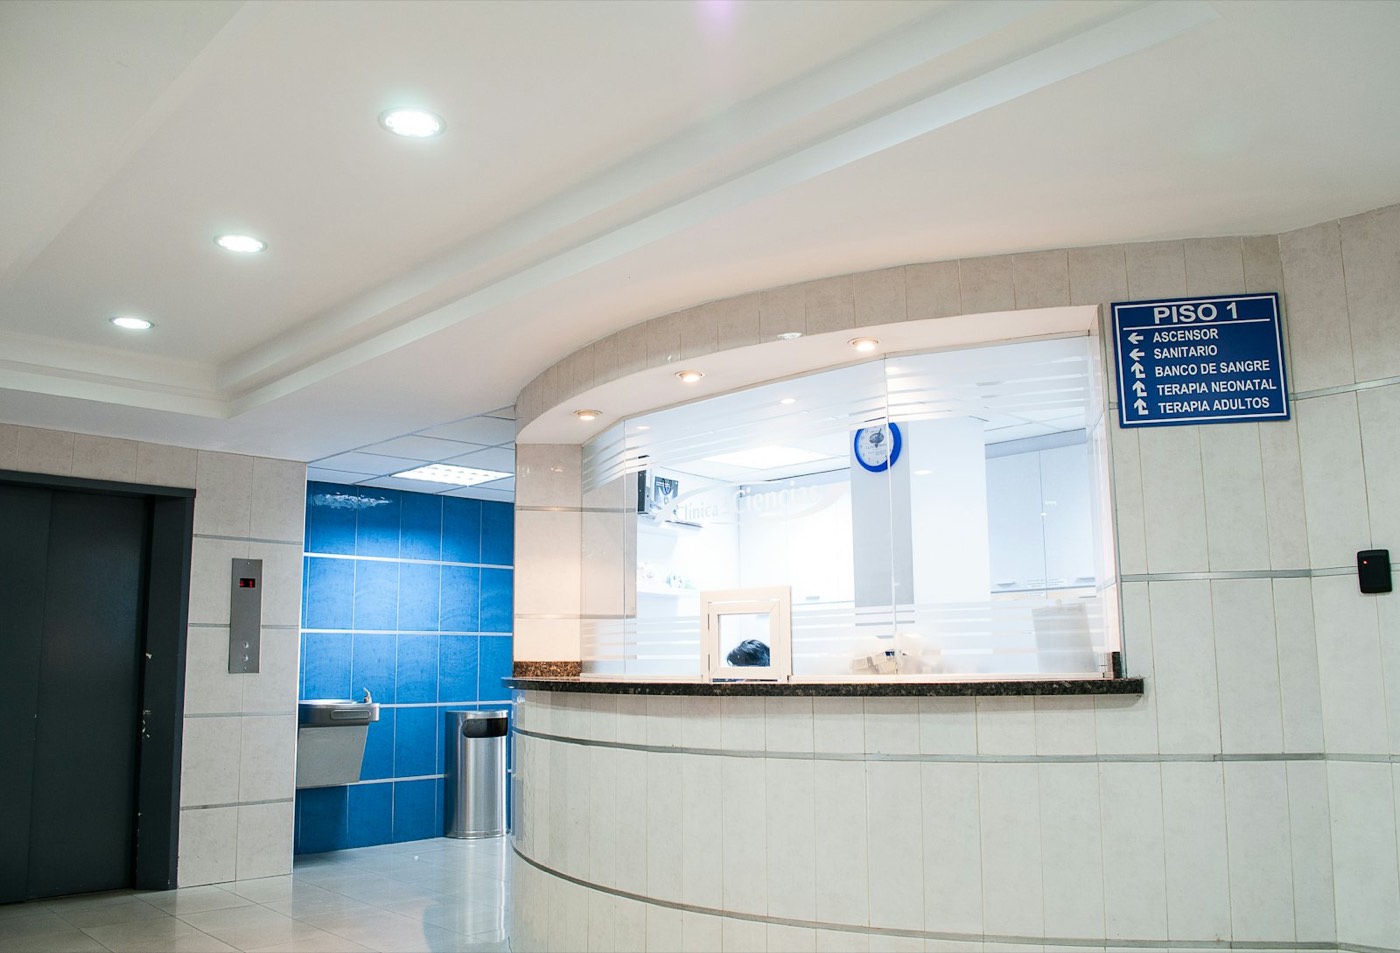
Air held in range in patient areas
Hospitals record air per zone in wards and waiting areas, with ventilation acted on and verified where control is enabled.
Learn more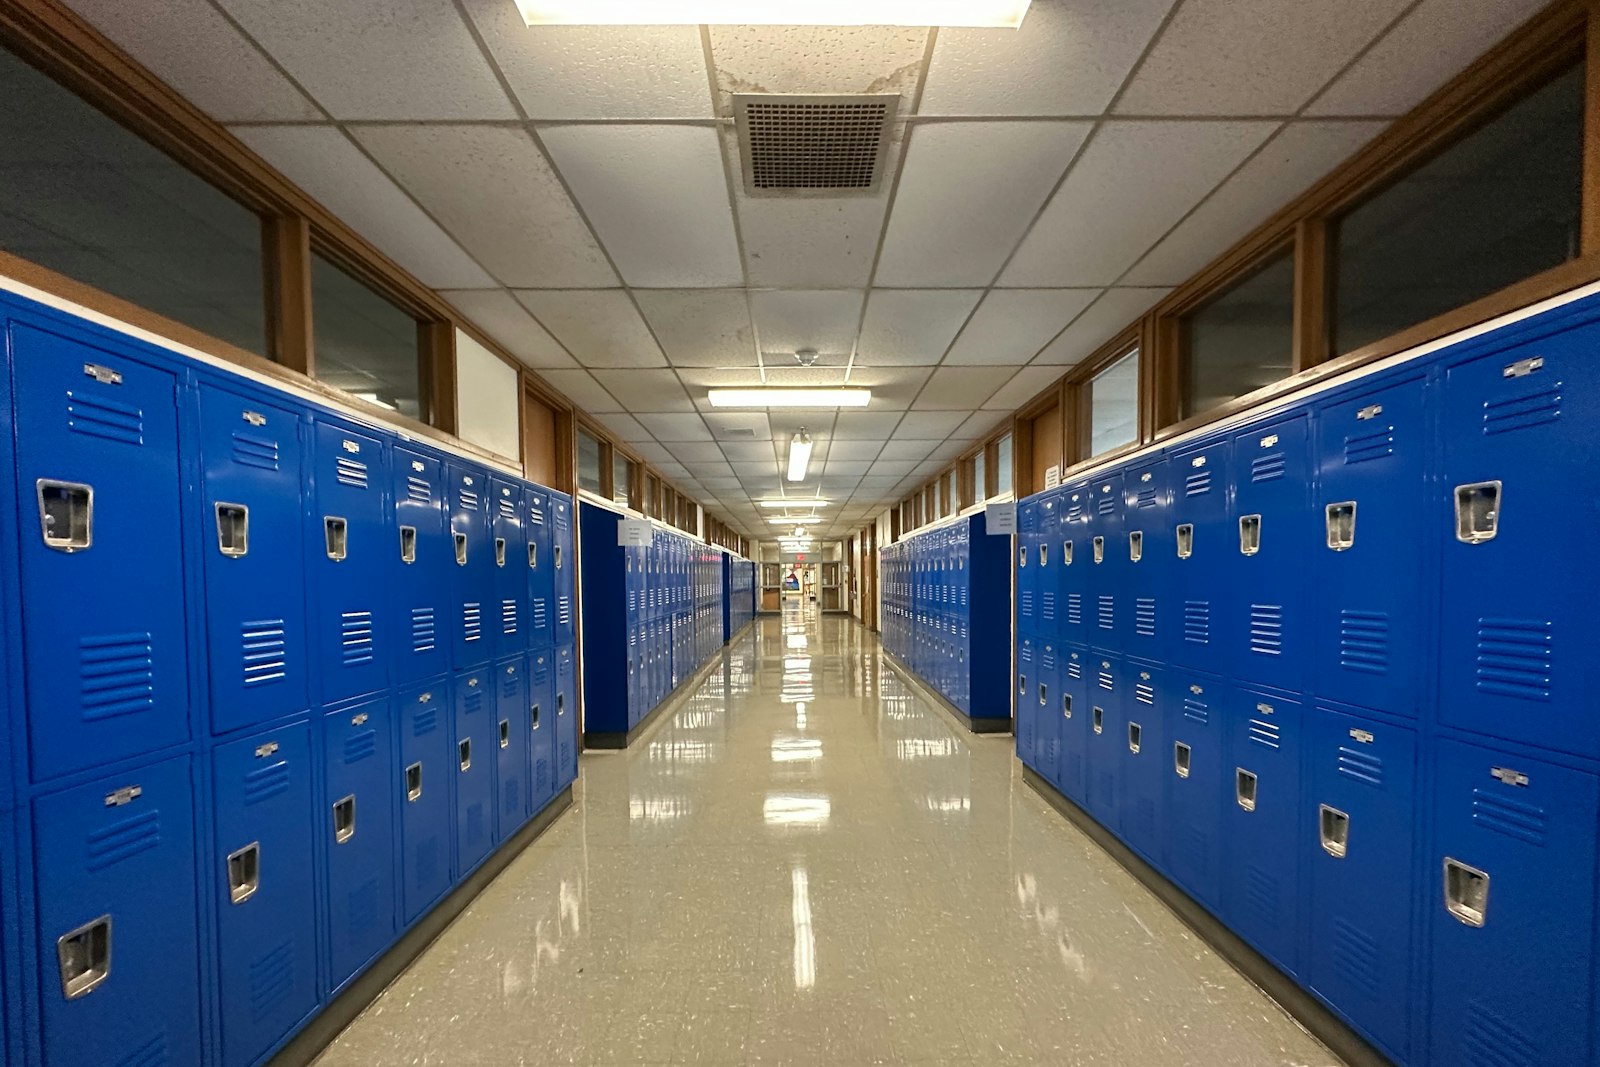
Classroom air on the record
Schools can show parents and staff classroom CO2 and particulate records, room by room, for every hour of every school day.
Learn moreThe WELL features that depend on continuous monitoring
WELL v2 groups requirements into concepts. Air and Thermal Comfort carry most of the measured features, and performance verification tests whether the building meets thresholds on site. Check the current WELL version for exact feature names and limits.
Air quality thresholds
The air quality precondition sets limits for particulates, organic gases and inorganic gases, checked through performance verification. Enhanced air quality optimizations tighten those limits.
- PM2.5 and PM10 per monitored space
- TVOC and formaldehyde where measured
- CO and ozone where relevant
- Data needed
- concentrations against WELL limits
- Source
- multi-parameter air quality sensors
- Aqueduct
- per-space records and exceedance logs
Air quality monitoring and awareness
This feature rewards continuous indoor air monitors in occupied spaces, with data made available to occupants. It asks for specific parameters at a set density.
- Monitors per floor area or space type
- Data recorded at a set interval
- Display or access for occupants
- Data needed
- continuous readings and occupant access
- Source
- AirSafe sensors
- Aqueduct
- per-zone dashboards and exports
Ventilation design and enhanced ventilation
WELL references ventilation standards such as ASHRAE 62.1 and rewards better outdoor air delivery, including demand-controlled ventilation with CO2 limits.
- Zone CO2 against the WELL limit
- Outdoor air delivery at the air handler
- DCV response to occupancy
- Data needed
- CO2, airflow, occupancy
- Source
- AirSafe sensors, BMS points
- Aqueduct
- CO2 exposure by zone
Thermal comfort and monitoring
Thermal Comfort features cover comfort performance, individual control and monitoring of temperature and humidity in occupied spaces.
- Temperature and RH per zone
- Comfort compliance per space
- Complaint correlation with readings
- Data needed
- temperature and humidity by zone
- Source
- AirSafe sensors, BMS points
- Aqueduct
- comfort compliance per zone
Air filtration and maintenance
Filtration features ask for filters of a set efficiency and a maintenance routine. Filter loading and indoor particulates together show whether filtration works.
- Filter pressure where measured
- Indoor PM against outdoor PM
- Filter change records
- Data needed
- filtration performance
- Source
- AHU points, indoor and outdoor PM
- Aqueduct
- filter alerts to the CMMS
From sensor plan to performance verification
A typical path for a WELL project, or a certified building keeping air data in shape for recertification.
Plan monitors against features
Choose the features you pursue and place monitors at the density and in the spaces WELL asks for.
Install and validate
Install AirSafe sensors with aQ Atria, confirm device health and read existing BMS points for ventilation.
Find and fix exceedances
Use a few months of data to find spaces that breach limits and fix ventilation, filtration or sources before testing.
Test, then keep the record
Your performance testing agent tests on site. Continuous data then supports annual reporting and recertification.
WELL features mapped to meters and sensors
Feature names are from WELL v2. Confirm parameters and limits in the current version.
| WELL feature | What to measure | Sensors | Aqueduct output |
|---|---|---|---|
| Air quality | PM2.5, PM10, TVOC, CO, ozone | Multi-parameter air quality sensors | Per-space records against limits |
| Enhanced air quality | Tighter particulate and gas limits | Same sensors | Exceedance hours per space |
| Air quality monitoring and awareness | Continuous indoor parameters | AirSafe sensors at the required density | Dashboards and occupant views |
| Ventilation design | CO2 and outdoor air | CO2 sensors, AHU airflow points | CO2 exposure by zone |
| Air filtration | Indoor particulates, filter condition | PM sensors, filter pressure points | Filter alerts |
| Thermal comfort | Temperature and RH | Temperature and humidity sensors | Comfort compliance per zone |
| Sound | Ambient sound level in decibels | Sound level sensors, no audio recorded | Noise trends by space |
| Light | Light level | Light level sensors | Light trends by space |
Why WELL air data fails between tests
A good test day, a bad month
Performance testing samples a short window. Continuous monitors show the weeks when cleaning products, construction nearby or a failed filter pushed readings over the limit.
Monitors in the wrong place
Sensors mounted near supply diffusers or windows read cleaner air than people breathe. Placement at breathing height in occupied zones gives honest numbers.
Outdoor air brings the problem in
On high pollution days, more outdoor air can raise indoor particulates. Indoor and outdoor readings side by side show when filtration, not ventilation, is the fix.
Sources1 references cited on this page
sites in 21 countries run on Aqueduct.
and 9 clinics in one of India’s top hospital chains.
US airport running water intelligence on Aqueduct.
of commercial real estate under Aqueduct.
FMCG manufacturing campus.
operations run on Aqueduct.





Related
Common questions
WELL certification is awarded by the International WELL Building Institute to spaces that meet its health-focused requirements across concepts like Air, Water, Light and Thermal Comfort. Aqueduct supplies continuous air quality data that supports the Air concept.
WELL rewards continuous indoor air monitoring within its Air concept, and the details depend on the version and features your project targets. Aqueduct records CO2, particulates, VOCs, temperature and humidity per zone, continuously.
Aqueduct reads sensors that report CO2, PM2.5, PM10, VOC index, temperature and humidity. Where specialized sensors are installed, it also records CO, formaldehyde, ozone, NO2 and radon.
No. Performance verification is on-site testing by approved agents. Aqueduct supplies the continuous record between tests, which shows the space stays healthy every occupied hour.
Aqueduct flags zones that drift out of range, explains the likely cause, and adjusts ventilation where control is enabled with owner approval. It then verifies the zone returned to range and counts the energy cost.
No. LEED focuses on environmental performance such as energy and water, while WELL focuses on human health. Many buildings pursue both, and Aqueduct supplies measured data to each.
Aqueduct shows air quality by site, floor and zone, so owners can share the relevant zones with occupants. Access is scoped by role.
The air quality monitoring feature sets a density by floor area and space type. Check the current WELL feature language, then Aqueduct plans placement against it.
WELL specifies parameters, ranges and accuracy for monitors in some features. Choose sensors that meet them, and keep calibration records.
WELL certification is renewed on a cycle and some features ask for ongoing data reporting. Continuous monitoring means renewal draws on data you already hold.
Yes. The sensors measure ambient sound level in decibels and never record audio.
See Aqueduct on your own facility.
Bring a site, a utility bill or a question. We will show you where the loss is.