VOC monitoring for buildings and workplaces, around the clock.
VOC monitoring tracks volatile organic compounds, the gases released by cleaning products, paints, furnishings and processes. Aqueduct measures a VOC index per zone continuously, so recurring patterns such as nightly cleaning or new-material off-gassing are seen, traced to their source and addressed.

Watch VOCs around the clock, find the pattern, and clear the air before people arrive.
Nights and weekends included, when VOCs often rise
- VOC index per zone
A VOC index is reported with CO2, temperature and humidity in every monitored zone.
- After-hours coverage
Readings continue through nights and weekends, when cleaning and maintenance work usually happens.
- Health per device
Device health shows connection rate and battery, so a silent sensor is not mistaken for clean air.
Recurring spikes lined up with what caused them
- Cleaning cycles
A rise at the same hour every weeknight is matched with the cleaning crew's schedule.
- Fit-out off-gassing
New paint, flooring and furniture show as a slow decline over the weeks after a fit-out.
- Complaints checked
Odor and headache complaints can be checked against the zone record for that day and hour.
Clear the zone before the morning
- Flush after cleaning
Where control is enabled, ventilation runs a flush after cleaning until the zone is back in range.
- Change the source
Findings point to the product or the timing, so facilities can work with the cleaning contractor.
- Checked the next night
The pattern is checked on following nights, so the change is confirmed rather than assumed.
VOCs, before and after Aqueduct
- Night-time spikes from cleaning products go completely unseen.
- New fit-outs off-gas for weeks with nobody tracking it.
- Smell and headaches are the only alarm people have.
- Purge and flush strategies run on habit, not readings.
- Nobody checks whether a product change actually helped.
 The Aqueduct way
- Readings run through the night, when cleaning crews work.
- Off-gassing after a fit-out is tracked until levels settle.
- Every complaint can be checked against the zone record.
- Flushes run on what the air shows, where control is enabled.
- Following nights confirm whether the pattern has changed.
What VOCs look like without Aqueduct
VOC problems often happen when nobody is watching.
Night-time spikes go unseen
Cleaning crews work after hours. If products push VOCs up every night, nobody sees it.
New spaces off-gas
Fresh paint, flooring and furniture release VOCs for weeks after a fit-out.
Smell is the only alarm
Complaints about odor or headaches arrive with no data to check them against.
Ventilation runs blind
Purge and flush strategies are run by habit, not by what the air shows.
How VOC monitoring works
Powered by aQ AirSafe, with Smart Controls where ventilation control is enabled.
Measure a VOC index per zone
Air quality sensors report a VOC index alongside CO2, temperature and humidity in each zone.
Watch around the clock
Readings are tracked through nights and weekends, when cleaning and maintenance happen.
Find the pattern
Recurring spikes are lined up with schedules, occupancy and events, so a nightly cleaning cycle or a fit-out stands out.
Explain and recommend
The finding names the likely source and the response: change the product or the timing, flush the space, or raise ventilation.
Respond and confirm
Where enabled, ventilation is boosted until the zone is back in range, and the pattern is checked on the following nights.
One VOC pattern, start to finish
An illustrative case at an office floor.
Zone sensors report a VOC index through the night.
VOC rises sharply on several floors at the same hour every weeknight.
The rise matches the cleaning crew's schedule and clears by morning only slowly. Aqueduct flags cleaning products as the likely source.
Facilities switches products with the cleaning contractor, and ventilation runs a flush after cleaning under an owner-approved rule.
Nightly VOC peaks drop and zones are back in range before occupants arrive.
The air people breathe at nine starts with what happened at midnight.
Talk to our teamProblem, solution, impact
Nightly VOC spikes nobody sees.
Continuous VOC index per zone, including off-hours.
Recurring sources found and removed.
Odor complaints with no evidence.
Zone history aligned with schedules and events.
Clear answers for occupants and contractors.
Flushing every space by habit.
Ventilation driven by measured VOC.
Purge energy spent only where needed.
What you get
Per-zone VOC index
Measured continuously with CO2, temperature and humidity.
Pattern detection
Nightly, weekly and post-fit-out patterns made visible.
Source tracing
Spikes aligned with schedules, occupancy and events.
Ventilation response
Flush and boost where control is enabled.
Related standards
Check the current version and what applies to your building.
Where teams put it to work

Cleaning crews and morning air
Nightly VOC rises from cleaning products are matched to the schedule, then cleared with a flush before staff arrive.
Learn more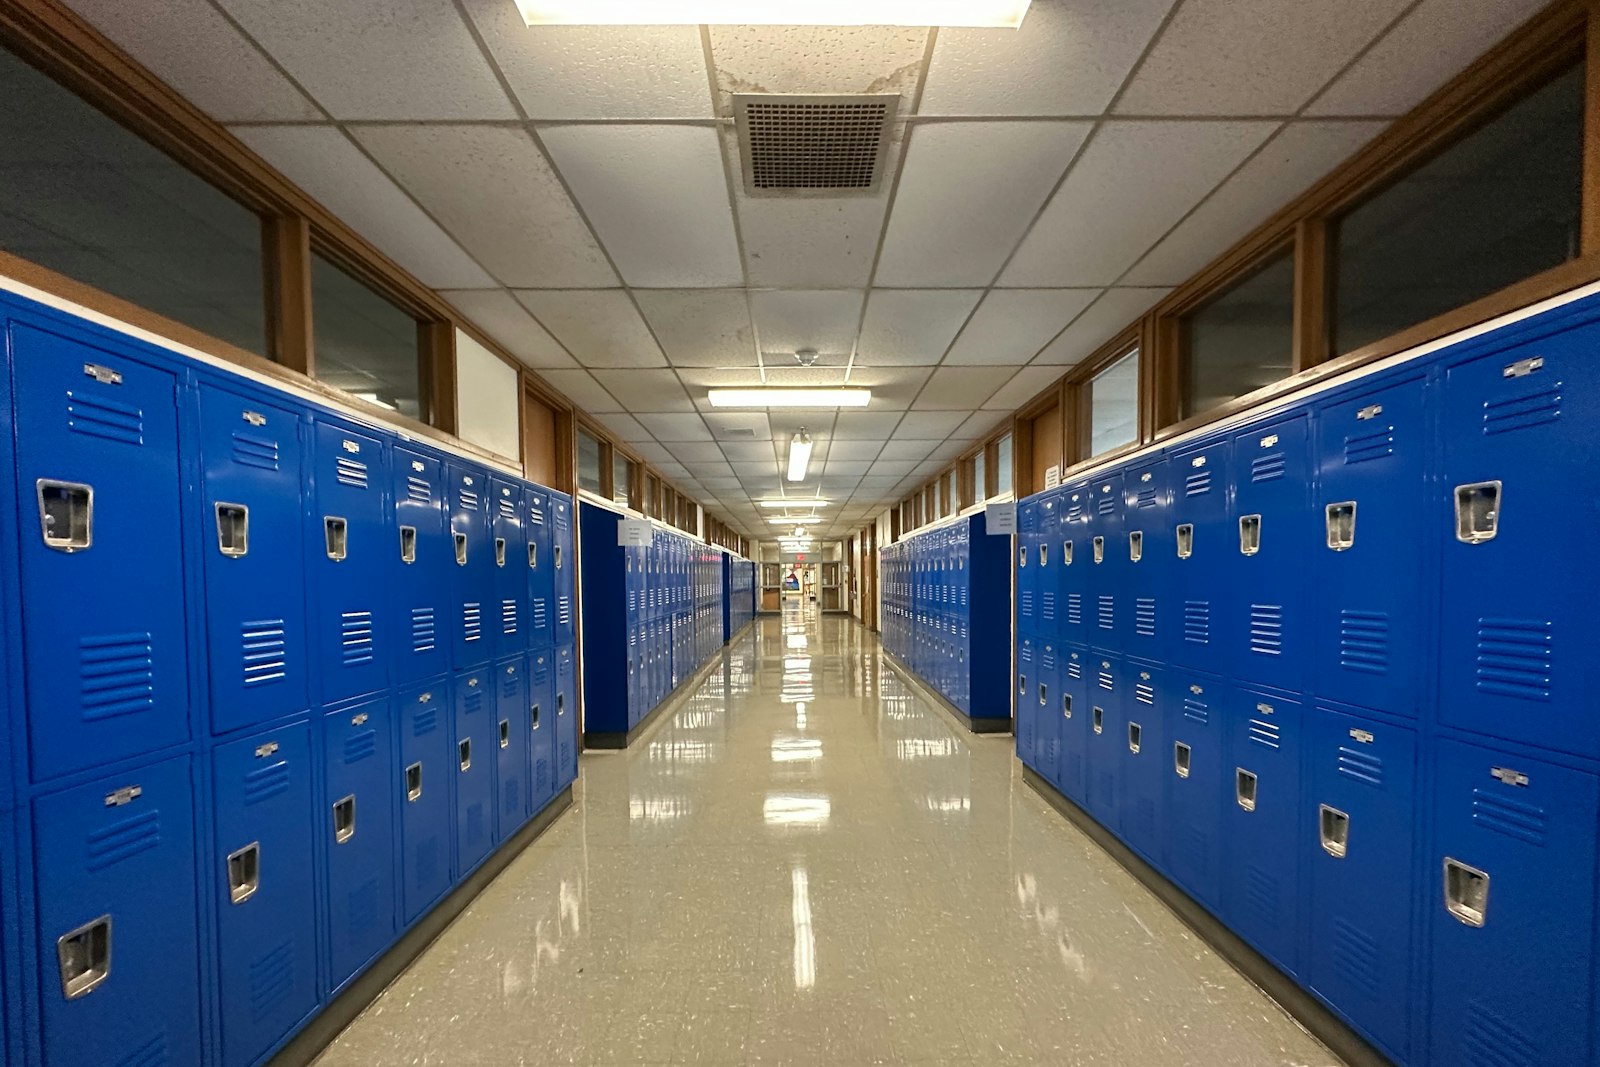
New classrooms after a refurbishment
Refurbished classrooms are tracked through the weeks after fit-out, so they are flushed and ready before pupils move in.
Learn more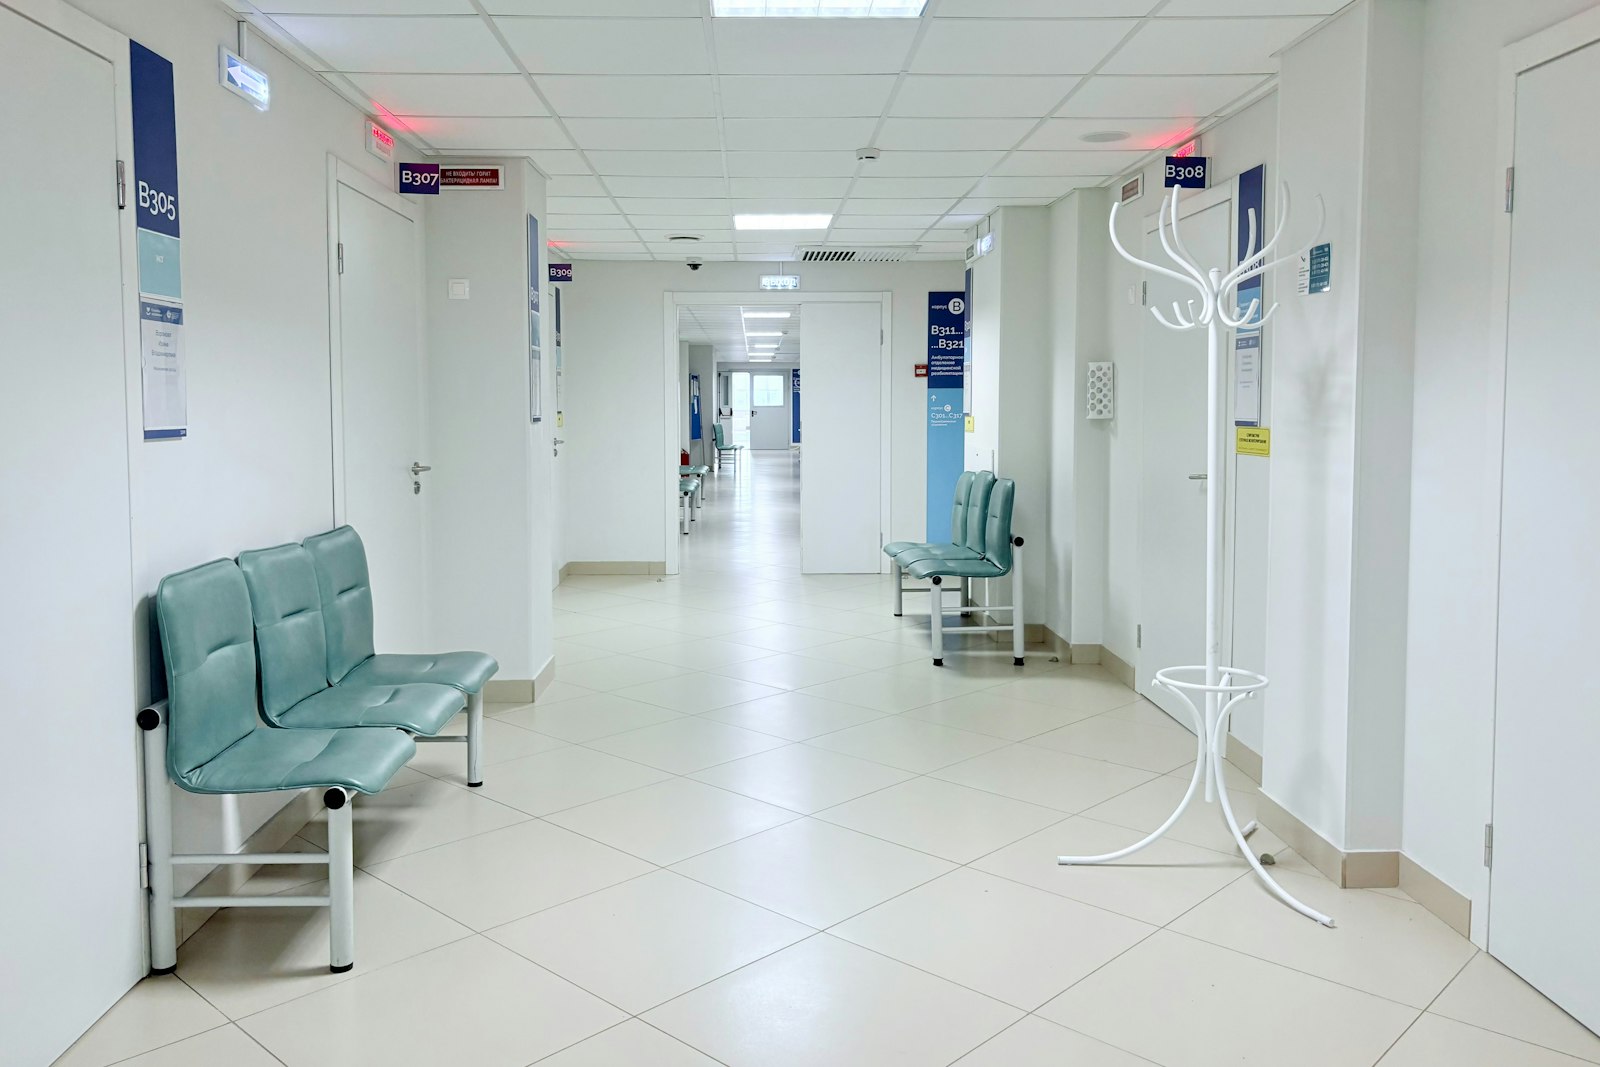
Disinfection without the lingering air
Disinfection cycles are seen as VOC patterns by zone, so ventilation can clear the space before patients return.
Learn moreRelated
Common questions
Volatile organic compounds are gases released by many everyday products and materials, including cleaning agents, paints, adhesives, furnishings and some industrial processes.
It is a relative measure of total VOC level from the sensor, useful for spotting changes and patterns. It does not identify individual compounds.
Cleaning and maintenance often happen after hours. Continuous monitoring shows what that leaves in the air before people arrive.
Where ventilation control is enabled and the owner approves the rule, yes. Every command is logged.
See Aqueduct on your own facility.
Bring a site, a utility bill or a question. We will show you where the loss is.