Local Law 97 compliance data, tracked against the limit all year
Local Law 97 is New York City's building emissions law, setting annual greenhouse gas limits for most buildings over 25,000 square feet, with stricter limits from 2030. Aqueduct meters energy by fuel per building, tracks weather-normalized performance against the limit all year, finds and verifies reductions, and exports the inputs. A registered design professional certifies and files the annual report.

See every building's emissions gap months before the report is due.
Every fuel metered, building by building
- Electricity and gas
Main meters and sub-meters report by interval and roll up by building and fuel.
- Existing meters reused
Pulse splitters let the BMS keep its signal while Aqueduct reads the same meter.
- Bills validated
Metered consumption is compared with utility bills, so the report starts from correct numbers.
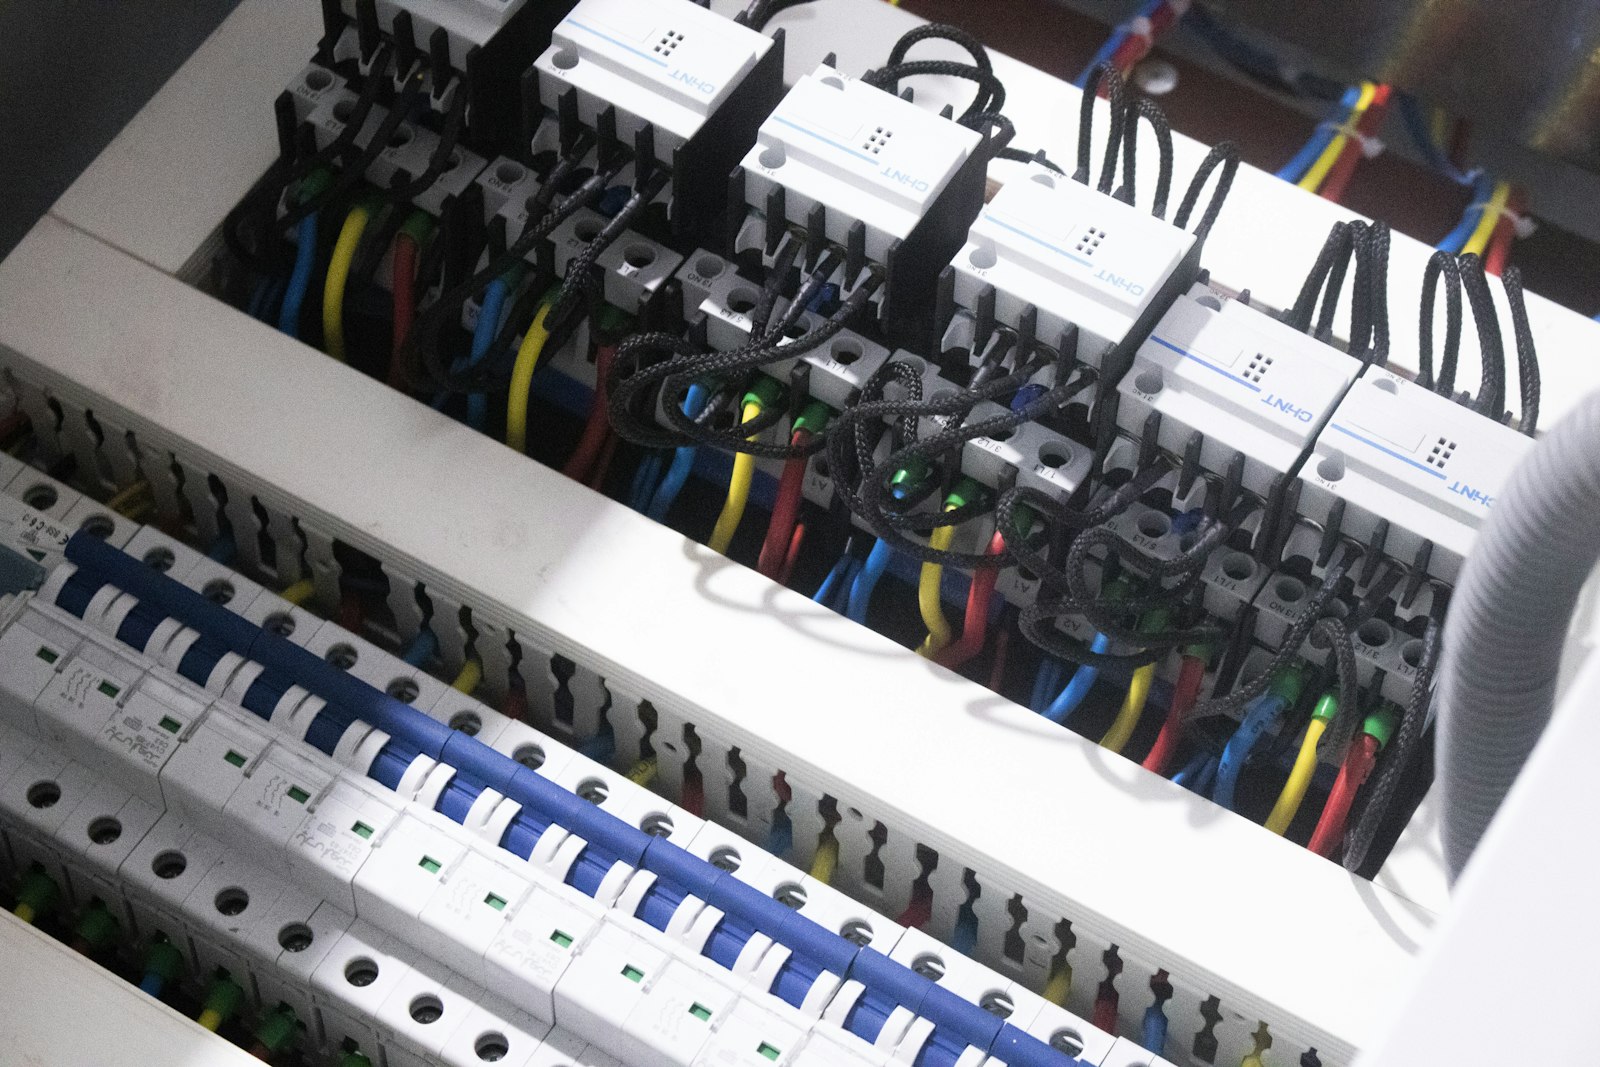
Year-to-date consumption against the path to the limit
- Monthly tracking
Each building's consumption is compared with the path to its annual limit every month.
- Weather separated
Degree day normalization shows whether a rise came from weather or from waste.
- Portfolio ranking
Buildings are ranked by gap, so attention goes to those heading over first.

Every reduction verified before it counts
- Faults found
After-hours HVAC, stuck economizers and simultaneous heating and cooling are diagnosed and routed.
- Owner approved control
Schedules and setpoints change only where control is enabled and the owner approves.
- Verified at the meter
The saving is confirmed at the meter and becomes the new baseline.

Local Law 97, before and after Aqueduct
- The emissions number arrives once a year, after it is too late.
- Gas, electricity and steam bills sit in three different places.
- A hot summer looks the same as a failing chiller.
- Retrofit savings are assumed in the plan and never checked.
- The design professional rebuilds the inputs every spring.
 The Aqueduct way
- The gap to the limit is tracked every month.
- Every fuel is metered and rolled up by building.
- Weather normalization separates weather from waste.
- Each reduction is verified at the meter.
- Inputs export by building and period whenever they are needed.
What Local Law 97 is and who it applies to
Local Law 97 was passed in 2019 as part of New York City's Climate Mobilization Act. It sets annual greenhouse gas emissions limits for most buildings larger than 25,000 square feet, and for groups of buildings on one tax lot that together exceed 50,000 square feet. Limits are set per square foot by occupancy type and calculated from the energy each building uses, by fuel, using emissions coefficients defined in the law.
The first compliance period began in 2024 and the limits tighten significantly from 2030. Owners submit an annual emissions report, certified by a registered design professional, and buildings over their limit face penalties based on the emissions above it. Some building types follow prescriptive measures instead of a numeric limit.
Local Law 97 sits alongside Local Law 84, which requires annual energy and water benchmarking through ENERGY STAR Portfolio Manager. Both depend on accurate consumption by fuel, which is what Aqueduct measures.
Local Law 97 requirement areas and the evidence Aqueduct supplies
Aqueduct supplies measured inputs and tracks the gap. The certified report stays with your design professional.
| Requirement area | Evidence Aqueduct supplies |
|---|---|
| Energy use by fuel | Metered electricity and natural gas by building and month, plus other fuels where meters or delivery records exist |
| Emissions against the limit | Measured consumption tracked month by month so the gap to the annual limit is visible before year end |
| Weather effects | Weather-normalized baselines on cooling and heating degree days, so a hot summer is not mistaken for a failed retrofit |
| Reductions | Savings from fixes and controls verified at the meter |
| Benchmarking under Local Law 84 | Monthly totals by fuel ready for Portfolio Manager |
| Supporting records | Exports by building and period, command history and verified fault closures |
How to comply with Local Law 97 using measured data
Know the gap early, act on it, and prove each reduction.
Meter every fuel
Electricity, gas and steam meters connect over LoRaWAN, Modbus, M-Bus or pulse outputs, building by building. Installation is through partners.
Track the gap monthly
Aqueduct compares year-to-date consumption with the expected path to the limit, so a building heading over is seen in spring, not in May of next year.
Find the reductions
After-hours HVAC, simultaneous heating and cooling, demand peaks and faults are found, priced and routed to your CMMS.
Act where enabled
Schedules and setpoints change where control is enabled, with owner approval, and every command is logged.
Verify and export
Reductions are verified at the meter, and inputs export for the professional who certifies the report.
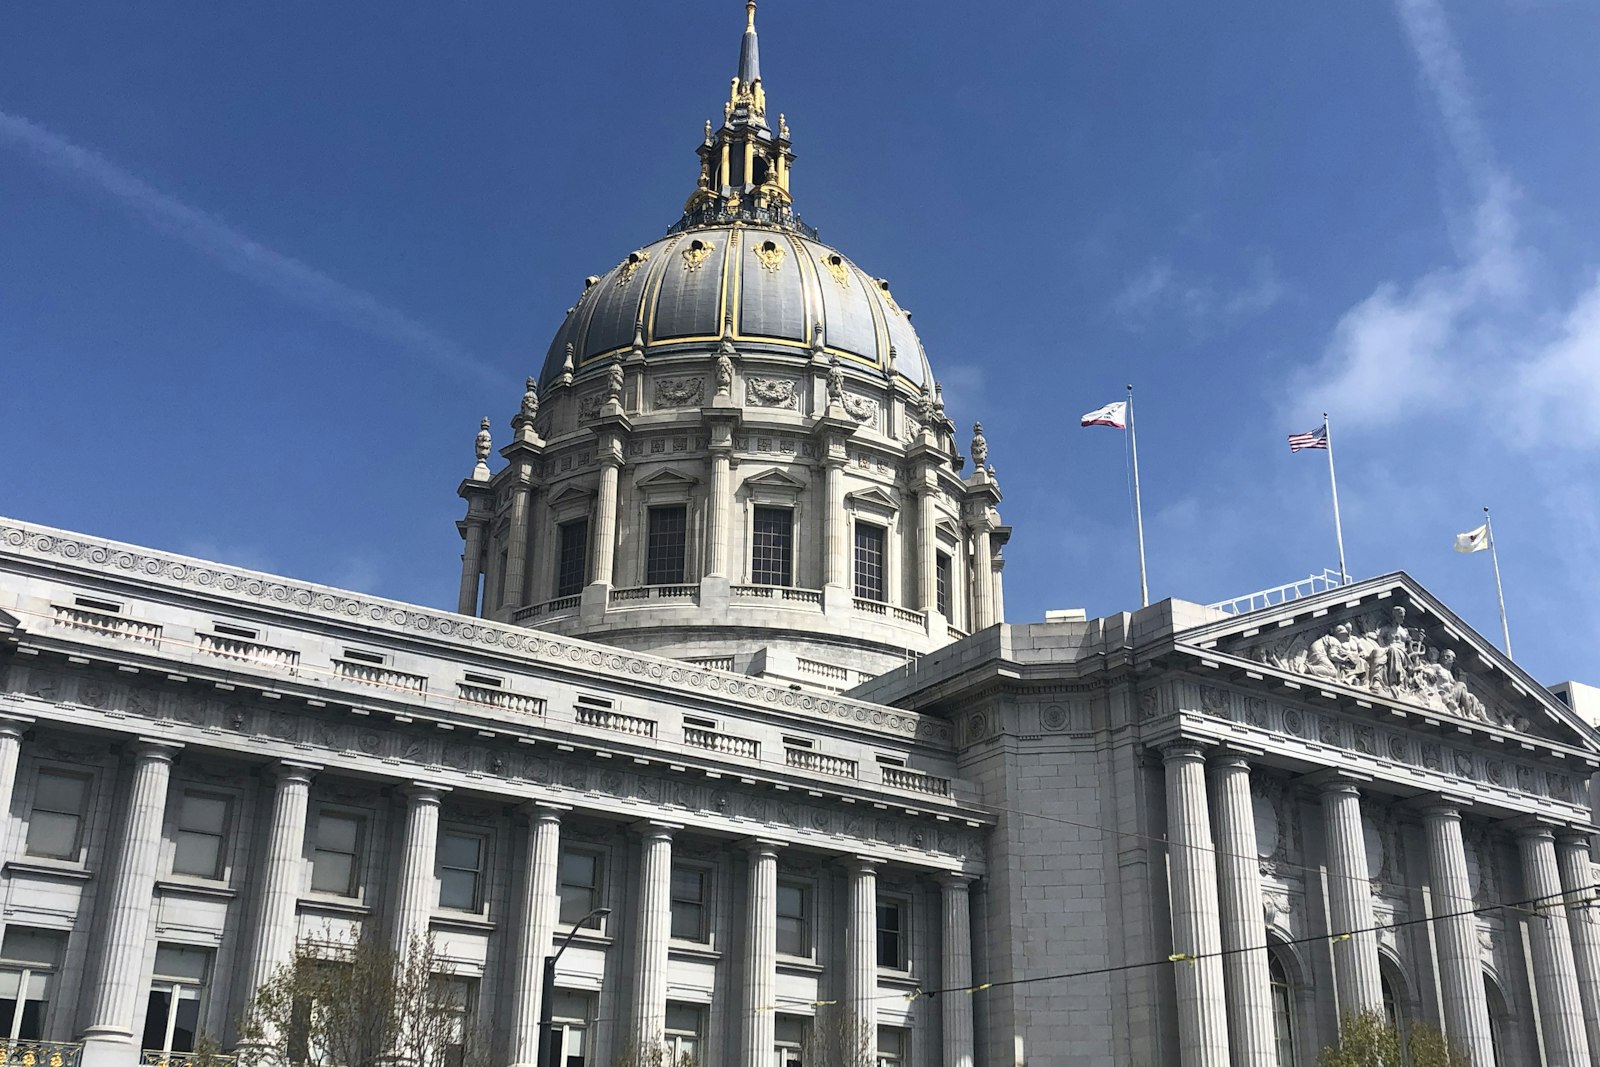
What stays with you and your design professional
Aqueduct is the measurement layer, not the filer.
Emissions calculation and report
The annual report is prepared and certified by a registered design professional and submitted to the city.
Compliance pathway
Choosing retrofits, electrification, credits or other pathways is a decision for owners and their advisors.
Legal interpretation
Rules, deadlines and coefficients are set by the city. Check current guidance for your building.
Related laws and tools
Often handled together in New York.
Where teams put it to work

Large offices facing tighter limits
Office towers with long HVAC hours often have operational waste. Aqueduct finds it, verifies the saving and shows the effect on the emissions gap.
Learn more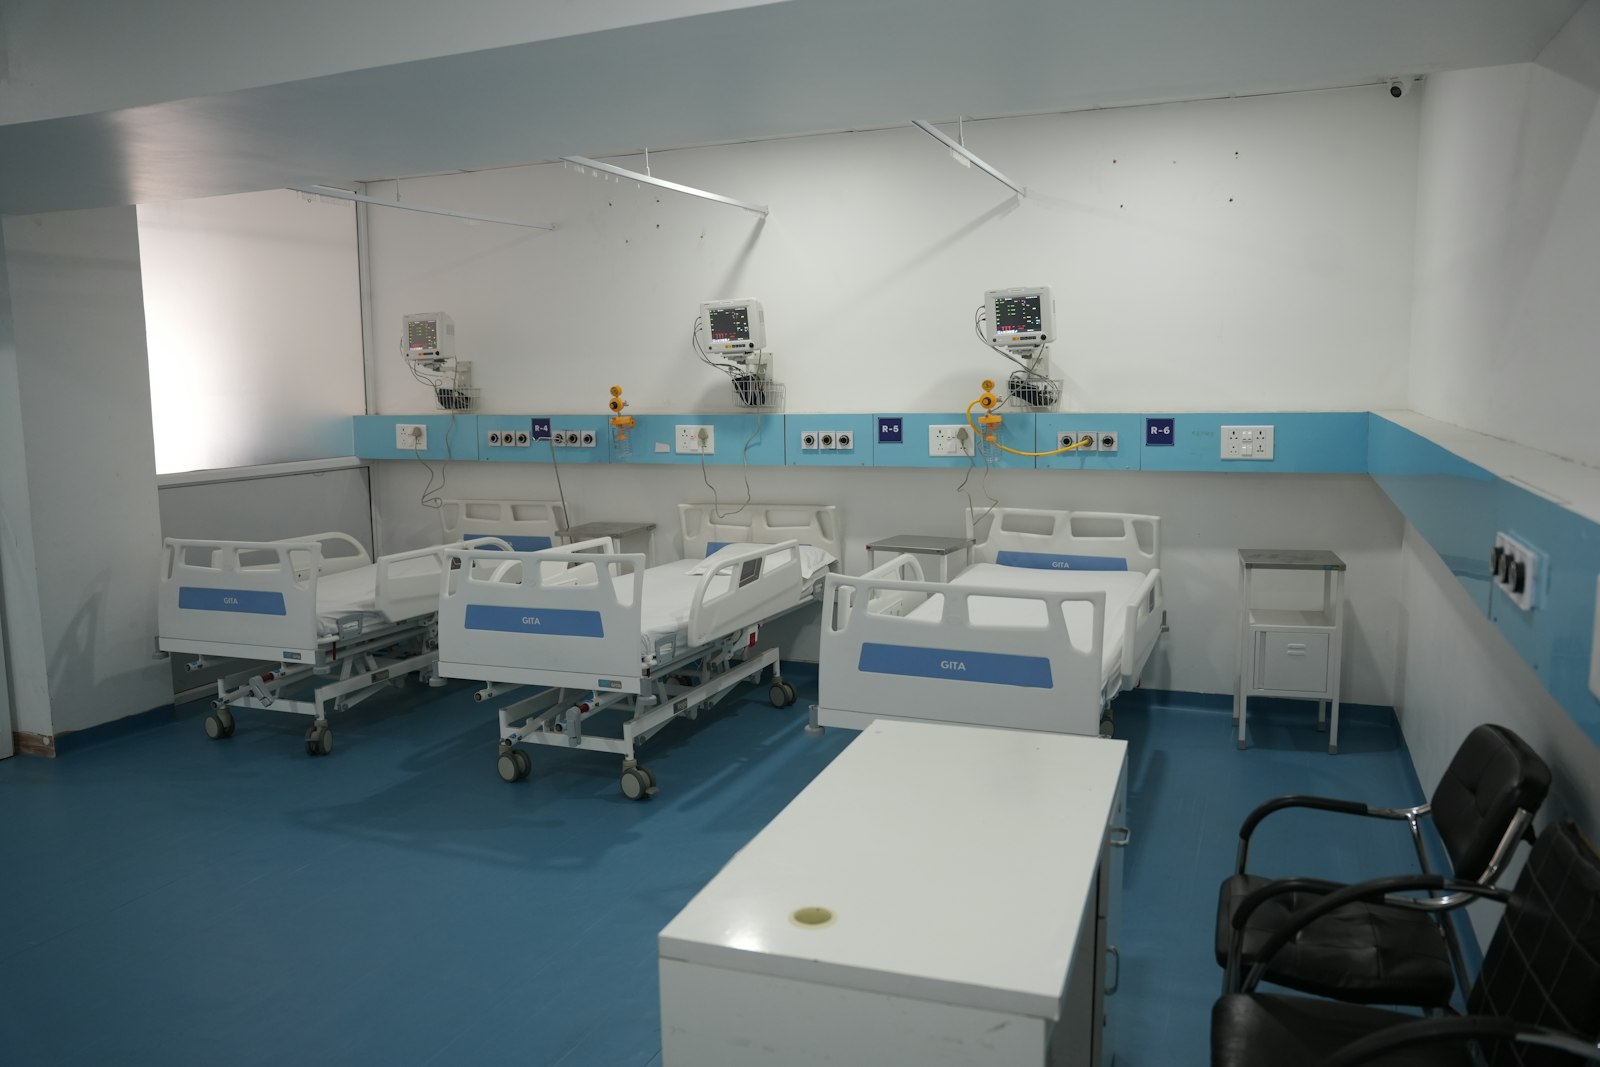
Around the clock plants, measured
Hospitals run plant every hour of the year. Aqueduct meters central plant fuels and finds savings that do not compromise clinical conditions.
Learn more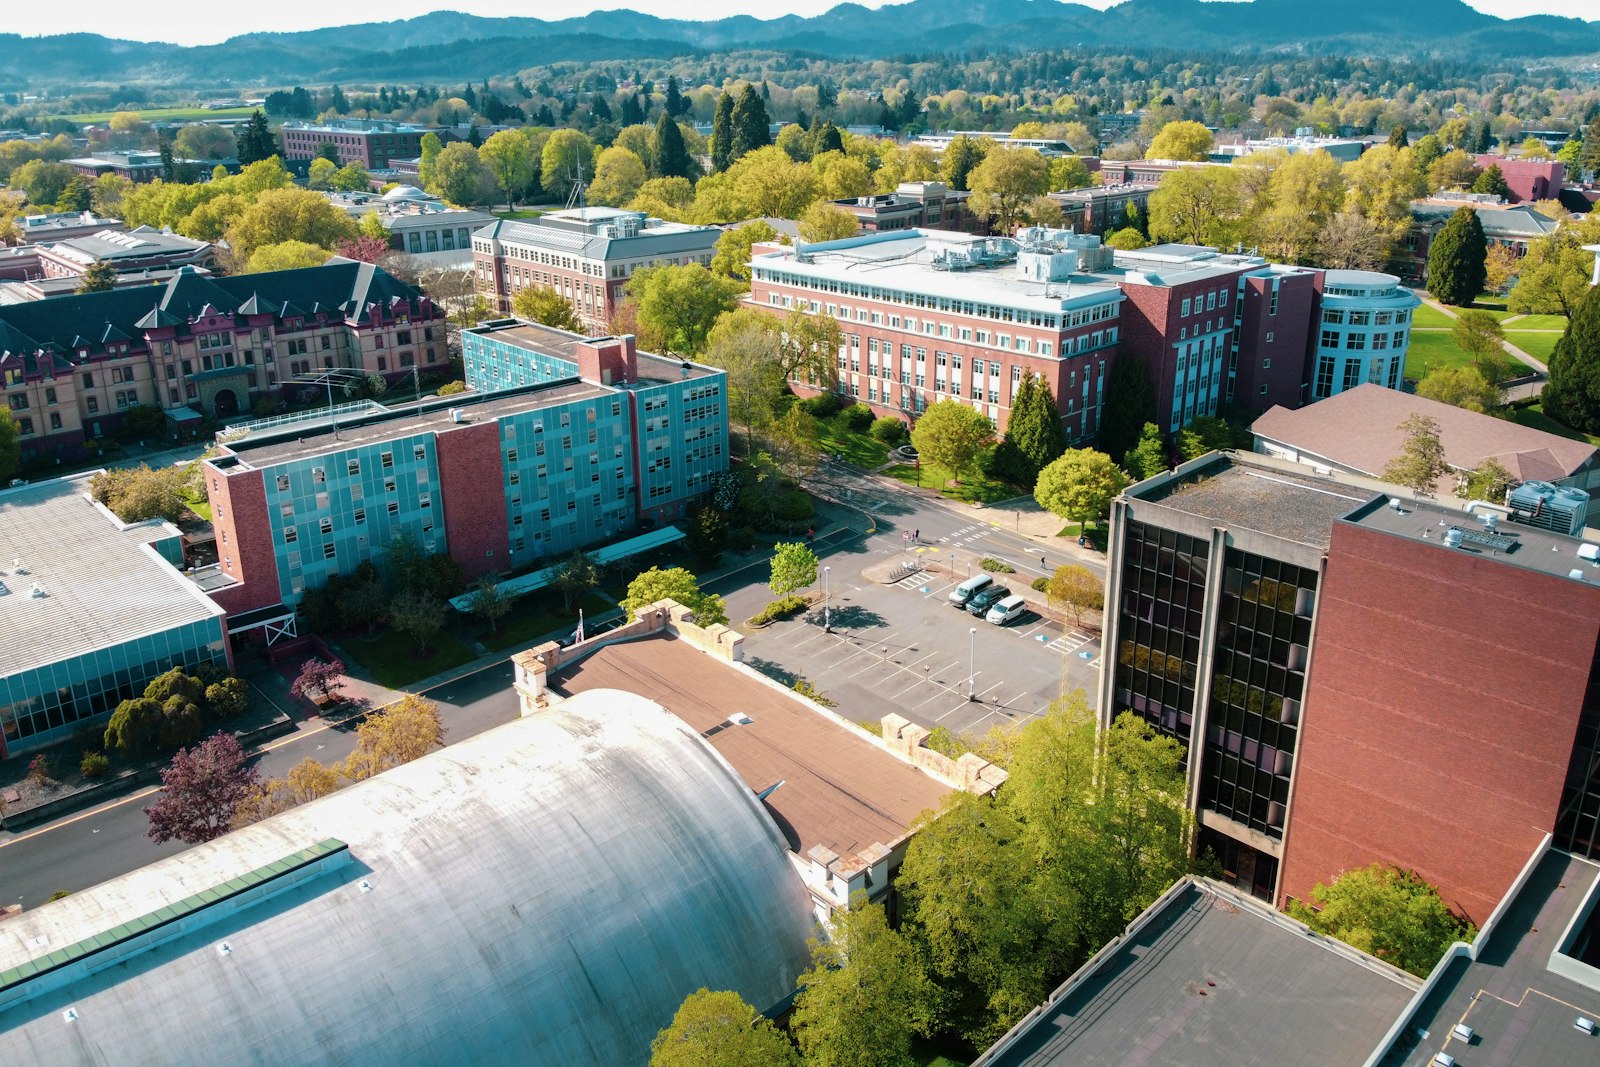
Many buildings on one lot
Campuses with several buildings on one tax lot need consumption per building and in total. Aqueduct reports both from the same meters.
Learn moreThe parts of Local Law 97 that run on measured energy
Local Law 97 turns energy into emissions with coefficients set in the law, then compares them with a limit for your building's occupancy groups. Each step depends on data.
Emissions limits by occupancy group
Each covered building has an annual limit based on its floor area by occupancy group and the limits for each compliance period. Mixed-use buildings combine several limits.
- Floor area per occupancy group
- Limit per compliance period
- Headroom tracked through the year
- Data needed
- area by occupancy group
- Source
- building records and DOB data
- Aqueduct
- limit held per building
Annual energy by fuel
Emissions are calculated from electricity, gas, district steam, fuel oil and other fuels, each with its own coefficient in the law.
- Every fuel metered or billed
- Monthly totals for tracking
- Consistent with LL84 benchmarking
- Data needed
- energy by fuel
- Source
- utility meters, bills, fuel deliveries
- Aqueduct
- monthly energy and emissions by fuel
Year-to-date emissions
The law reports annually, but the year is won or lost month by month. Tracking against the limit shows the gap while there is still time to act.
- Emissions to date against a pro-rated limit
- Weather effects separated from operations
- Forecast to year end
- Data needed
- monthly emissions and weather
- Source
- meters and weather per site
- Aqueduct
- year-to-date tracking against the limit
Operational measures
Schedules, setpoints, ventilation and simultaneous heating and cooling are the cheapest emissions to remove. They need equipment level data to find.
- After-hours HVAC runtime
- Heating and cooling conflicts
- Base load creep
- Data needed
- equipment state and sub-metered load
- Source
- BMS points and sub-meters
- Aqueduct
- faults flagged, control where enabled, with owner approval
Prescriptive pathway for certain buildings
Certain buildings, including some rent-regulated housing, follow a prescriptive pathway of energy conservation measures instead of an emissions limit. Evidence that measures are in place and working still matters.
- Measures listed with install dates
- Before and after consumption
- Heating system schedules
- Data needed
- measure status and effect
- Source
- meters and BMS points
- Aqueduct
- measured before and after per measure
From annual report to monthly control of emissions
A typical path for an owner or manager with one or many covered buildings.
Calculate the position
Upload a year of bills per building to set each building's emissions against its limit for the current and next compliance periods.
Meter the drivers
Connect utility meters and sub-meter heating plant, chillers and major air handlers in buildings near or over the limit.
Remove operational emissions
Act on after-hours running, setpoint drift and heating and cooling conflicts, verifying each saving at the meter.
Hand over to your design professional
Export annual energy by fuel with meter trails so your registered design professional can prepare and certify the report.
Local Law 97 inputs mapped to meters and sensors
Coefficients and limits come from the law and its rules. Aqueduct supplies the measured energy.
| LL97 input | What to measure | Meters and sensors | Aqueduct output |
|---|---|---|---|
| Electricity | Annual grid electricity | Utility meter, main incomers | Monthly kWh and emissions |
| Natural gas | Annual gas use | Gas meter with pulse output | Monthly gas and emissions |
| District steam | Annual steam use | Steam meter or bills | Monthly steam and emissions |
| Fuel oil | Fuel delivered and burned | Tank level or fuel flow where fitted, delivery records | Monthly fuel and emissions |
| On-site generation | Solar or cogeneration output | Generation meters | Generation credited per the rules your professional applies |
| Operational drivers | HVAC runtime and conflicts | BMS points, sub-meters on plant | Fault flags and verified savings |
| Weather | Heating and cooling degree days | Weather per site | Weather-normalized trend |
Where Local Law 97 emissions usually hide
Heating plant running all summer
Boilers kept hot for domestic water or reheat burn gas in months when space heating is off. Gas sub-metering on the plant shows the base load.
Air handlers on overnight
Schedules overridden for a tenant event never return to normal. After-hours runtime shows up immediately in equipment data.
Simultaneous heating and cooling
Perimeter heat fights interior cooling in shoulder seasons. Zone and valve data show the conflict, and each fix is verified at the meter.
Sources1 references cited on this page
sites in 21 countries run on Aqueduct.
and 9 clinics in one of India’s top hospital chains.
US airport running water intelligence on Aqueduct.
of commercial real estate under Aqueduct.
FMCG manufacturing campus.
operations run on Aqueduct.





Related
Common questions
Local Law 97 is New York City's law limiting greenhouse gas emissions from most buildings over 25,000 square feet. Limits are calculated from energy use by fuel and tighten from 2030. Aqueduct supplies the metered energy data and tracks each building against its limit.
Owners measure energy by fuel, reduce emissions to stay under the limit or use an allowed pathway, and file an annual report certified by a registered design professional. Aqueduct handles the measurement and the reductions: it tracks the gap monthly, finds waste, and verifies each saving at the meter.
The first compliance period began in 2024, and limits tighten significantly from 2030. Aqueduct helps owners see now which buildings will exceed the 2030 limits, so retrofits and operational fixes can be planned in time.
No. The annual report is certified by a registered design professional and submitted by the owner. Aqueduct supplies the metered inputs, verified reductions and exports they work from.
Local Law 84 requires annual energy and water benchmarking through ENERGY STAR Portfolio Manager. Local Law 97 sets emissions limits with penalties. Aqueduct supplies the same metered data to both.
Often they help a great deal. Aqueduct finds after-hours HVAC, faults and demand peaks, and verifies each saving at the meter against a weather-normalized baseline. Larger gaps may still need capital projects, which your advisors plan.
Yes. A hot summer or cold winter raises consumption and therefore emissions. Aqueduct normalizes performance with cooling and heating degree days, so you can tell weather from waste.
Multiply monthly energy by fuel by the law's coefficients and compare the running total with a pro-rated limit. Aqueduct does this per building from metered data, with weather separated out.
A registered design professional prepares and certifies the annual report. Aqueduct supplies the measured energy data behind it.
Local Law 88 requires lighting upgrades and tenant sub-metering in many large buildings. Those sub-meters make it easier to find where emissions come from.
Yes. Aqueduct holds every building in one hierarchy so owners see each building's position against its limit side by side.
See Aqueduct on your own facility.
Bring a site, a utility bill or a question. We will show you where the loss is.