ENERGY STAR Portfolio Manager benchmarking, fed by meters instead of bills
ENERGY STAR Portfolio Manager is the US EPA's free online tool for benchmarking building energy and water use, and the basis for the 1 to 100 ENERGY STAR score. Many city benchmarking laws require it. Aqueduct supplies monthly metered consumption by fuel and building, validated against bills, so your benchmarking entries and filings rest on meters. Your team or consultant submits.
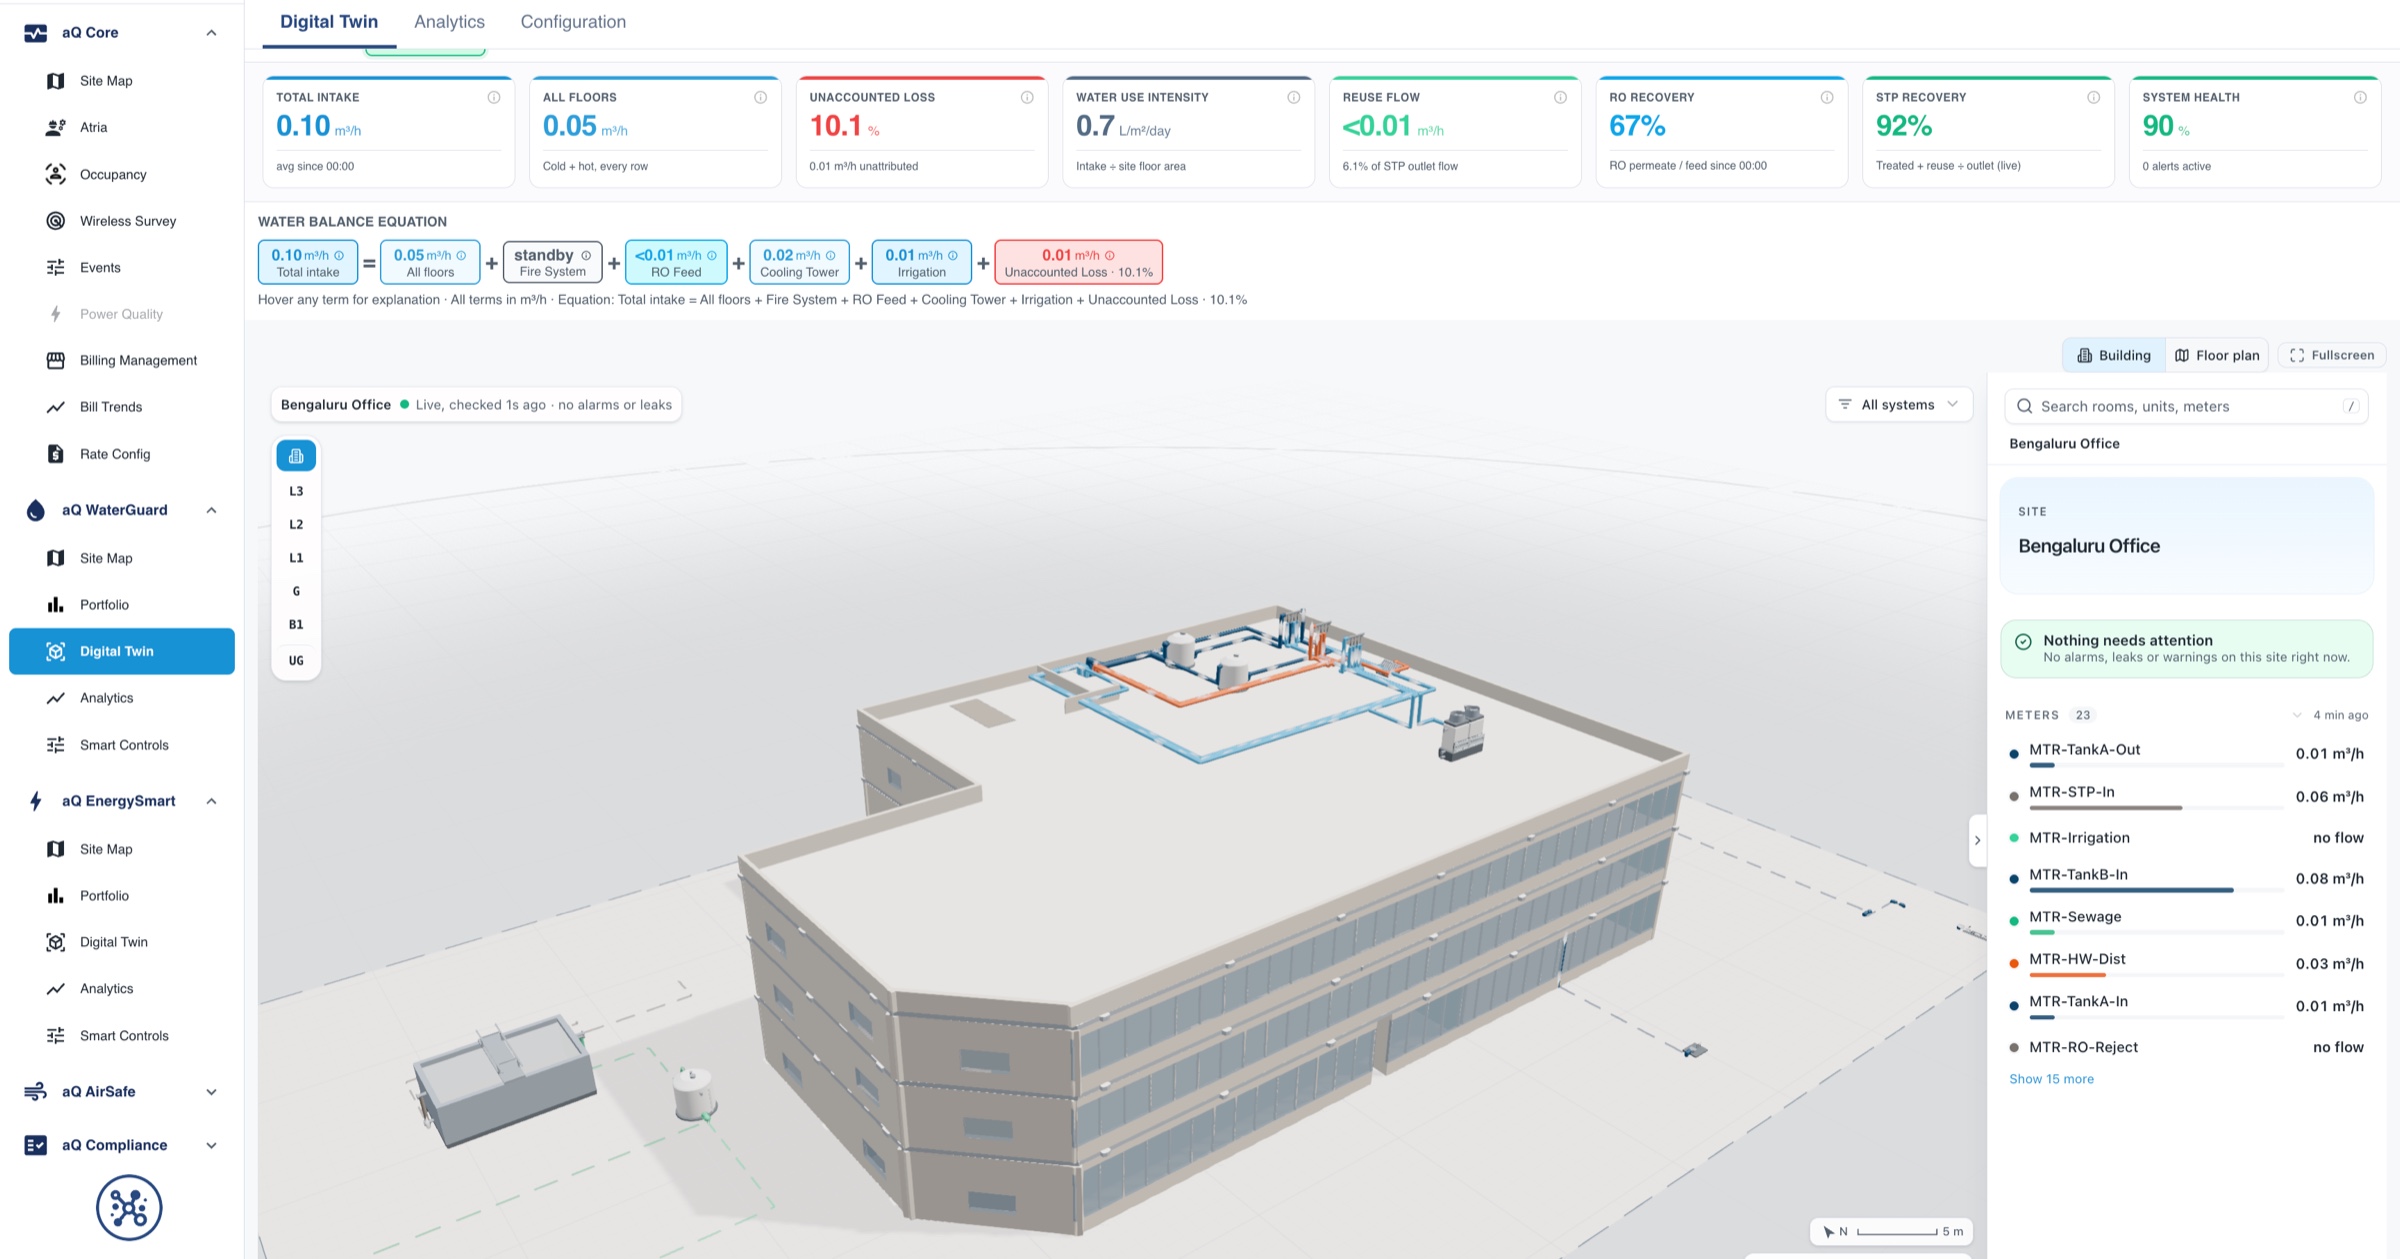
Benchmarking that reflects what your buildings actually used, every month of the year.
Monthly totals by building and fuel, without the bill hunt
- Electricity and gas
Main meters report by interval and roll up to the monthly totals benchmarking expects.
- Water included
Metered water by building is reconciled in a live balance before it is exported.
- Existing meters read
Pulse outputs, Modbus and camera readers bring legacy meters onto the same data layer.

No missing months and no estimated bills in the score
- Bills validated
Billed consumption is compared with metered consumption, so supplier errors are caught early.
- Gaps found early
Device health shows a meter that stopped reporting in the month it happened.
- Usage or rate
Cost changes are split into usage and rate, so a price rise is not mistaken for waste.
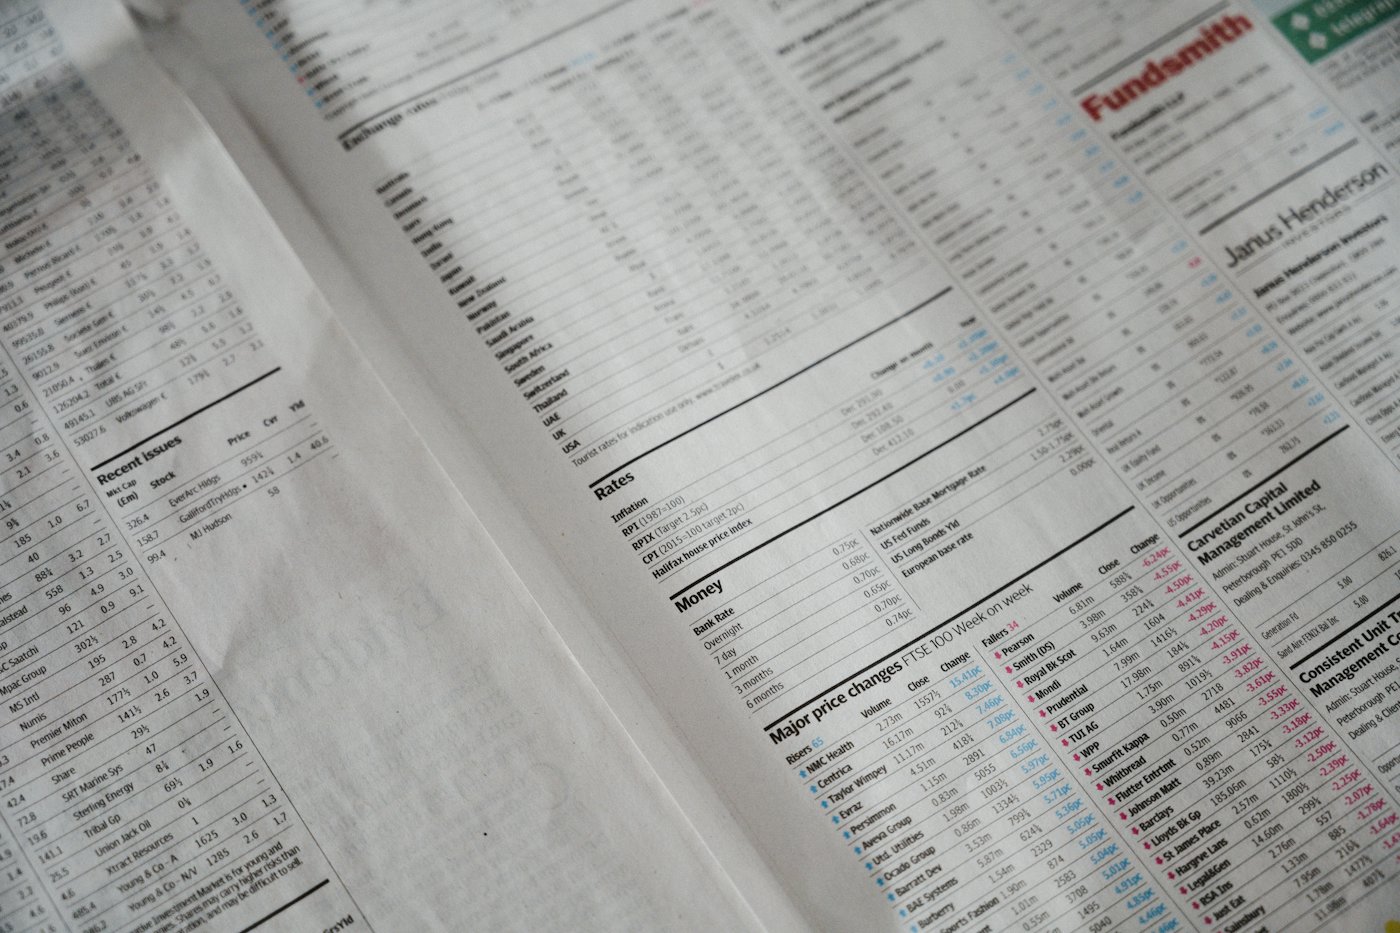
Improvement found, acted on and verified
- Waste identified
After-hours HVAC, leaks and demand peaks become findings with the asset and cost attached.
- Work routed
Tickets go into your CMMS with a recommended fix, and closures are read back.
- Savings verified
The meter confirms the result, so the next benchmark reflects real improvement.
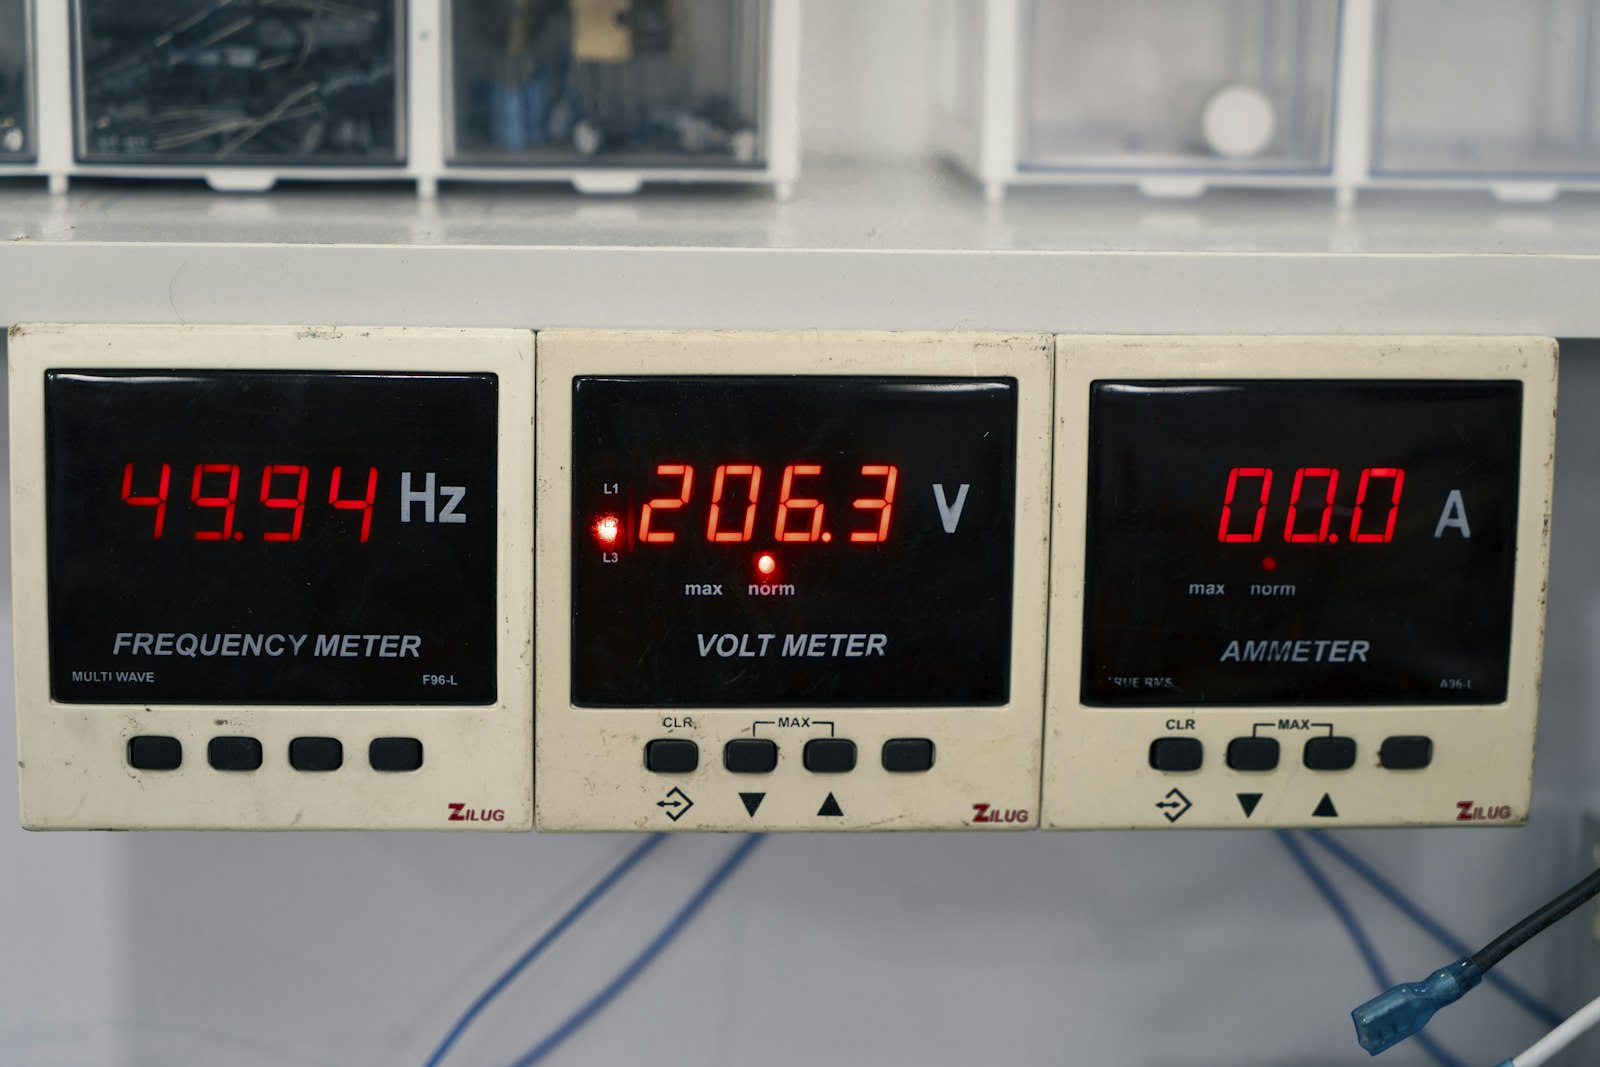
Benchmarking, before and after Aqueduct
- Bills for every fuel are chased weeks before the deadline.
- Estimated bills slip into the score unnoticed.
- A dead meter is discovered when the year is already gone.
- Water is left out because nobody has the numbers.
- The score drops and nobody can say which building caused it.
 The Aqueduct way
- Monthly totals by fuel are ready before the deadline.
- Bills are validated against meters before they count.
- Device health flags a dead meter the same month.
- Water is metered and reconciled by building.
- Findings name the building, the asset and the cost.
What Portfolio Manager is and who uses it
ENERGY STAR Portfolio Manager is an online tool run by the US Environmental Protection Agency. Owners and managers enter property details and monthly energy and water consumption, and Portfolio Manager calculates metrics such as energy use intensity, greenhouse gas emissions and, for eligible property types, a 1 to 100 ENERGY STAR score that compares a building with similar buildings nationwide.
A score of 75 or higher means a building performs better than at least 75% of its peers and can apply for ENERGY STAR certification, which requires the application to be verified by a licensed professional. Many US city and state benchmarking laws, such as New York City's Local Law 84, require large buildings to report through Portfolio Manager every year.
The tool is only as good as the data entered. Missing months, estimated bills and unmetered fuels are the most common reasons a score is wrong or a filing is late.
Portfolio Manager requirement areas and the evidence Aqueduct supplies
Aqueduct keeps the inputs complete and measured. Your team owns the account and the submission.
| Requirement area | Evidence Aqueduct supplies |
|---|---|
| Monthly energy by fuel | Metered electricity and gas by building and month, with therms or cubic meters as the utility reports |
| Complete 12-month periods | Continuous data with device health, so gaps are found and filled before the filing |
| Water use | Metered water by building, reconciled in a live water balance |
| Bill accuracy | Bill validation compares billed consumption against metered consumption |
| Property use details | Floor area and occupancy recorded per site, used for intensity metrics |
| Performance improvement | Weather-normalized baselines and savings verified at the meter |
How Aqueduct supplies Portfolio Manager data
Benchmarking as a by-product of running the building.
Meter every fuel
Electricity, gas and water meters connect over LoRaWAN, Modbus, M-Bus, pulse outputs or camera meter readers. Installation is through partners.
Validate against bills
Utility bills are uploaded and compared with metered consumption, so billing errors are caught before they reach a score.
Close the gaps
Device health shows any meter that stopped reporting, so a missing month is fixed in the month, not at the deadline.
Export monthly totals
Monthly consumption by building and fuel exports for entry or upload into Portfolio Manager by your team.

A benchmark should measure the building, not the paperwork behind it.
Talk to our teamWhat stays with your team
Portfolio Manager is your account and your filing.
Account and property setup
Your team owns the Portfolio Manager account, property records and sharing with city portals.
Submissions and filings
Benchmarking reports to a city or state are submitted by the owner or their consultant.
Certification application
ENERGY STAR certification requires verification by a licensed professional. Aqueduct does not certify buildings.
Related programs
Benchmarking feeds many of these.
Where teams put it to work

Benchmarking across many buildings at once
A commercial real estate client with a 20M+ sq ft portfolio needs every building benchmarked on time. Aqueduct keeps monthly totals measured and complete.
Learn more
Benchmarking the city's own buildings
Cities with benchmarking ordinances often benchmark municipal buildings too. Aqueduct supplies metered energy and water per building for those filings.
Learn more
Campus buildings scored fairly
Universities benchmark residence halls, labs and offices separately. Aqueduct meters each building so scores reflect real use, not campus averages.
Learn moreThe Portfolio Manager inputs that decide your score
A Portfolio Manager score is only as good as its inputs. These are the fields that most often go wrong, and the measured data that fixes them.
Energy meters and fuels
Every fuel serving the property must be entered as a meter with complete monthly data. Missing a fuel, or double counting a sub-meter, distorts the score.
- All fuels: electricity, gas, district steam, chilled water, fuel oil
- No gaps or overlaps between bill periods
- Sub-meters excluded or included consistently
- Data needed
- 12 months per fuel
- Source
- utility meters and bills
- Aqueduct
- monthly totals by fuel with gaps flagged
Property uses and use details
The score compares your building with similar ones, adjusted for use details such as operating hours, workers, computers and climate. Wrong use details move the score more than most retrofits.
- Correct property type for each area
- Operating hours from actual occupancy
- Use details updated when tenants change
- Data needed
- operating characteristics
- Source
- occupancy sensors and your records
- Aqueduct
- measured occupancy hours
Gross floor area
Energy intensity divides by gross floor area. Area errors, such as counting parking or missing a wing, change EUI directly.
- Area by property use
- Consistent area across years
- Parking handled per guidance
- Data needed
- measured areas
- Source
- drawings and leases
- Aqueduct
- area held per site in aQ Core
Water meters
Portfolio Manager tracks indoor and outdoor water, and many benchmarking laws now ask for it. Water data also reveals leaks before the bill does.
- Indoor and irrigation water separated
- Monthly totals for the year
- Leaks visible in the trend
- Data needed
- water by use
- Source
- main and irrigation meters
- Aqueduct
- water totals with leak flags
Data quality checks
The built-in data quality checker flags missing months, outliers and unusual values. Fixing them before a filing deadline is slow when the data lives in bills.
- Missing or overlapping meter entries
- Values far from expected
- Estimated reads flagged
- Data needed
- complete, plausible data
- Source
- the measured dataset
- Aqueduct
- gaps and outliers found the month they happen
Portfolio Manager fields mapped to meters and sensors
Aqueduct supplies the measured values. You or your benchmarking provider enter or exchange them with Portfolio Manager.
| Portfolio Manager field | What to measure | Meters and sensors | Aqueduct output |
|---|---|---|---|
| Electric meter | Grid electricity by month | Utility meter, main incomer | Monthly kWh with interval detail |
| Natural gas meter | Gas by month | Gas meter with pulse output | Monthly volume or energy |
| District energy meters | Steam, hot or chilled water | Thermal energy meters | Monthly thermal energy |
| On-site solar | Generation used on site | Inverter or generation meter | Monthly generation |
| Water meters | Indoor and outdoor water | Main and irrigation meters | Monthly water by use |
| Operating hours | Actual hours of use | Occupancy sensors | Measured occupied hours |
| Weather | Local climate | Weather per site | Weather-normalized EUI for comparison |
From annual scramble to monthly benchmarking
For owners filing city benchmarking reports or pursuing ENERGY STAR certification.
Audit the property records
Check property uses, areas and meters in Portfolio Manager against the building as it is today.
Connect meters
Connect utility and sub-meters to Aqueduct and upload bills for the months before meters went live.
Review and correct
Review monthly totals, outliers and gaps in Aqueduct, then update Portfolio Manager so the score is never a surprise.
Submit and verify
Run the data quality checker, generate the benchmarking report and, for certification, have a licensed professional verify the application.
The input errors that move a score most
A missing fuel
District steam or a second gas meter left out makes a building look better than it is, until someone finds it. A complete meter register prevents it.
Double counted sub-meters
A tenant sub-meter entered alongside the main meter counts the same energy twice. Aqueduct maps each sub-meter to its parent so totals add up once.
Stale use details
Operating hours and worker counts entered years ago no longer match the building. Measured occupancy gives current values.
Sources1 references cited on this page
sites in 21 countries run on Aqueduct.
and 9 clinics in one of India’s top hospital chains.
US airport running water intelligence on Aqueduct.
of commercial real estate under Aqueduct.
FMCG manufacturing campus.
operations run on Aqueduct.




Related
Common questions
ENERGY STAR Portfolio Manager is the US EPA's free online tool for tracking and benchmarking building energy and water use. It calculates energy use intensity, emissions and, for eligible buildings, a 1 to 100 ENERGY STAR score. Aqueduct supplies the metered monthly consumption it needs.
A building needs a score of 75 or higher, meaning it performs better than at least 75% of similar buildings nationwide. The application must be verified by a licensed professional. Aqueduct supplies measured data; it does not certify buildings.
Many US cities and several states require large buildings to benchmark through Portfolio Manager, including New York City under Local Law 84. Rules change, so check your jurisdiction. Aqueduct keeps the metered data ready for each filing.
Aqueduct exports monthly metered consumption by building and fuel for your team to enter or upload into Portfolio Manager. The account, property records and submissions stay with the owner or consultant.
The most common causes are missing months, estimated bills, unmetered fuels and incorrect floor area or use details. Aqueduct reduces data errors by metering each fuel, validating bills against meters and flagging gaps through device health.
Aqueduct finds waste such as after-hours HVAC, leaks and demand peaks, routes fixes to your CMMS, and verifies the saving at the meter against a weather-normalized baseline, which then shows up in the benchmark.
Yes. Portfolio Manager accepts water consumption, and some benchmarking laws require it. Aqueduct meters water by building and reconciles it in a live water balance.
Monthly updates keep the score current and catch data quality issues early. Aqueduct provides monthly totals by fuel, so updates take minutes rather than an annual rebuild.
A licensed professional, such as a professional engineer or registered architect, verifies the application. Aqueduct supplies the measured data they review.
Scores move with changes in use details, area, national reference data and weather. Check those inputs first, and compare with Aqueduct's weather-normalized trend.
Enter meters so total property energy is counted once. Sub-meters are useful for tenant spaces and diagnosis, but must not double count with the main meter.
See Aqueduct on your own facility.
Bring a site, a utility bill or a question. We will show you where the loss is.