
Airport utility monitoring, from the central plant to the gate and the water mains
Airport utility monitoring covers the central utility plant, the preconditioned air and ground power at gates, and the water mains that serve a campus that never closes. Aqueduct measures chiller and boiler efficiency, PCA and GPU use per gate, and a live water balance across terminals, cargo and support buildings, then finds losses, routes fixes and verifies results at the meter.
One live balance for the plant, the gates and every water main across the campus.
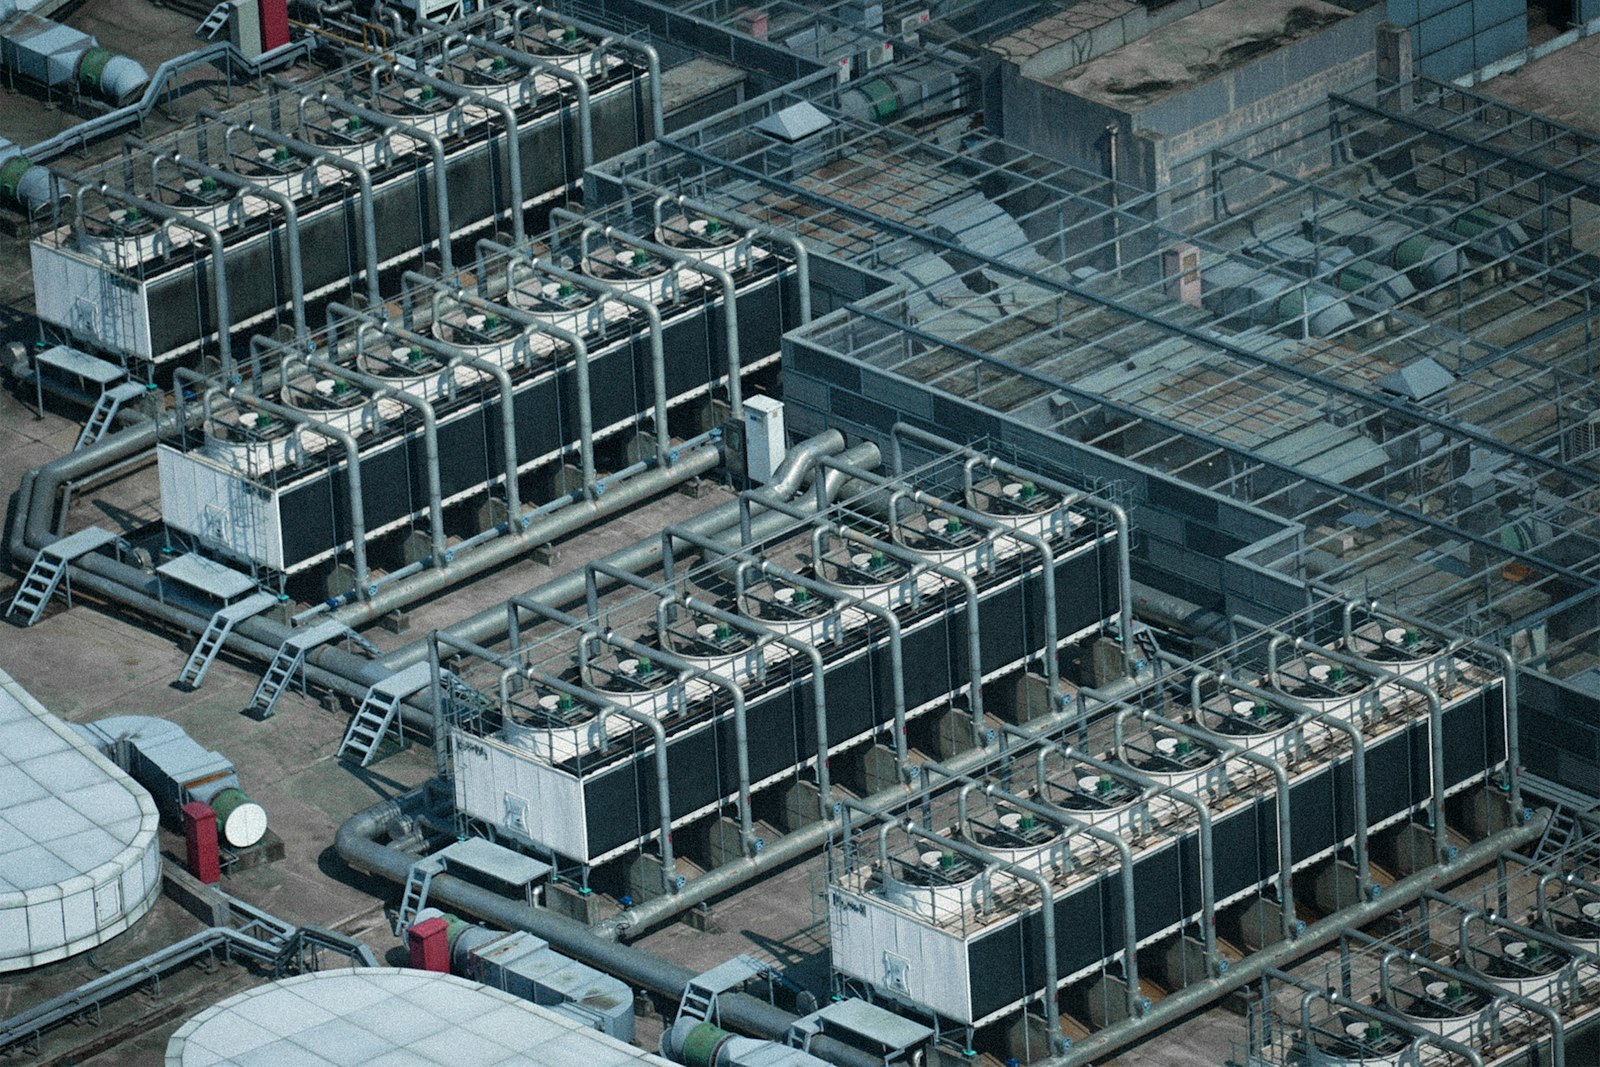
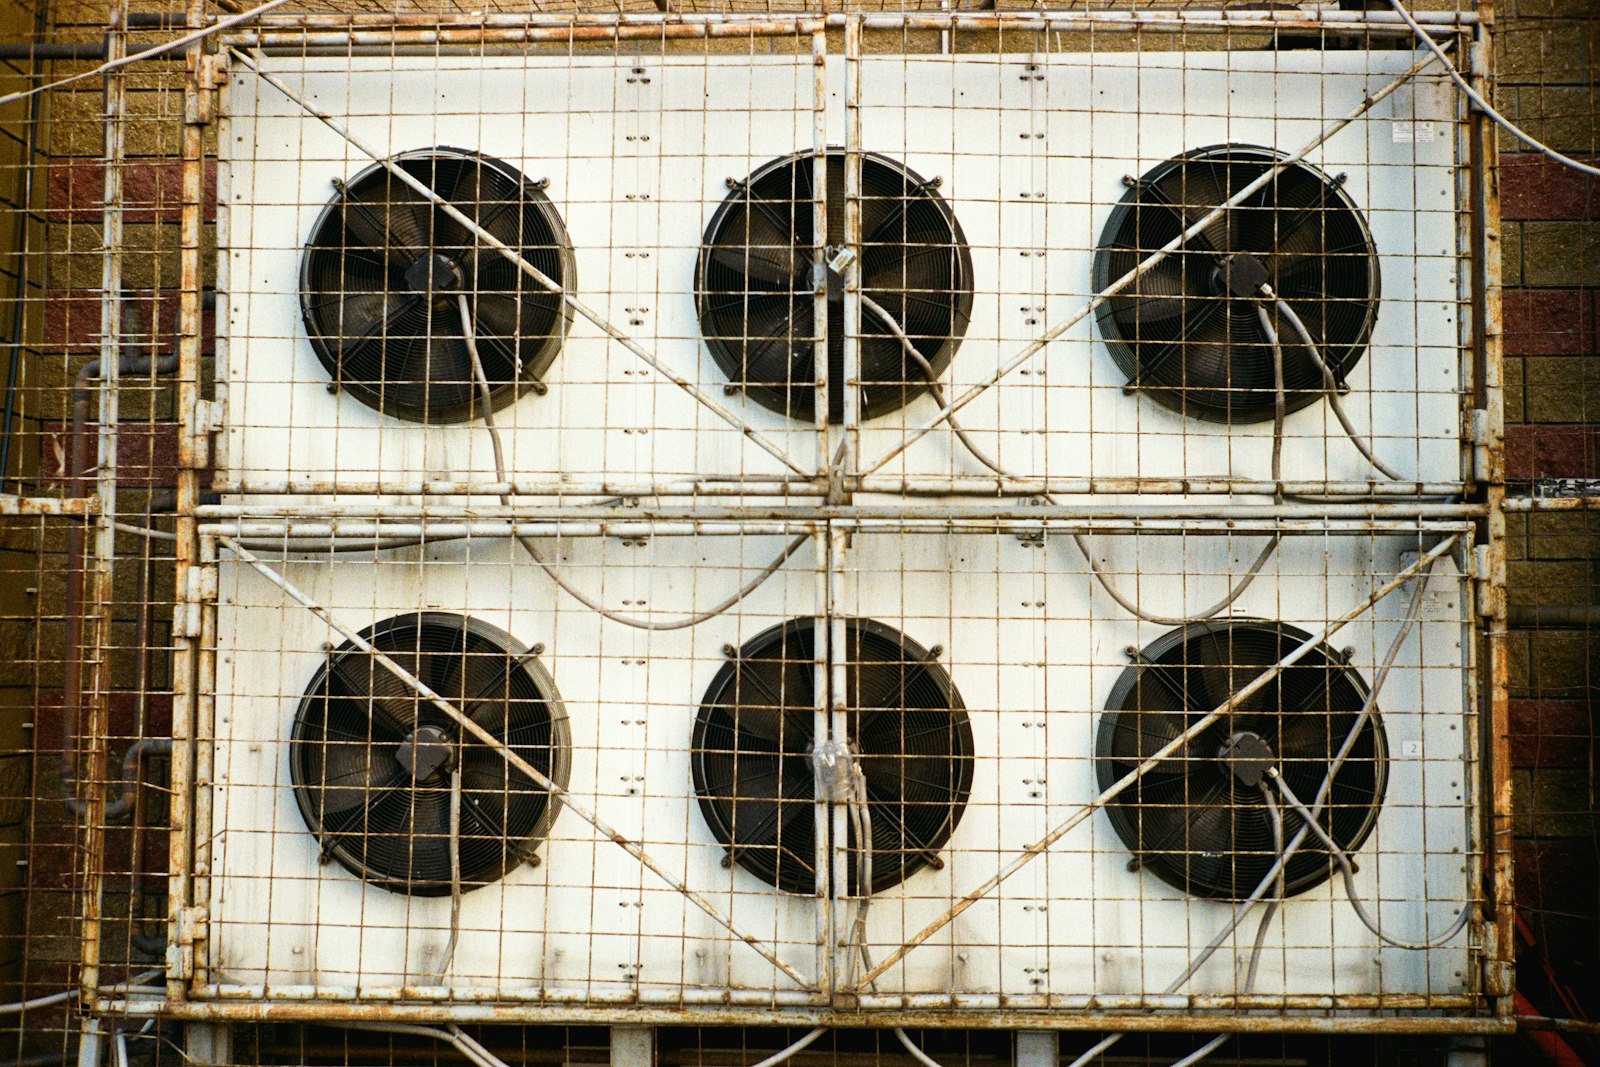
Chiller and boiler plant measured against the load it serves
- Plant efficiency
kW per ton comes from chiller, pump and tower power against cooling from BTU meters.
- Delta T by building
Supply and return temperatures by building show which loads push the plant hardest.
- Early signs of failure
aQ PredictIQ reads vibration and energy drift on chillers, pumps and fans before they fail.
PCA and ground power that switch off with the aircraft
- Per gate metering
Preconditioned air and ground power units are metered by gate and matched to gate use.
- Idle running flagged
Units still running after pushback are flagged with the gate and the duration.
- Peak demand
Gate loads are shown with the plant and terminal loads behind each peak.
Water mains balanced across terminals, cargo and support buildings
- Live water balance
Supply points reconcile against building and zone meters every interval on the water twin.
- Loss with a location
When the balance stops closing, the gap is narrowed to a zone, main or building.
- Around the clock
Anomalies are flagged day and night and routed to the team that owns the area.

Airport utilities, before and after Aqueduct
- Plant efficiency is a commissioning figure from years ago.
- Gate units keep running after the aircraft has gone.
- Water mains are read manually, and leaks run for months.
- Nothing can shut down long enough to install new systems.
- Utility bills arrive with no breakdown behind them.
 The Aqueduct way
- kW per ton is measured continuously from plant and BTU meters.
- Idle gate units are flagged with the gate and duration.
- A live water balance gives every loss a location.
- Existing meters and systems are read as they are.
- Every building, gate and main carries its own number.
Airport utilities Aqueduct measures
Existing meters, BMS and plant controllers are read first. Airfield and operations systems stay separate.
| System | Measured | What Aqueduct derives |
|---|---|---|
| Central utility plant | Chiller and boiler power and fuel, BTU meters, pump and tower power, make-up water | kW per ton, plant efficiency, delta T and tower water use |
| Chilled and hot water distribution | Supply and return temperatures and flow by building | Which buildings drive the plant, and low delta T at each |
| PCA and GPU at gates | Power per unit, run status, gate occupancy where shared | Units running at empty gates, energy per turn where data allows |
| Water mains and services | Flow at supply points, building and zone meters, pressure | A live campus water balance with unaccounted loss by zone |
| Cargo, maintenance and support buildings | Utility meters and BMS points | Baselines per building and after-hours load |
Why airport utilities are hard to see
An airport is a small city that never sleeps, with infrastructure laid down over decades.
A central plant nobody benchmarks
Chillers and boilers serve every terminal, but plant efficiency is a commissioning figure, not a weekly measurement.
Gate equipment left running
Preconditioned air and ground power units keep running after the aircraft has pushed back.
Water mains with no balance
Water spreads across terminals, cargo and support buildings through aging mains, read manually or not at all.
No downtime for change
Nothing can be shut down to install a new system, so anything new must work over what is already there.
A campus that never closes needs utilities that are watched the same way.
Talk to our teamHow Aqueduct runs airport utilities
Monitor, Measure, Identify, Act, Verify, across a campus that never closes.
Map the campus
Terminals, concourses, plant, cargo and support buildings are set up in aQ Core, so every meter point belongs to a place.
Connect what exists
Existing meters and systems are read as they are, with no rip and replace of older infrastructure.
Balance and baseline
aQ WaterGuard reconciles supply against use by zone, and aQ EnergySmart baselines the plant against weather and load.
Detect and route
Leaks, plant drift and gate equipment left running are flagged around the clock and routed to the team that owns the area.
Verify
The meter confirms the loss stopped or the plant recovered. The verified result becomes the new baseline.
Where it fits at an airport
- Manual meter reading rounds
- Water management systems
- Energy management systems
- CMMS
- EAM
- BMS and plant controllers
- SCADA, read only
Airfield lighting, security and airport operations systems stay separate. We don't sell hardware as our core business. Installation is through partners.
Where teams put it to work

Leaks found by the balance, not the bill
Supply points and zone meters reconcile continuously, so a main or service leak shows as unaccounted loss with a location.
Learn more
Chillers and towers run to the load
Plant efficiency, delta T and tower make-up are tracked together, so drift and low delta T are caught early.
Learn more
Hangars, cargo sheds and offices baselined
Every support building gets a weather normalized baseline and an after-hours load check, so waste outside the terminal is seen too.
Learn moreRelated
Common questions
It is the continuous measurement of the energy and water systems that serve an airport, from the central utility plant and gate equipment to water mains and support buildings. Aqueduct adds baselines, a live water balance, fault detection and verified results on one platform.
By metering supply points and building or zone meters, then reconciling supply against use continuously. When the balance stops closing, the gap is unaccounted loss with a location. Aqueduct runs this live across the campus instead of waiting for manual reads.
Preconditioned air, or PCA, supplies conditioned air to a parked aircraft, and a ground power unit, or GPU, supplies electrical power, so the aircraft can avoid running its auxiliary power unit. Aqueduct meters both per gate and flags units left running at empty gates.
Yes. Aqueduct calculates kW per ton and plant efficiency from chiller, pump and tower power against cooling delivered from BTU meters, and tracks delta T by building so the loads that drive the plant are visible.
Yes. A top 25 US airport went live on Aqueduct in two weeks across 5,000 meter points, and a major leak that manual reads would have missed for months was surfaced immediately.
No. Aqueduct reads SCADA and plant controllers alongside them, and control stays with SCADA. Airport operations, airfield lighting and security systems stay separate.
Yes. Aqueduct can run in the AWS cloud or on-prem, with on-prem AI on NVIDIA infrastructure for sites that keep data on campus.
See Aqueduct on your own facility.
Bring a site, a utility bill or a question. We will show you where the loss is.