The best water management system for stadiums and arenas
 Milvian AI teamFacilities and infrastructure intelligence
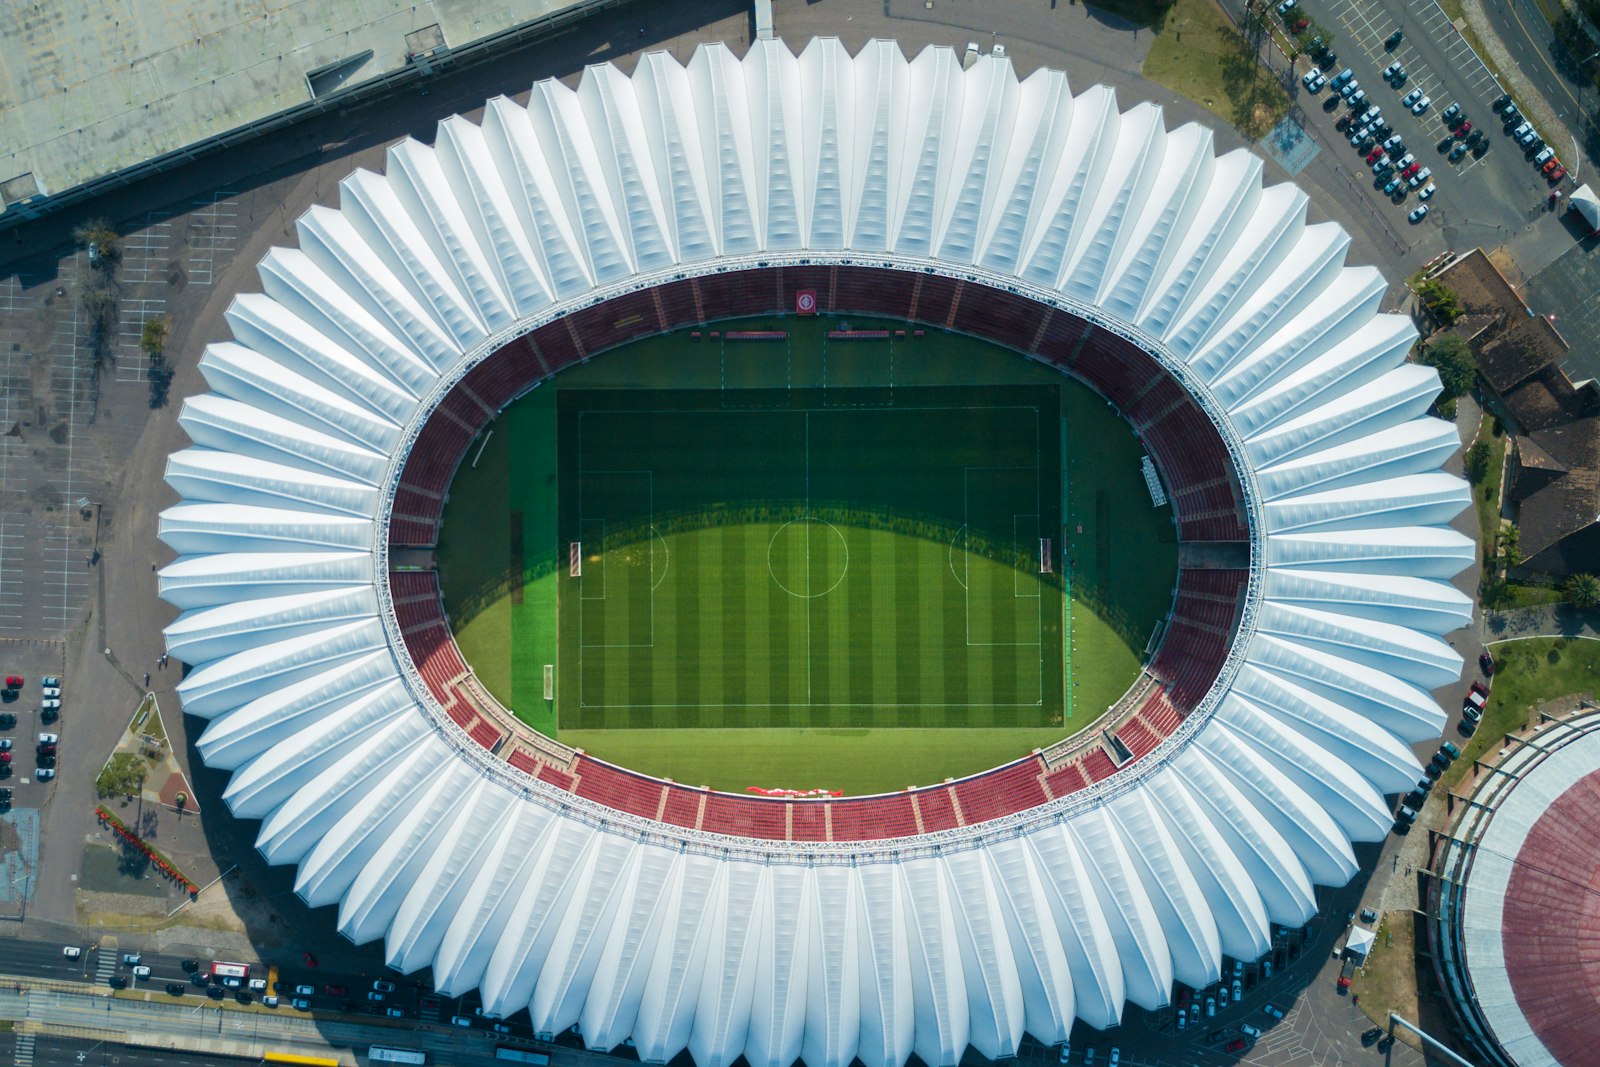
The best water management system for stadiums meters each source and use, from potable supply to pitch irrigation, restroom blocks, catering and treated water, baselines match, concert, grounds and dark days separately, flags flow on empty days as a leak with a location, measures irrigation by zone against weather, and records how much recycled water the venue really uses.
Why stadiums are a hard case for water management
A stadium's water use swings more than almost any building. On a match day, restroom blocks, concessions, kitchens and hospitality draw huge volumes in a few hours, mostly at half time. On a dark day the building should be almost silent. On a grounds day the pitch irrigation runs with no crowd at all.
Those swings hide losses. A failed flush valve or a stuck fill valve can run all night on an empty concourse, and the match day spike makes it invisible in the monthly total. Irrigation controllers run to schedule with no flow feedback, so a stuck zone can water for weeks while the grass looks fine.
Many venues have also invested in rainwater harvesting, treatment and recycled water, but few can say how much recycled water they actually used. Sponsors, leagues and certification programs increasingly want that number.
Venue teams are also stretched. Grounds staff, operations managers and sustainability leads all care about water for different reasons, and they rarely look at the same data. The grounds manager wants flow per irrigation zone, operations wants to know a restroom block is working before gates open, finance wants the cost of dark day losses, and sustainability wants a reuse figure that will survive an audit. One measured record has to serve all of them.
What the best water management system for stadiums must do
| Requirement | Why it matters in stadiums | Question to ask a vendor |
|---|---|---|
| Baselines by day type | Match, concert, grounds and dark days use water for different reasons. | Can you load our fixture list and baseline each day type separately? |
| Dark day night flow | Any flow on an empty night is a loss. | Do you alert on flow above the dark day pattern, with a location? |
| Restroom block metering | Restrooms dominate match day use and fail often. | Can you meter restroom blocks and flag failed fixtures? |
| Irrigation by zone | A stuck zone wastes water and harms the pitch. | Can you measure flow per irrigation zone against weather? |
| Source split | Potable, harvested and recycled water should be quantified. | Can you show what share of use came from each source? |
| Treatment performance | STP and harvesting systems need to work to count. | Do you monitor treated flow and plant efficiency? |
| Install between fixtures | Nothing should be fitted on a match day. | Can you install with clamp-on and wireless devices on non-event days? |
| Verified savings | Owners want results in volume and money. | Is each saving measured against a baseline and priced in our tariff? |
The categories venue teams compare
- Traditional BMSRuns pumps and some plant. Rarely sees restroom blocks, irrigation zones or a water balance.
- Irrigation controllersSchedule the pitch and landscape well. Most cannot confirm the water actually delivered per zone.
- Standalone water dashboardsTrend meters over time. Usually blind to day types, so match days and dark days are mixed.
- Spot leak sensorsUseful under tanks and in plant rooms. They only detect water that has already escaped.
- Consultants and auditsGood for a reuse study or certification. The picture ages within a season.
- Facility intelligence platformsSources, uses, irrigation and treatment on one model with day type baselines, beside energy and air.
How to evaluate a water management system for a stadium
- Map every source and usePotable supply, harvested and recycled water, tanks, restroom blocks, concessions, kitchens, irrigation zones and the STP. Pull 12 months of bills and the fixture list.
- Agree day typesMatch, concert, grounds, dark and off season, so every vendor is judged on the same terms.
- Meter between fixturesFit clamp-on meters on non-event days until the water balance closes and dark day night flow baselines form.
- Run through eventsJudge results over several events of each type, not one match.
- Judge on found losses and source splitNamed losses in volume and money, and a recycled water share backed by meters.
Evaluation scorecard for stadium water management
| Criterion | Weight | What good looks like |
|---|---|---|
| Day type baselines | High | Separate expected use for each kind of day |
| Night flow detection | High | Losses on dark days located and priced by morning |
| Irrigation insight | High | Flow per zone against weather and schedule |
| Source split | Medium | Potable, harvested and recycled shares measured |
| Restroom insight | Medium | Blocks metered, failed fixtures flagged |
| Treatment performance | Medium | STP inlet, treated flow and efficiency tracked |
| Installation | Medium | Non-event days, clamp-on and wireless |
| Energy link | Low | Pumping and water heating on the same model |
Integration and data in a venue
Read the BMS and any irrigation controller that offers an interface, over BACnet or Modbus. Add clamp-on ultrasonic flow meters on the main, restroom risers, irrigation headers and treatment lines, and level sensors on storage tanks. LoRaWAN carries battery sensors across the bowl and the grounds without new cable.
Alerts route to venue operations and the grounds team, and findings become work orders in the CMMS. Ask how the system shows a meter that has stopped reporting, because a dead meter on a dark day looks like a perfect result.
Irrigation data needs weather beside it. A zone that draws more on a hot, windy day is doing its job. A zone that draws the same in the rain is not. The best systems read local weather for the venue and compare each zone with what the conditions called for, so the grounds team gets a short list of zones to check rather than a chart to interpret.
Compliance and reporting for venues
Venues report water through LEED and other green building programs, league and sponsor sustainability reports, and investor disclosures. AWWA M36 gives a structure for water audits and loss accounting, and in Dubai, Al Sa'fat sets green building requirements for new development.
The water system supplies measured volumes by source and use, per event. The venue's sustainability team, auditors and program bodies make the judgments.
Where Aqueduct fits
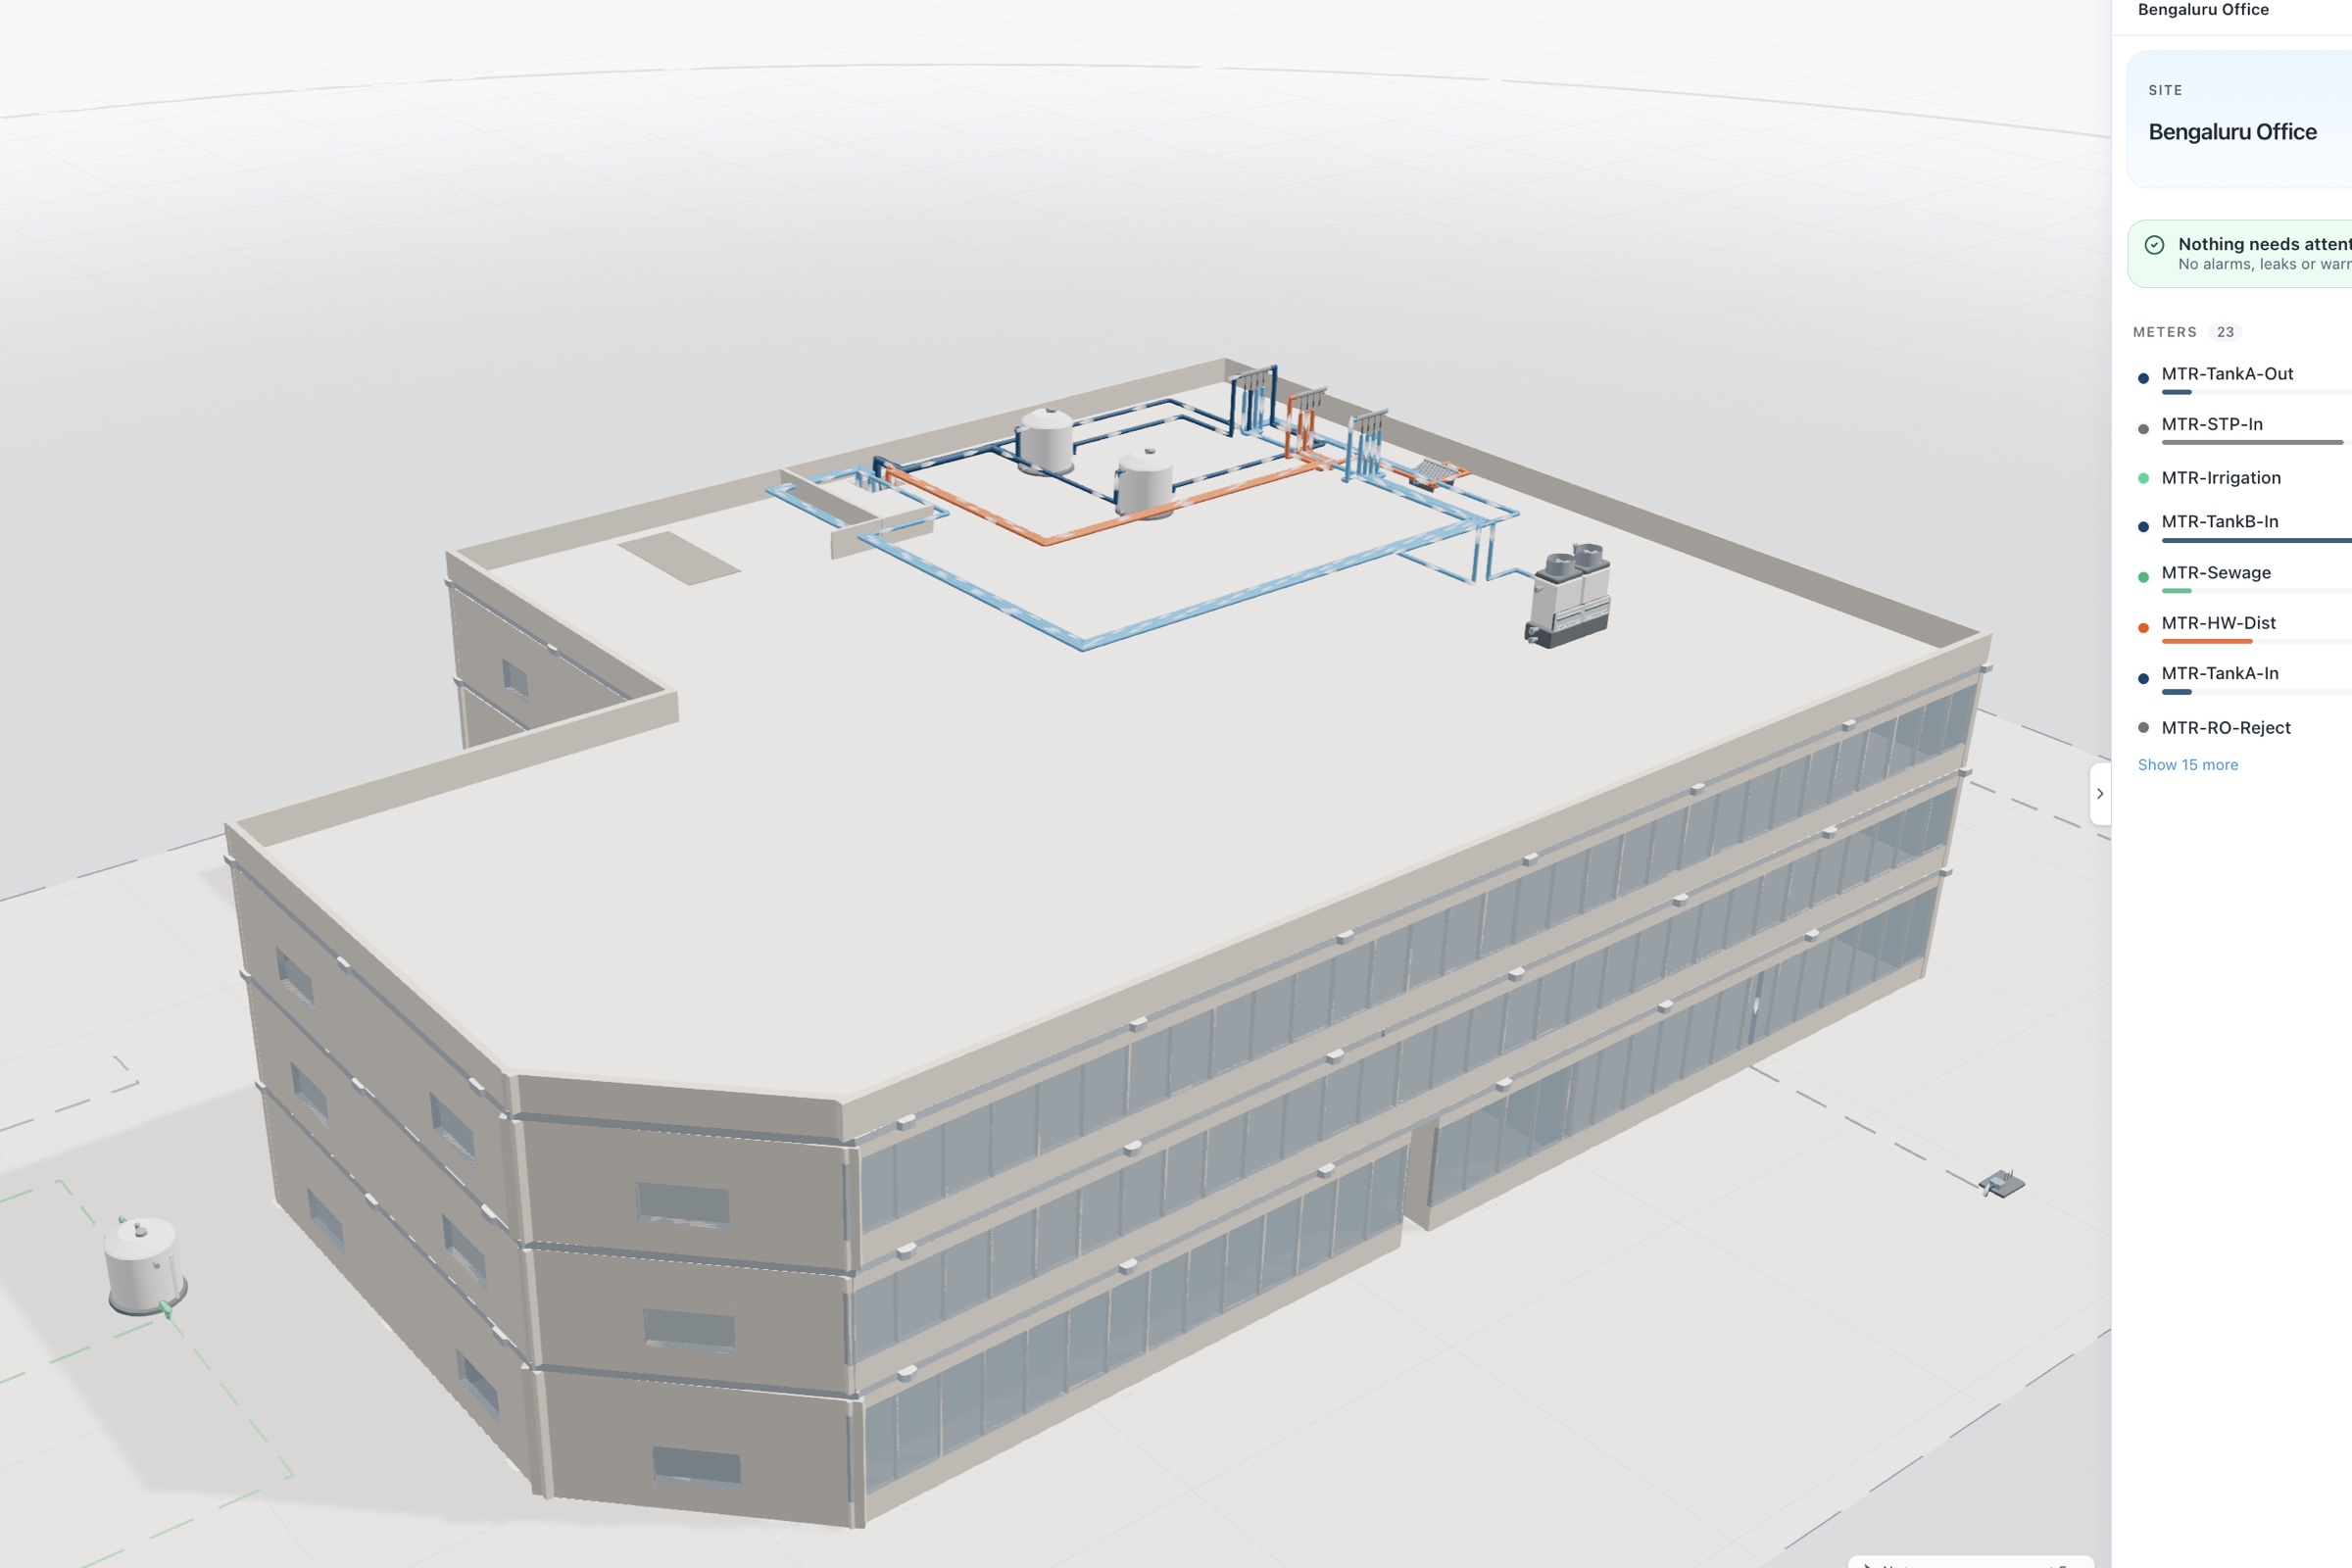
aQ Core maps the venue as sites, floors, zones and devices. aQ WaterGuard builds a live water digital twin block by block to match the venue: tanks with levels, distribution, restroom blocks, irrigation, the STP with inlet, treated flow and efficiency, and reclaimed water lines. The water balance equation shows main supply against every metered use, with unaccounted loss as its own term. Baselines come from regression on use and degree days, with day-one results from uploaded bills, and rate configuration prices every loss.
Venues keep their BMS, replace failed meters or build measurement into new stands. Where control is enabled, with owner approval, Smart Controls can act on approved pumps, valves and irrigation through field devices or LoRaWAN relays, with command history for every action. The same method runs across 275+ sites in 21 countries.
A first engagement usually maps sources and uses, fits meters on non-event days and lets dark day night flow baselines form. After a few events of each type, the venue sees losses by location and cost, irrigation by zone and a measured source split, ready for the next sustainability report.