The best water management system for manufacturing plants
 Milvian AI teamFacilities and infrastructure intelligence
The best water management system for manufacturing plants submeters every source and major use, closes a live water balance across process, utilities, RO, ETP and reuse, ties water to production so intensity per unit is visible, alerts on leaks, overflows and idle draw, reads SCADA without interfering, and verifies every saving at the meter in volume and money.
Why manufacturing is a hard case for water management
A plant draws water from several sources, often a utility supply, borewells and tankers, and uses it in many places at once: process lines, clean-in-place, boiler make-up, cooling towers, washdown, canteens and sanitation. Much of it then passes through an RO plant, an effluent treatment plant and sometimes a zero liquid discharge system before it is reused or discharged.
Most plants meter the boundary and perhaps one or two big users. Leaks at fittings, tanks that overflow on a stuck float valve, hoses left running in washdown areas and cleaning cycles that run longer than needed all disappear into one number. Tower blowdown runs on timers, and RO reject goes to drain instead of to a reuse point.
Production makes it harder still. Water use moves with output and product mix, so the monthly figure says little about efficiency. And water permits, discharge limits and corporate water targets now ask for evidence most plants cannot produce.
Water and energy are also tied together in a plant. Every liter pumped from a borewell, heated for CIP, softened for a boiler or pushed through an RO membrane carries an energy cost. A loss of hot process water is a loss of fuel as well. The best water management system shows those links, so a plant can rank fixes by their full cost rather than by volume alone.
What the best water management system for manufacturing plants must do
| Requirement | Why it matters in a plant | Question to ask a vendor |
|---|---|---|
| Source and use submetering | The boundary meter cannot locate losses or attribute use. | Can you meter each source and each major use, including CIP and towers? |
| Live water balance | Unaccounted loss is where leaks and overflows show. | Do you show supply against the sum of metered uses in real time? |
| Water per unit of production | Intensity is the only fair efficiency measure. | Can you bring in production counts and report water per unit? |
| Treatment plant performance | RO recovery, ETP and reuse decide how much fresh water is needed. | Do you track RO feed, permeate, reject and recovery, and ETP and STP efficiency? |
| Cooling tower visibility | Make-up and blowdown often run above what evaporation needs. | Can you meter make-up and blowdown and show cycles of concentration? |
| Leak, overflow and idle alerts | Losses are cheapest to fix in the shift they start. | How do you alert on flow outside the expected pattern for that shift? |
| Safe integration | SCADA and PLCs run production. | Is the connection to SCADA read-only by default? |
| Verified savings | Projects need proof in volume and money. | Is each saving measured against an adjusted baseline and priced? |
The categories plant teams compare
- SCADA and historiansHold process data reliably. Rarely configured to close a site water balance or price losses.
- Standalone water dashboardsTrend meters and reports clearly. Often cannot normalize for production or track treatment plants.
- IoT monitoring platformsQuick sensor installs and alerts. Often light on the physical model that turns readings into a balance.
- Water treatment contractorsExpert in chemistry, towers and RO. Their data usually lives in their own monthly reports.
- Consultants and water auditsUseful for a baseline study and a reuse plan. The picture ages as production changes.
- Facility intelligence platformsSources, uses, treatment and reuse on one live model with production normalization, beside energy.
How to evaluate a water management system for a plant
- Walk every water pointMap sources, storage, process lines, CIP skids, boilers, towers, RO, ETP, STP and reuse points. Pull 12 months of bills, tanker records and production data.
- Draw the intended balanceAgree with your utilities engineer what supply should equal, use by use, before any meter is fitted.
- Meter during productionClamp-on flow meters go in while lines run. Anything that needs a line break waits for a planned shutdown.
- Close the balance and name lossesWhen metered use reconciles with supply, the remaining loss and each named finding should come with volume and money.
- Judge on water per unitDid intensity fall against the adjusted baseline, and are the findings fixed and verified?
Evaluation scorecard for plant water management
| Criterion | Weight | What good looks like |
|---|---|---|
| Water balance | High | Supply reconciled with every metered use, loss explained |
| Production normalization | High | Water per unit with production data in the model |
| Treatment and reuse | High | RO recovery, ETP and STP efficiency and reuse flow tracked |
| Alerts | Medium | Leaks, overflows and idle draw located by line or zone |
| Cooling towers | Medium | Make-up, blowdown and cycles measured |
| Safe integration | Medium | Read-only SCADA and existing meters |
| Verification | Medium | Savings in volume and money at the meter |
| Energy link | Low | Pumping and heating energy on the same model |
Integration and data in a plant
Keep SCADA and the historian. The water system reads them over Modbus or BACnet, read-only by default, and adds clamp-on ultrasonic flow meters, level sensors on tanks, and quality sensors such as TDS on RO and reuse streams. LoRaWAN gateways reach outlying borewells, tanks and the ETP without trenching new cable.
Findings route to the maintenance CMMS so every loss has an owner. Ask how the system shows data gaps and sensor health, because a flow meter that drops out on a night shift can make a loss look like a saving.
Compliance and reporting for plant water
Plants answer to discharge consents and pollution control board limits, corporate water targets, and disclosure frameworks such as CSRD in Europe and BRSR in India. AWWA M36 gives a structure for water audits and loss accounting, and LEED rewards measured water performance in buildings on the site.
The water system supplies measured volumes, quality readings and a balance that reconciles. Regulators, auditors and the plant's own EHS team draw the conclusions.
Where Aqueduct fits
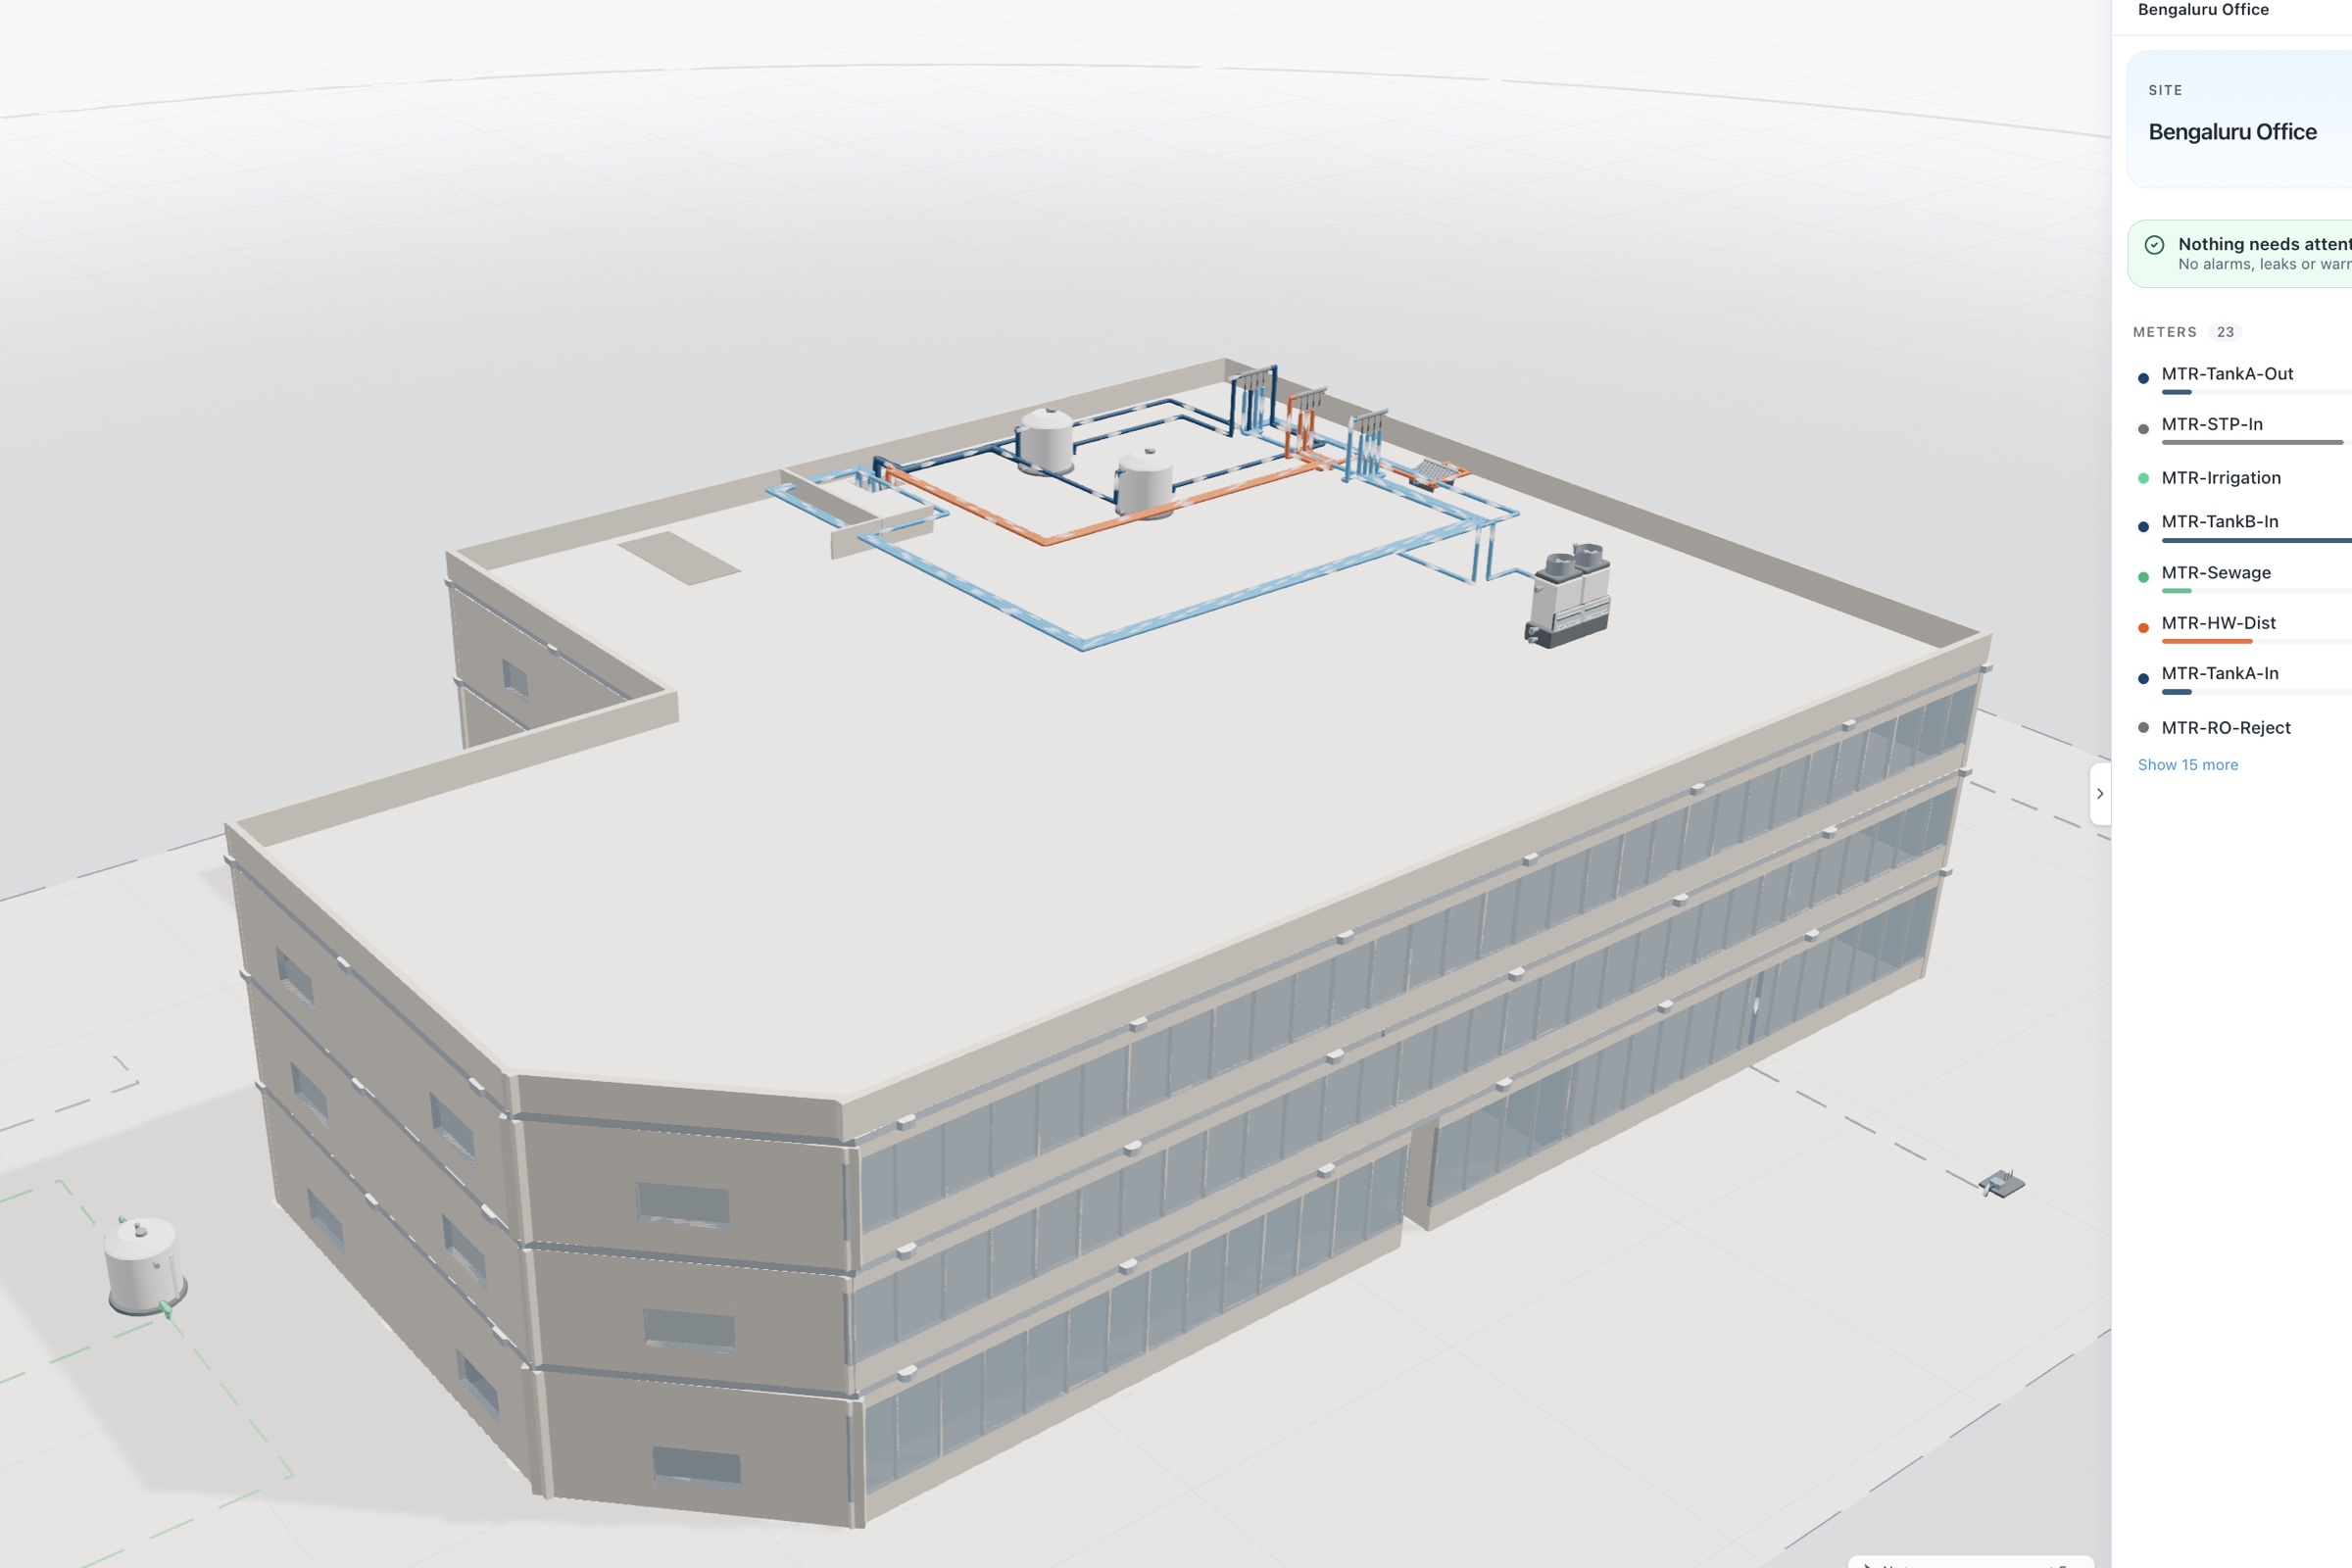
Aqueduct runs on a 300-acre FMCG manufacturing campus and at major dairy operations, . aQ Core maps the plant as sites, zones and devices. aQ WaterGuard builds a live water digital twin block by block to match the plant: sources, tanks with levels, process and utility lines, the RO unit with feed, permeate, recovery and TDS, the ETP or STP with inlet, treated flow and efficiency, and reuse lines. The water balance equation puts main supply against every metered use, with unaccounted loss as its own term.
Baselines come from regression on use and degree days, from uploaded bills on day one, and rate configuration prices every finding. Plants keep SCADA. Where control is enabled, with owner approval, Smart Controls can act on approved pumps and valves through field devices or LoRaWAN relays, with every command logged.
A first engagement usually starts with a walk of every water point and a draft balance agreed with the utilities engineer. Meters go in during production, the balance closes, and the first losses are named in liters and money. Treatment plants and reuse lines join next, then further plants on the same model.