The best water utility intelligence platform for networks, pumping and treatment
 Milvian AI teamFacilities and infrastructure intelligence
The best water utility intelligence platform reads SCADA, AMI and meters read only and turns them into a daily water balance per district. It baselines night flow, separates real from apparent losses, tracks pumping energy and treatment plant performance, routes repairs to the CMMS with a location, verifies each fix in the balance and builds the annual water audit from measured data.
Why a water network is a hard case
A water utility runs a facility that is mostly underground and spread across a city. Water is abstracted, treated, pumped into reservoirs, pushed through transmission mains, distributed through district networks and delivered through service connections to customer meters. Water is lost at every stage: inside the treatment plant, at reservoir overflows, through leaks on mains and services, and through meters that under-register or data that is handled badly.
Utilities already collect a lot of data. SCADA covers plants, pumps and reservoirs. AMI or manual reads cover customers. Billing systems hold consumption. GIS holds the network. The trouble is that these sit in separate systems, owned by separate teams, and the water balance that ties them together is often built once a year for the audit.
Energy is the other large cost. Pumping is usually one of a utility's biggest electricity loads, and pumps drift off their best efficiency point, run in peak tariff hours or fight each other. Without per-station metering and a baseline, the energy bill is just a number.
Smaller utilities and municipal water departments face all of this with fewer people. They may have SCADA on the plant and the main pump stations, manual customer reads and no district metering at all. The platform has to work with that reality, starting from what exists, adding inlet meters on a few districts, and growing as budget allows, rather than assuming a fully instrumented network.
What the best water utility intelligence platform must do
| Requirement | Why it matters in a water utility | Question to ask a vendor |
|---|---|---|
| Read SCADA and AMI read only | Control must stay with SCADA | How is read-only access enforced, and can you run on premises? |
| Balance every district daily | An annual balance finds leaks months late | Can you build the balance per DMA every day? |
| Baseline night flow | A rise in the night minimum is the earliest leak signal | Do you baseline minimum night flow per district and alert on rises? |
| Separate real and apparent losses | Different losses need different fixes | How do you estimate meter under-registration and data errors? |
| Detect bursts | Fast detection limits volume lost | Do you detect step changes in flow and pressure? |
| Track pumping energy | Pumps are a major electricity cost | Can you show wire-to-water efficiency per station? |
| Monitor treatment plants | Process losses and backwash hide in plant totals | Can you balance a treatment plant block by block? |
| Verify every repair | Repairs without verification do not reduce losses | Does the district balance confirm each repair? |
| Support the water audit | Regulators and boards ask for an audited balance | Can you produce an AWWA M36 style balance from daily data? |
The categories of tools utilities compare
- SCADA and historiansThe control and record of plants and pumps. Reliable, but not built to reconcile a network balance or rank districts.
- Meter data management and AMI platformsStrong on customer consumption and billing. They see customers, not the network between the plant and the meter.
- Hydraulic models and GISEssential for planning and design. Models are as good as their calibration and do not watch the network day to day.
- Leak detection servicesSkilled crews with acoustic tools find leaks on the ground. They need to be sent to the right district.
- Spreadsheets and annual auditsFamiliar and required. Built once a year, so they report losses that have already run for months.
- Facility intelligence platformsNetwork, pumping and plant data on one layer, with daily balances, night flow baselines, energy per station and CMMS routing, leaving control with SCADA.
How to evaluate a water utility intelligence platform
- Map your data sourcesSCADA tags, AMI and billing extracts, GIS layers and existing DMA meters, with owners and access rules.
- Agree security and hostingDecide whether the platform runs on premises, how read-only access is enforced and what data leaves the network.
- Pilot a set of districtsChoose DMAs with known losses and good inlet metering. Build daily balances and night flow baselines.
- Run find and fixSend work orders with a district and likely location to crews. Verify each repair in the balance.
- Add pumping and plantsMeter pump stations and plant blocks. Judge on energy per volume against baseline.
Water utility intelligence scorecard
| Criterion | Weight | What good looks like |
|---|---|---|
| Integration and security | 20% | SCADA and AMI read only, on-premises option |
| District balances | 20% | Daily balance per DMA with real and apparent losses |
| Leak and burst detection | 15% | Night flow baselines and step change detection |
| Pumping energy | 15% | Wire-to-water efficiency and peak tracking per station |
| Treatment plant visibility | 10% | Plant balanced block by block |
| Work and verification | 10% | CMMS routing with every repair verified |
| Audit output | 10% | Annual balance built from daily data |
Integration and data in a utility
The platform reads SCADA and historians read only, on premises where required. AMI and billing data are aggregated per district. Pump stations are metered with current transformers where SCADA does not already measure power, and flow and pressure at DMA inlets come from existing loggers or new wireless devices.
Control stays with SCADA throughout. The platform's outputs are information: balances, alerts and work orders routed to the utility's CMMS with district and likely location. Network operations, asset management, energy and finance each see their part, and IT keeps the data in the utility's environment.
Data quality deserves its own attention. Loggers fail, SCADA tags freeze and AMI reads go missing. Each input should carry its health and coverage, and a balance built on a day with a frozen inlet meter should say so rather than report a false leak or a false recovery. A utility that trusts its daily balance will act on it; one that has been misled a few times will stop looking.
Compliance and reporting for utilities
- AWWA M36 water auditsA top-down balance from daily data, with each term measured or named as an estimate.
- Regulatory loss reportingNon-revenue water and leakage figures with the method recorded.
- Energy reportingPumping and treatment energy per volume, from meters.
- Asset managementPump and plant condition data supports ISO 55001 style asset planning.
Where Aqueduct fits
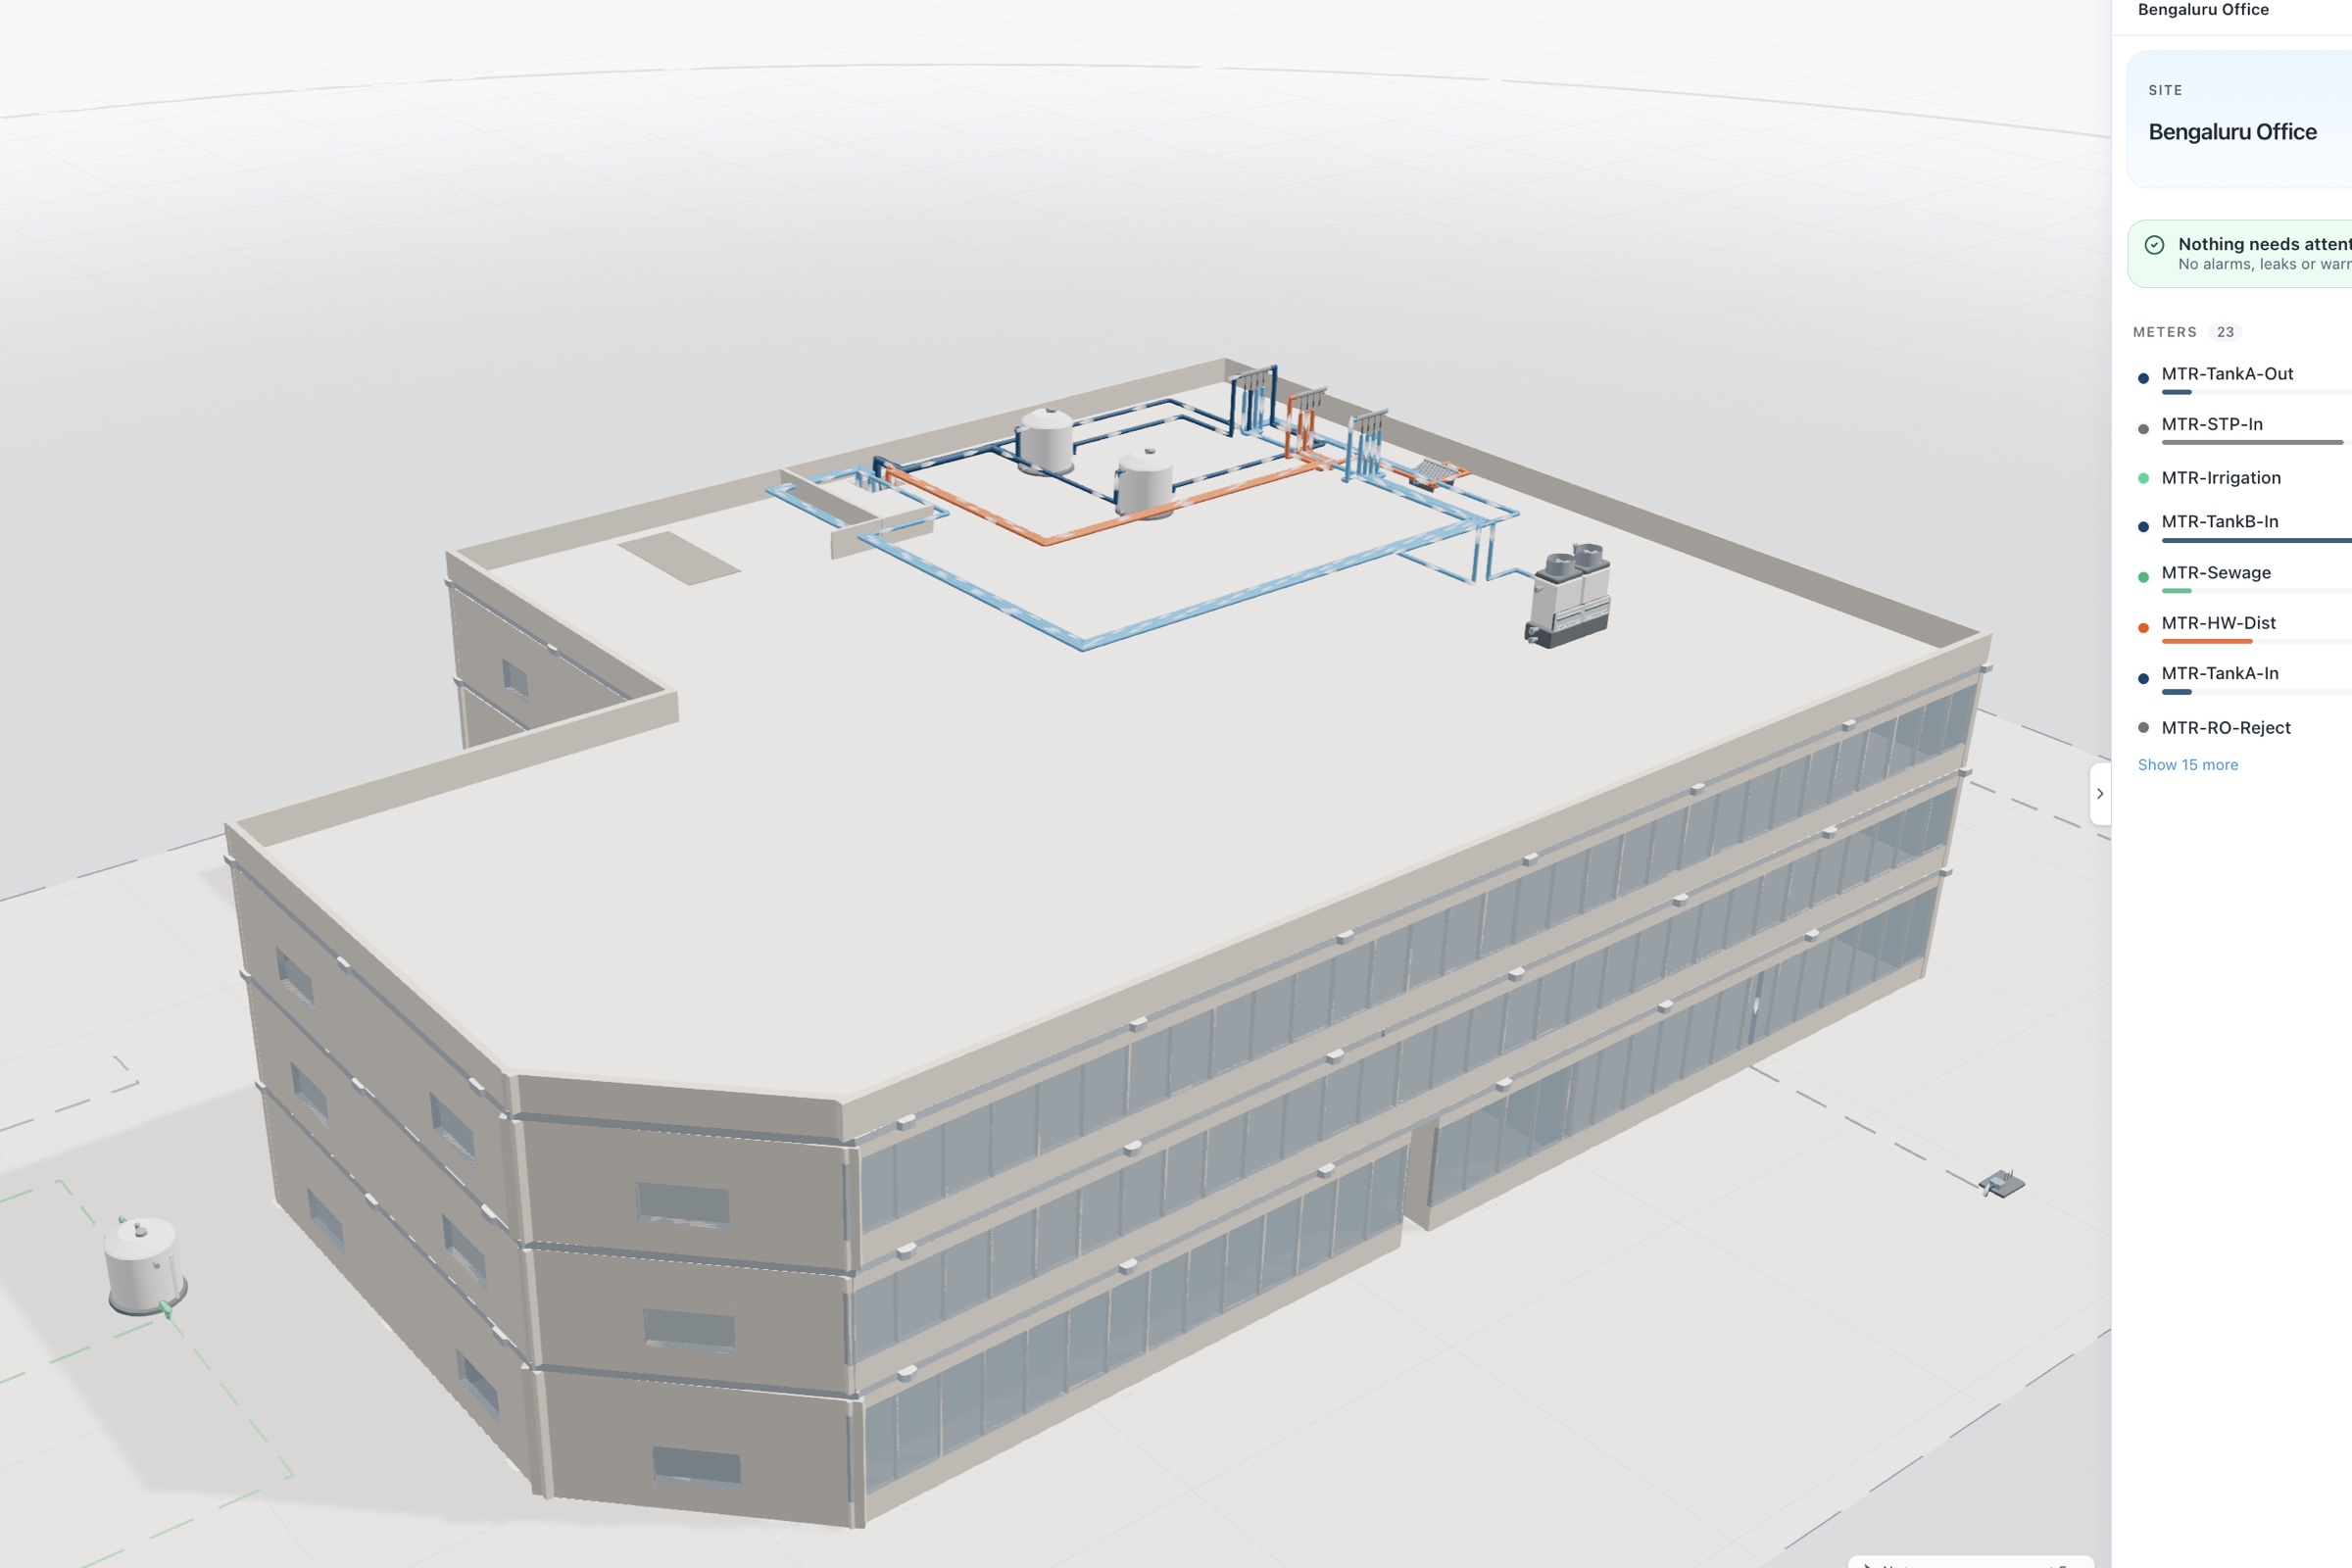
Aqueduct is a facility intelligence platform. aQ WaterGuard builds the balance at every level, from treatment plant blocks to district networks, with unaccounted loss as a live number and night flow baselined per district. aQ EnergySmart meters pump stations and treatment energy, with peak demand tracked and savings priced through rate configuration. aQ PredictIQ watches pumps for drift. aQ Core holds sources, plants, reservoirs, mains, districts and devices in one hierarchy, with sensor health visible.
Utilities keep SCADA and read from it. Control of the network stays with SCADA and the utility's operators. Where control is enabled, with owner approval, Smart Controls is limited to auxiliary equipment the utility chooses, with every command logged.