The best energy management system for data centers, judged on measured efficiency
 Milvian AI teamFacilities and infrastructure intelligence

The best energy management system for data centers calculates PUE and WUE from metered inputs rather than nameplate figures, separates IT, cooling and electrical losses, baselines each chiller, CRAH and pump against load and weather, reads the BMS and EPMS read-only, reports per hall and per customer, and verifies every efficiency change at the meter.
Why data centers are a hard case for energy management
A data center is mostly one job: keep IT load powered and cool, all the time, with redundancy. That makes efficiency a careful trade. Cooling is staged conservatively, chilled water is held colder than it needs to be out of habit, and whole halls run cold to protect a few hot racks. UPS systems sized for future halls run at low load, where conversion losses are worst. Generators draw energy for block heaters and test runs all year.
Water is part of the same picture. Cooling towers and evaporative systems consume large volumes, and make-up and blowdown often run well above what evaporation needs.
Customers, investors and regulators now ask for efficiency figures that trace to a meter. A PUE calculated from nameplate ratings or a single incomer is no longer good enough, and operators need an energy system that can defend every number it reports.
That is why the buying decision is different here. A data center does not need another screen of alarms; it already has a BMS, an EPMS and usually a DCIM tool. What it lacks is one model that ties the electrical path, the cooling plant and the water system together, so a change in one shows up honestly in the others. The best energy management system is the one that closes that gap without opening a new risk.
What the best energy management system for data centers must do
| Requirement | Why it matters in data centers | Question to ask a vendor |
|---|---|---|
| Measured PUE and WUE | Reported figures must trace to devices, not estimates. | Which meters feed each term of PUE and WUE, and how are gaps shown? |
| IT, cooling and loss separation | Total facility load hides transformer, UPS and distribution losses. | Can you show an energy balance from incomer to IT load? |
| Cooling unit baselines | CRAH units fighting each other and overcooled aisles are common. | Do you baseline each chiller, CRAH and pump against load and weather? |
| Water visibility | Tower make-up and blowdown drive WUE. | Can you meter make-up, blowdown and cycles of concentration? |
| Read-only integration | No operator will open a control path into a live hall lightly. | Is the connection to BMS and EPMS read-only by default? |
| Per hall and per customer data | Colocation customers ask for their own energy data. | Can you report measured use per hall and per customer? |
| Power quality | Power factor and harmonics affect cost and equipment. | Do you show power factor, reactive power and loading per feeder? |
| Verified changes | Setpoint changes need proof they saved energy without risk. | How do you verify a change against an adjusted baseline? |
The categories data center teams compare
- BMS and EPMSControl mechanical plant and monitor electrical systems reliably. They are built for operation and alarms, not for baselining or verified savings.
- DCIM toolsStrong on assets, capacity and rack level detail. Many are light on plant physics, water and weather-normalized performance.
- Standalone EMS dashboardsGood at trending meter data. Few produce a defensible PUE and WUE or explain why they moved.
- IoT monitoring platformsEasy temperature and humidity sensing in white space. They rarely connect it to chiller and pump energy.
- Consultants and auditsValuable for design reviews and commissioning. Findings age quickly as load and halls change.
- Facility intelligence platformsElectrical, cooling and water on one model with verified results, reading existing systems rather than replacing them.
How to evaluate an energy management system for a data center
- Map the meters you already haveList every meter feeding PUE and WUE today, from the incomer to UPS output, PDUs, chillers, towers and make-up water.
- Find the gapsMark where figures are estimated or derived from nameplate ratings. Those gaps are where vendors should add metering.
- Connect read-only to one hallRead BMS and EPMS over BACnet, Modbus or SNMP, fill the gaps on one hall and let the baselines form.
- Test the findingsExpect findings such as cooling units working against each other or overcooled aisles. Your team makes the change and the system verifies it.
- Scale on the same modelAdd halls and sites only once the first hall's figures are trusted by engineering and sustainability alike.
Evaluation scorecard for data center energy management
| Criterion | Weight | What good looks like |
|---|---|---|
| Metered PUE and WUE | High | Every term traced to a device, gaps flagged |
| Cooling diagnostics | High | Per unit baselines, conflicts and overcooling found |
| Safe integration | High | Read-only by default, no new control path without approval |
| Electrical depth | High | Energy balance from incomer to IT, with losses shown |
| Water depth | Medium | Make-up, blowdown and cycles measured |
| Customer reporting | Medium | Per hall and per customer measured use |
| Verification | Medium | Changes measured against adjusted baselines |
| Data trust | Medium | Device health and coverage visible per meter |
Integration and data in a data center
Keep the BMS, EPMS and DCIM. The energy system reads them over BACnet, Modbus and SNMP, read-only, and builds one model of electrical, cooling and water systems. Where an input to PUE or WUE is missing, add a meter rather than an estimate.
Findings route to the CMMS or ticketing system the facility team already runs. Customer reports and invoices should come from the same measured data, so the report and the bill agree. Device health and data coverage should be visible for every meter, because a figure sent to a customer must be one engineering can stand behind.
Ask how the system treats redundancy. A hall running on both A and B feeds at low load is behaving as designed, and a good platform should not flag it as waste. Equally, a UPS that has run at very low load for years because a planned hall never arrived is a real finding. The difference comes from modeling the installation block by block, rather than applying generic rules.
Compliance and reporting for data centers
Data center reporting is tightening in many markets. In Europe, CSRD and national energy efficiency rules ask operators for measured energy and water figures. ISO 50001 is a common structure for the energy program, and ASHRAE 90.1 shapes new mechanical design in many jurisdictions. Customers increasingly ask for their own share of energy and carbon.
The energy system supplies metered evidence and a documented method. Regulators, auditors and certification bodies make the determination.
Where Aqueduct fits
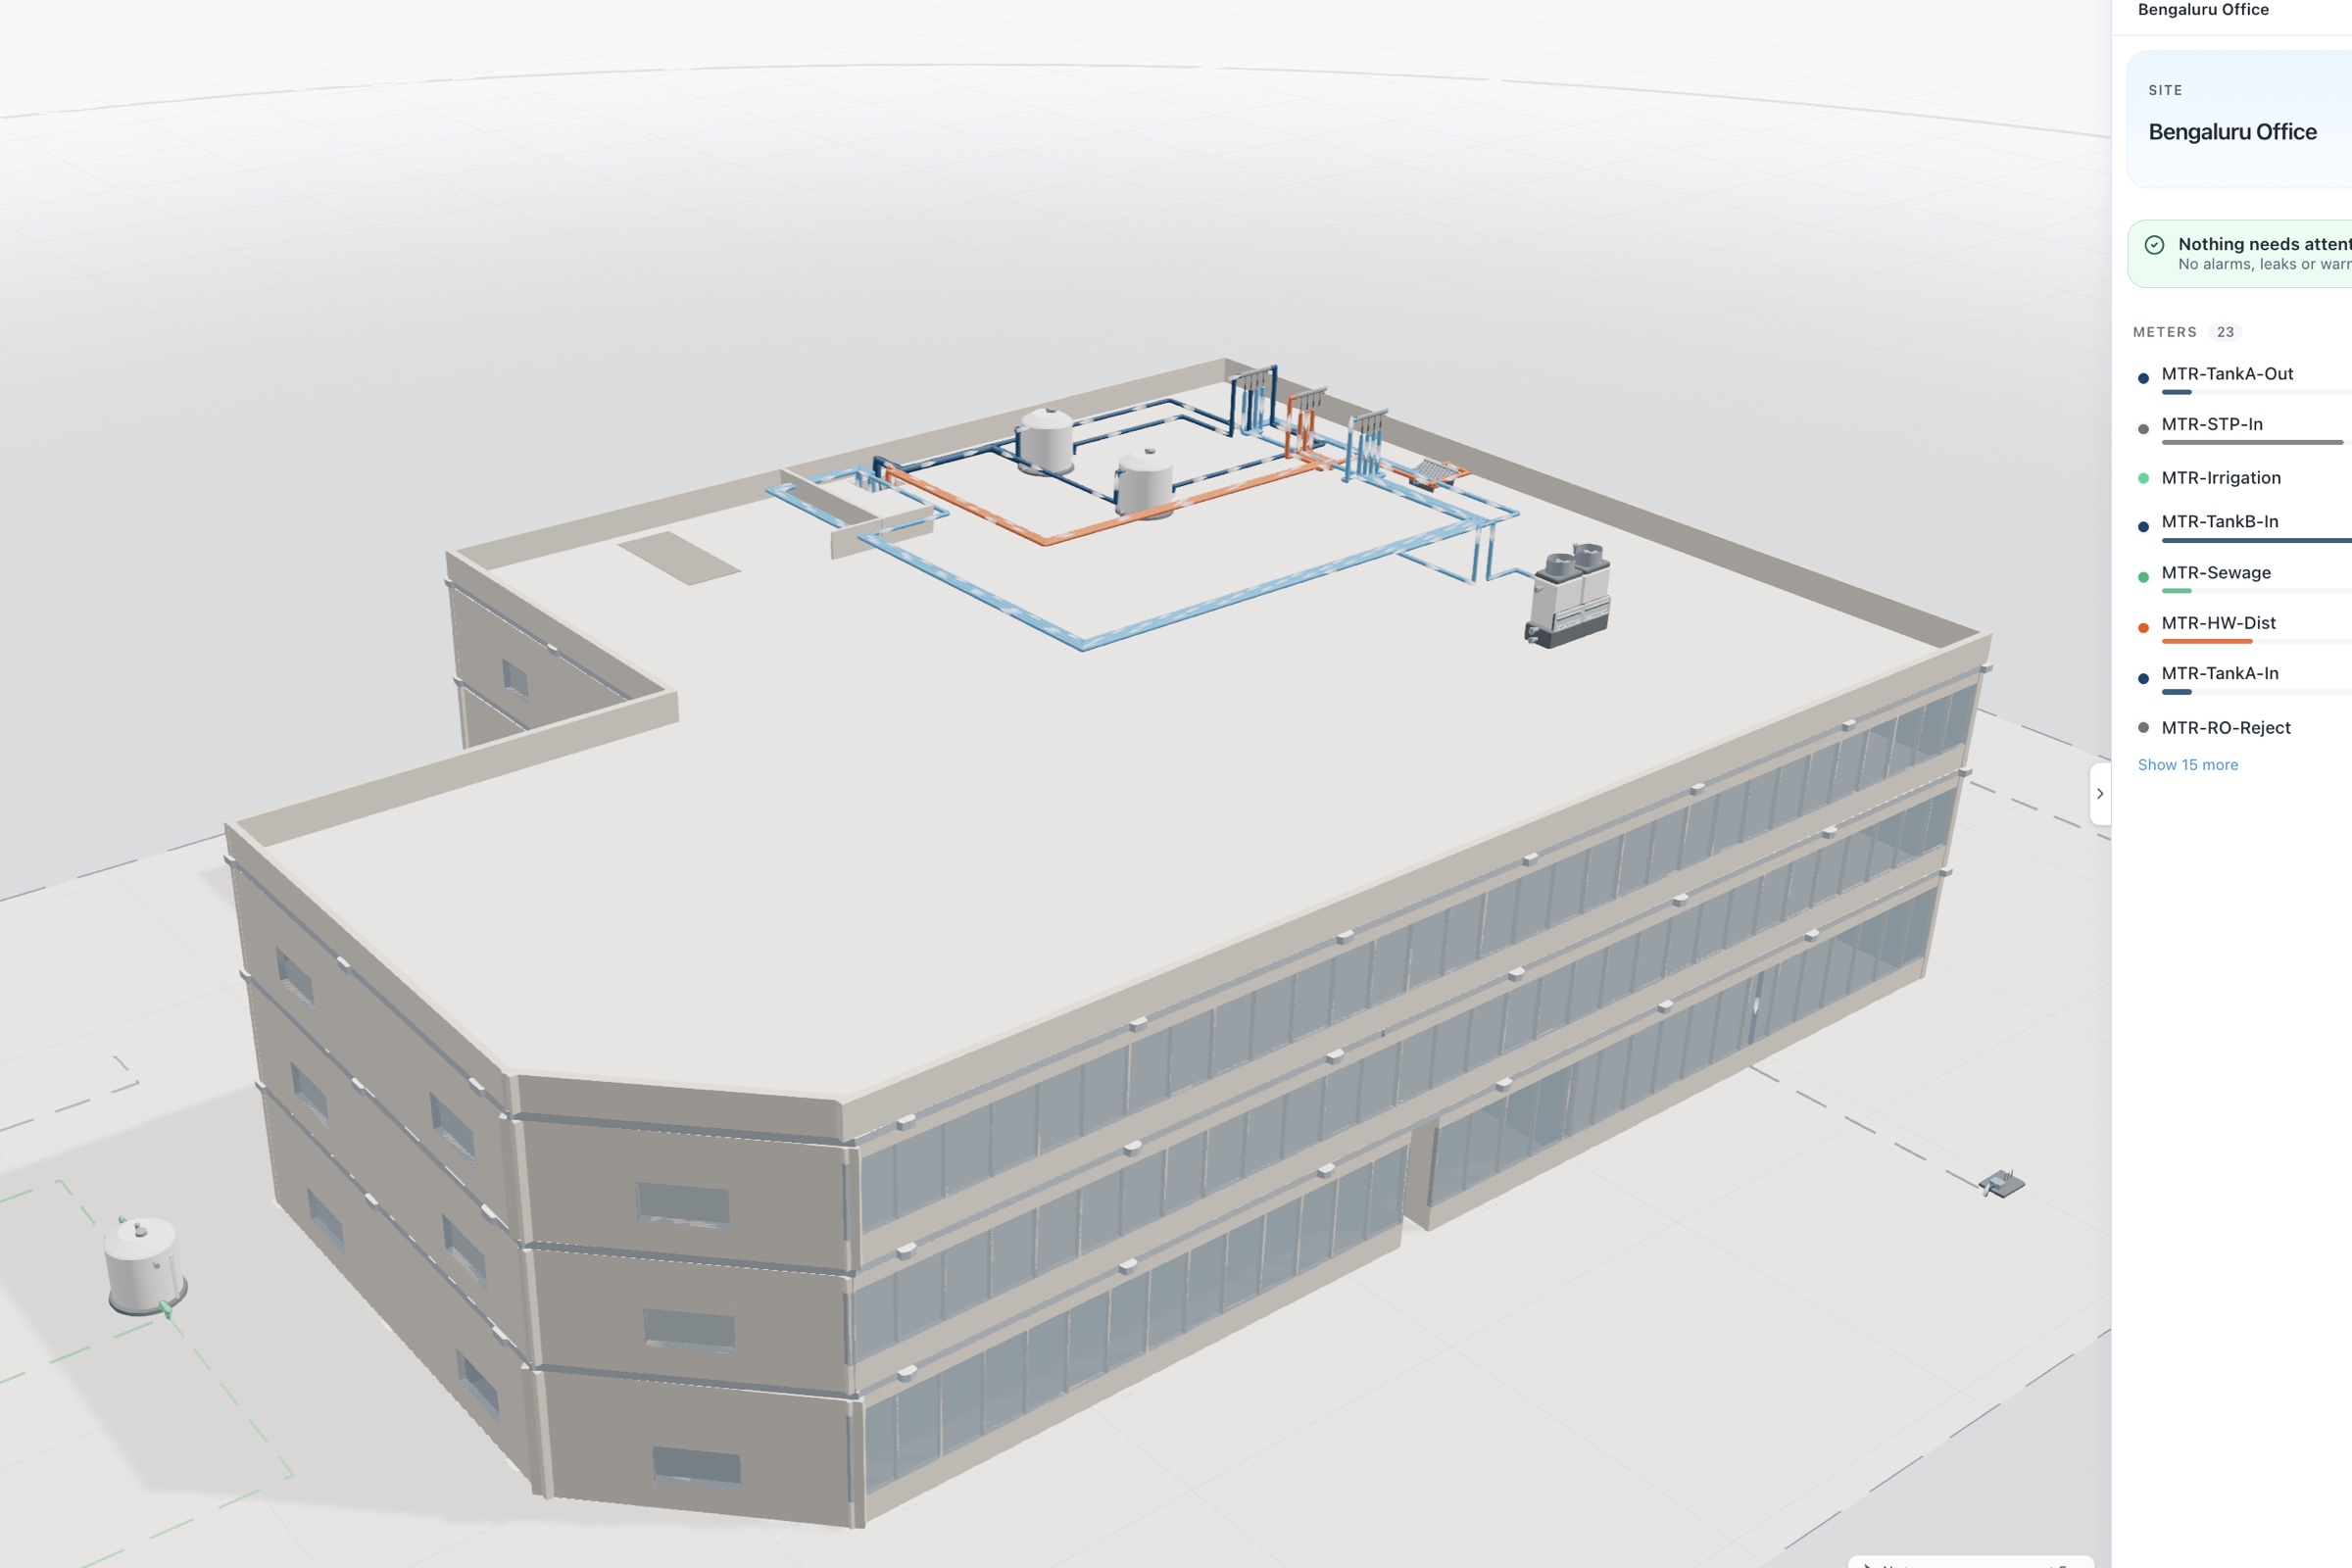
aQ Core holds the facility as sites, halls, zones and devices. aQ EnergySmart builds the electrical digital twin, an energy balance from utility, solar and generator supply through switchboards and feeders, with power factor, losses and loading per node, and baselines that price the difference in your tariff. aQ WaterGuard meters tower make-up and blowdown so WUE traces to devices.
Operators can keep existing systems and have Aqueduct read them, replace failed meters, or build the measurement layer into new halls. Setpoint changes stay with your team by default. Aqueduct acts only where control is enabled, with owner approval, and every command is logged in command history.
A first engagement usually connects read-only to one hall, fills the metering gaps that make PUE an estimate, and lets baselines form for each chiller, CRAH and pump. Findings go to the facility team, which makes any change itself while Aqueduct verifies the result. Further halls and sites join only once engineering trusts the first hall's figures.