Choosing the best energy management system for dairy plants
 Milvian AI teamFacilities and infrastructure intelligence
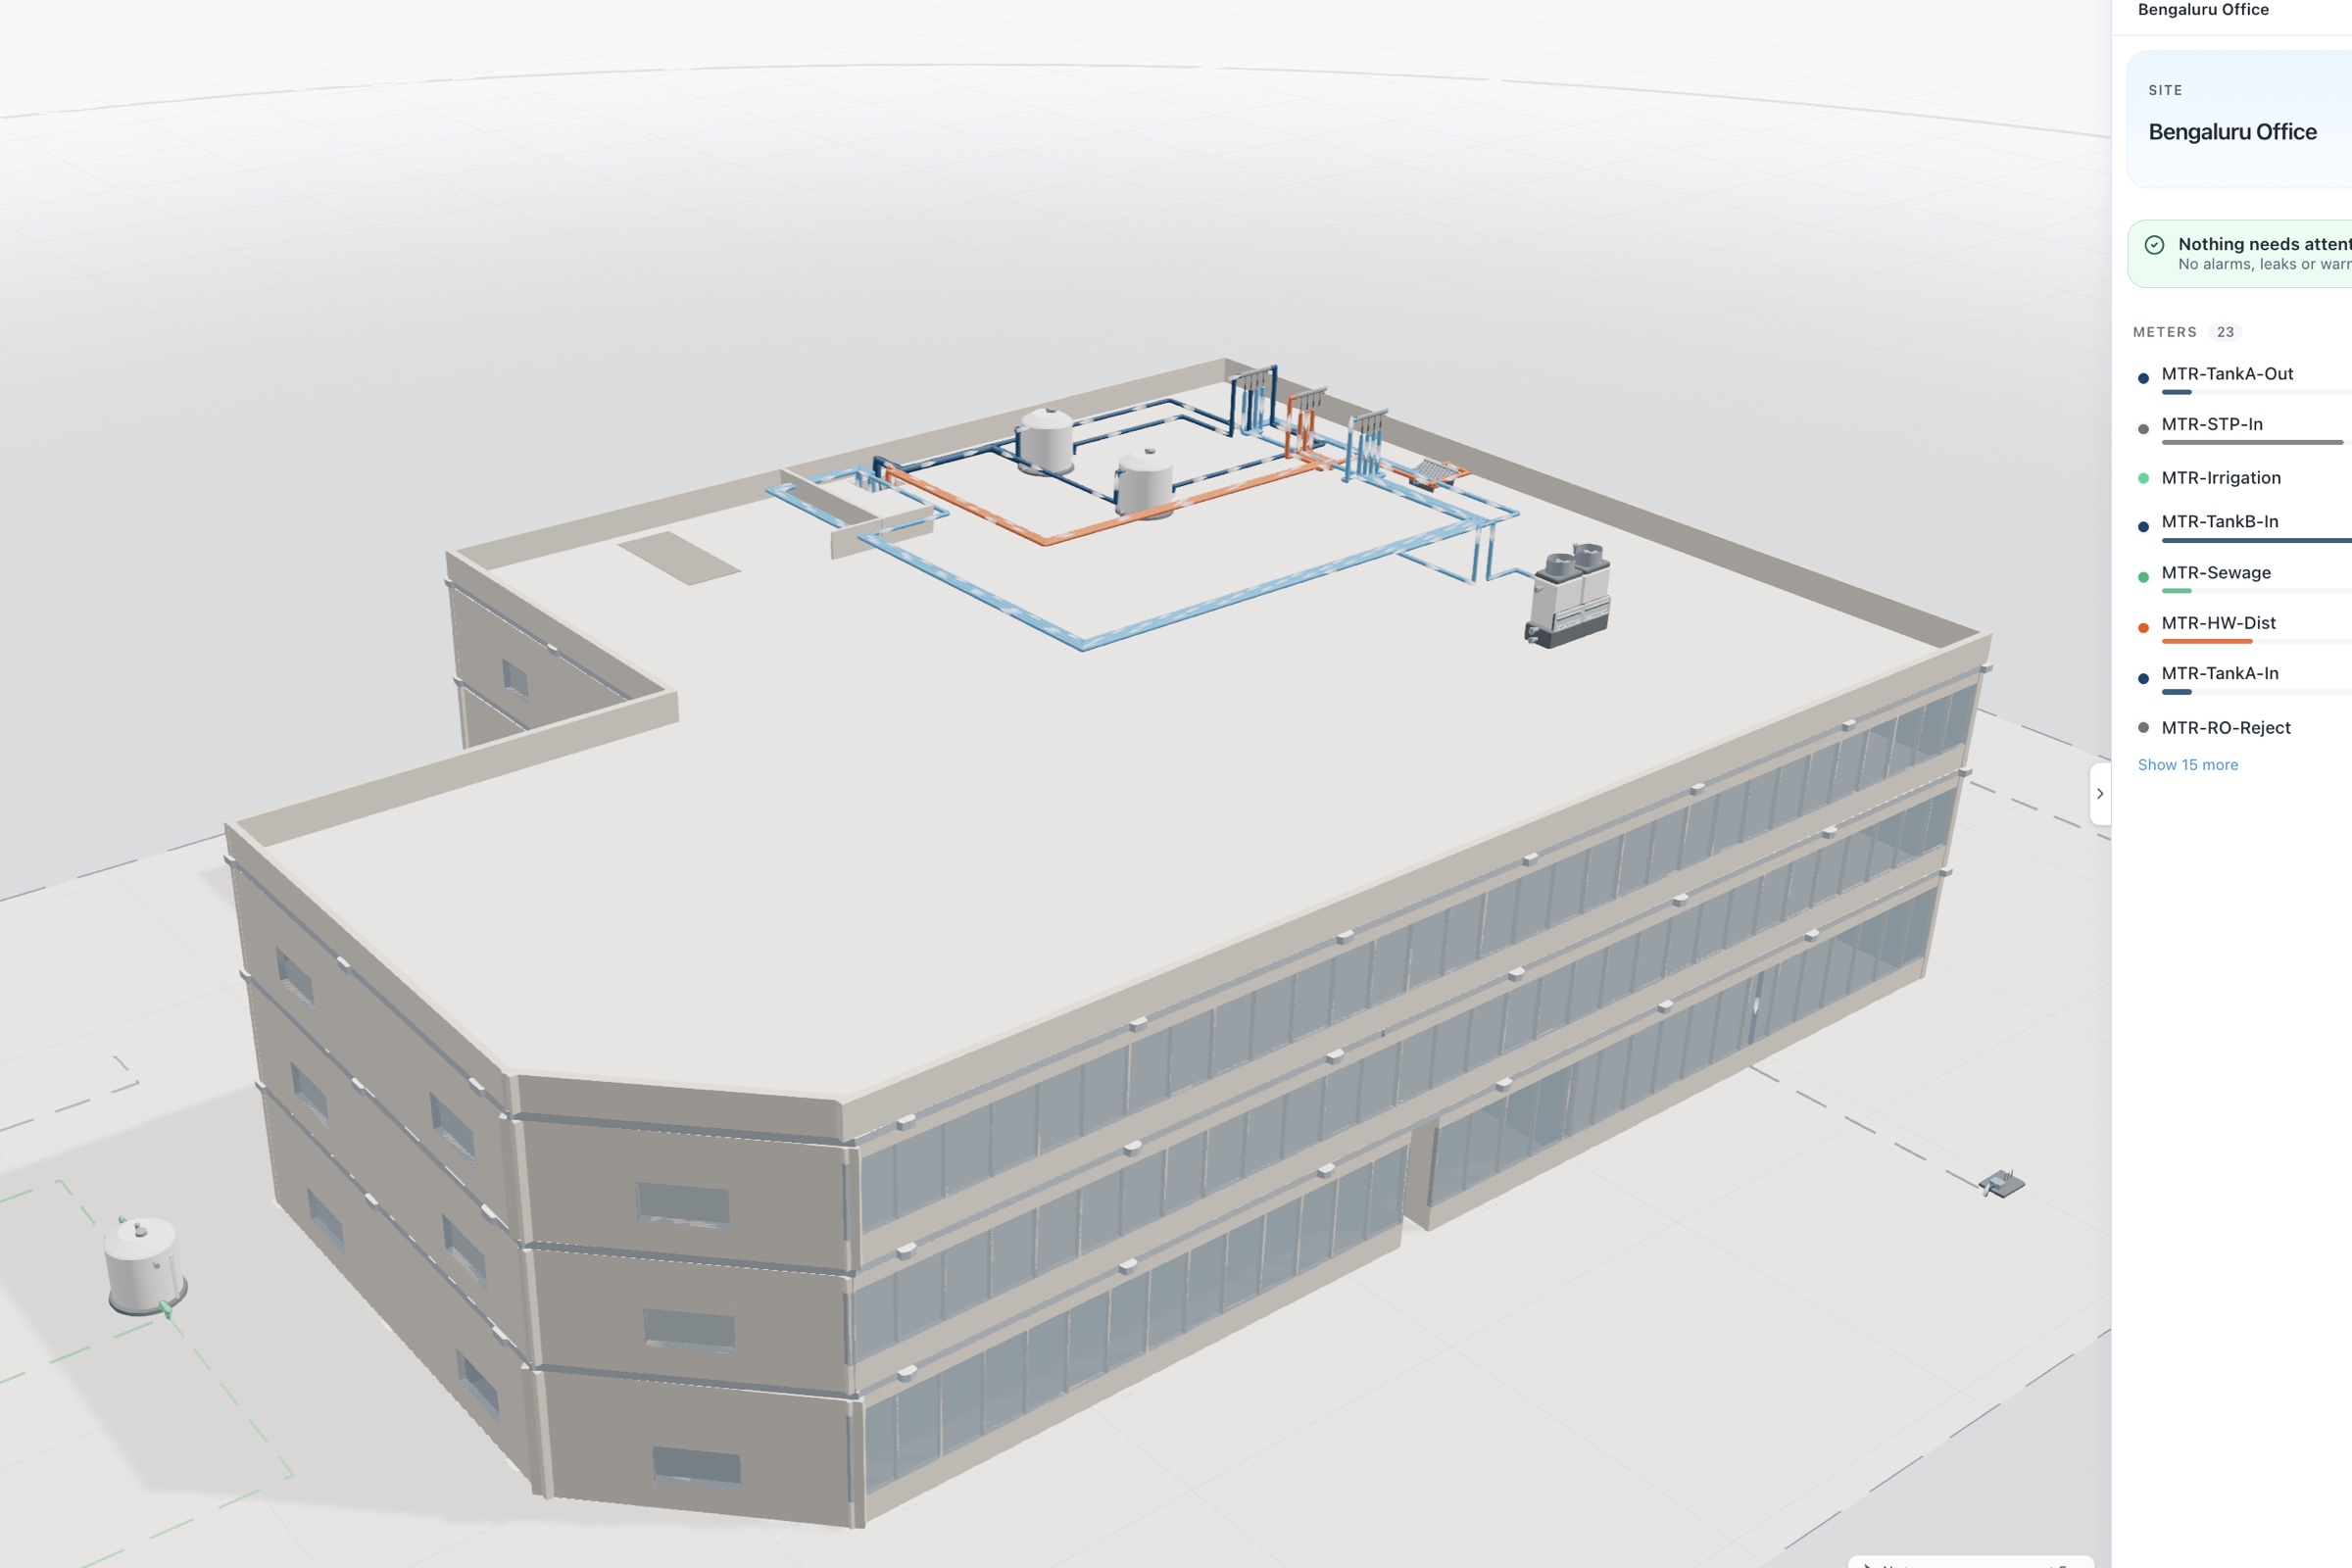
The best energy management system for dairy plants meters refrigeration, steam, CIP, compressed air and electrical distribution separately, ties energy to liters processed, spots refrigeration drift and failed steam traps, manages power factor and demand, extends to chilling centers over cellular or LoRaWAN, reads SCADA without interfering, and verifies every saving at the meter.
Why dairy plants are a hard case for energy management
A dairy runs on cold and heat at the same time. Refrigeration is usually the largest electrical load: ammonia or glycol plant, ice banks, cold stores and silo cooling. Steam and hot water drive pasteurization, sterilization, evaporation, drying and CIP. The plant switches between them many times a day as lines start, stop and clean.
Refrigeration degrades quietly. Condensing pressure creeps up, an evaporator ices, a door stays open, and the product stays cold, so no alarm sounds. Failed steam traps and unreturned condensate cost fuel, treated make-up water and chemicals. Power factor penalties and demand peaks show up on the invoice weeks after the shift that caused them.
And the plant is only part of it. Chilling centers and bulk milk coolers sit on unreliable power far from any engineer, and a failing compressor there shows up as a rejected tanker.
Production also changes with the season. Intake rises and falls with the flush and lean periods, product mix shifts between liquid milk, curd, butter, ghee and powder, and every change moves energy use. A plant that compares this month with last month on raw kWh learns very little. Energy has to be read against liters processed, weather and the products actually made, or every conversation about efficiency turns into an argument about the numbers.
What the best energy management system for dairy plants must do
| Requirement | Why it matters in dairy | Question to ask a vendor |
|---|---|---|
| Refrigeration plant metering | The largest electrical load degrades without tripping an alarm. | Can you track compressor power against suction and condensing conditions? |
| Steam and condensate | Failed traps and lost condensate cost fuel, water and chemicals. | Do you meter steam, make-up water and condensate return? |
| CIP energy and water | Cleaning runs on fixed timers and recipes, often longer than needed. | Can you measure energy and water per CIP cycle? |
| Energy per liter | Intake volume swings with the season. | Can you normalize energy for liters processed? |
| Power factor and demand | Penalties are set by a few minutes of poor operation. | Do you show power factor, reactive power and demand per feeder? |
| Remote chilling centers | Remote coolers fail where nobody is watching. | Can the same platform cover chilling centers over cellular or LoRaWAN? |
| SCADA safe integration | Process control must not be disturbed. | Is the connection to SCADA and PLCs read-only by default? |
| Verified savings | Projects need proof before the next one is funded. | Is every saving measured against an adjusted baseline and priced in our tariff? |
The categories dairy teams compare
- SCADA and PLCsRun pasteurizers, separators and CIP reliably. They record process values, but rarely baseline utility energy or price losses.
- Refrigeration controllersManage compressors and setpoints well. They usually report on their own plant only, not the energy per liter of the whole site.
- Standalone EMS dashboardsTrend meters and bills. Most cannot separate refrigeration drift from a busy intake day.
- IoT monitoring platformsGood for temperature alarms in coolers and cold stores. Often thin on electrical depth and steam.
- Consultants and energy auditsUseful for steam trap surveys and refrigeration studies. The picture goes stale between visits.
- Facility intelligence platformsRefrigeration, steam, water and electrical on one model from plant to chilling center, with verified results.
How to evaluate an energy management system for a dairy
- Walk the plant and pull the billsMap refrigeration plant, boilers, condensate return, CIP skids, compressors, panels and the RO and ETP. Pull 12 months of bills and intake volumes.
- Agree the intensity metricEnergy per liter processed, or per tonne of product, so every vendor reports on the same basis.
- Ask for a baseline from historyEach vendor should build a baseline from bills and intake records before sensors go in.
- Pilot refrigeration or steamMeter one system during production, name the losses in kWh and money, fix them and measure the result.
- Extend to chilling centersOnce the plant is trusted, test a standard sensing kit on a few remote coolers on the same portfolio.
Evaluation scorecard for dairy energy management
| Criterion | Weight | What good looks like |
|---|---|---|
| Refrigeration insight | High | Compressor power read against operating conditions |
| Steam and condensate | High | Make-up, return and trap losses measured |
| Energy per liter | High | Intensity normalized for intake and product |
| Electrical depth | Medium | Power factor, demand and loading per feeder |
| Remote sites | Medium | Chilling centers on the same portfolio |
| Safe integration | Medium | Read-only SCADA connection by default |
| Verification | Medium | Savings priced in your tariff and traced to a meter |
| Water link | Low | CIP and RO water on the same model as energy |
Integration and data in a dairy
Keep SCADA, PLCs and refrigeration controllers. The energy system reads them over Modbus or BACnet, read-only by default, and adds what they lack: feeder level power quality, compressor power, steam and condensate flow, and CIP energy and water per cycle.
Clamp-on flow, power and temperature sensors go in while lines run, and anything needing a line break waits for a planned shutdown. Remote chilling centers use cellular or LoRaWAN gateways. Findings route to the maintenance team's CMMS so every loss has an owner.
Data trust matters in a plant full of steam, washdown and steel. Ask how the system reports a sensor with a weak connection or a failing battery, and how it flags days with poor coverage. A loss named from patchy data will be challenged by the utilities engineer, and rightly so. Device health per sensor keeps the conversation on the plant rather than on the meter.
Compliance and reporting for dairies
Dairies report on energy, water and effluent to several audiences: ISO 50001 for the energy program, corporate sustainability disclosures such as BRSR in India, and customer and investor questionnaires. Effluent discharge limits from pollution control boards sit alongside energy, because CIP dumps affect both.
The energy system supplies measured figures per plant, per line and per liter. The plant's own teams, auditors and regulators take it from there.
Where Aqueduct fits
Aqueduct runs at major dairy operations, . aQ Core maps the plant and its chilling centers on one portfolio. aQ EnergySmart builds the electrical digital twin with power factor and feeder loading, and baselines refrigeration, steam and site energy against weather and intake. aQ WaterGuard closes the water balance across CIP, RO and STP. Upload 6 to 12 months of bills for a day-one baseline, and rate configuration prices every finding.
Plants keep SCADA. Where control is enabled, with owner approval, Smart Controls can act on approved utility equipment through BACnet or Modbus field devices or LoRaWAN relays, with every command logged.
A first engagement usually starts with a plant walk and a bill review, then an instrumentation plan signed off by the utilities engineer. Sensors go in during production, the water and thermal balances close, and the first losses are named in kWh, liters and money. Chilling centers follow as a standard kit once the plant model is trusted.