The best EHS monitoring software for manufacturing plants, and what it should measure
 Milvian AI teamFacilities and infrastructure intelligence
The best EHS monitoring software for a manufacturing plant measures air, water, effluent and energy continuously at the points your permits and policies name, keeps a timestamped record with data quality attached, raises alerts while there is still time to act, and exports evidence into the EHS suite that already runs incidents, permits and audits. It complements that suite rather than replacing it.
Why a manufacturing plant is a hard case for EHS monitoring
A plant changes every shift. Production mix, line speed, cleaning cycles, maintenance shutdowns and contractors on site all move the numbers an EHS manager is accountable for. Dust and fumes follow the welding bay and the packing hall. Compressed air leaks and steam traps waste energy that shows up in Scope 1 and 2. Effluent quality swings with what was cleaned and when. Most of this is measured, if at all, by a sample on a schedule that has nothing to do with the schedule of the work.
That gap is where findings come from. An auditor asks what the air in the grinding area was like on the night shift. A pollution board asks why treated effluent breached on a particular day. A corporate sustainability team asks why water intensity rose in a quarter when output did not. If the only record is a monthly sample and a utility bill, the honest answer is that nobody knows.
EHS software in the narrow sense, the suite that runs incidents, permits to work, audits, training and corrective actions, is not designed to close that gap. It records what people report. The missing layer is continuous measurement of the physical environment, tied to the places, lines and permits it relates to. This guide covers how to choose it.
What the best EHS monitoring software for manufacturing must do
| Requirement | Why it matters in manufacturing | Question to ask a vendor |
|---|---|---|
| Measure continuously at named points | Exposure and discharge vary by shift and batch, so a sample misses the events that matter | Which parameters do you read, at what interval, and from which hardware? |
| Map every reading to a place | A reading is only evidence if it belongs to a line, room, stack or outfall | How are sensors tied to site, floor, zone and asset? |
| Show data quality | A gap in the record is a finding of its own | Can I see connection rate and battery or supply health per sensor? |
| Alert while action is possible | A breach found at month end is already a breach | Who gets alerted, on what threshold, and is duration considered as well as level? |
| Close the water balance | Unaccounted water hides leaks, passing valves and unreported discharge | Can you reconcile intake against process, cooling, reuse and effluent? |
| Tie energy to emissions | Scope 1 and 2 figures need metered fuel and electricity, not allocations | Do you meter fuel and power by area and keep a weather-normalized baseline? |
| Export an audit-ready record | Auditors and boards ask for timestamped data for a defined period | What does an export for a quarter look like, and can my EHS suite import it? |
| Route findings to the right system | Maintenance faults belong in the CMMS, incidents in the EHS suite | Which systems can you send findings to, and how? |
| Stay honest about scope | Overlap with the EHS suite creates two versions of the truth | What do you not do, and what should stay in our EHS system? |
The tools manufacturing buyers compare, and where each one stops
- EHS management suitesStrong at incidents, near misses, permits to work, audits and inspections, training records, chemical inventories and corrective actions. They hold the workflow and the sign-offs. Most rely on people typing in readings, so environmental data arrives late, sampled or not at all.
- Environmental monitoring and lab servicesAccredited sampling and lab analysis remain the reference for regulated parameters. They are precise on the day, but a quarterly or monthly sample says nothing about the other days.
- BMS, SCADA and historiansGood at running equipment and storing tags. They were built for control engineers, so the data rarely reaches EHS in a form that answers an evidence question, and points outside the controls scope are not covered.
- Standalone sensor dashboardsQuick to deploy for one parameter, often air. They tend to stop at the chart: no water or energy balance, no baseline, no link to a work order, and a new login for every vendor.
- Spreadsheets plus consultantsFlexible and familiar, and consultants bring judgment. The data is assembled at report time, which is when gaps are discovered and cannot be filled.
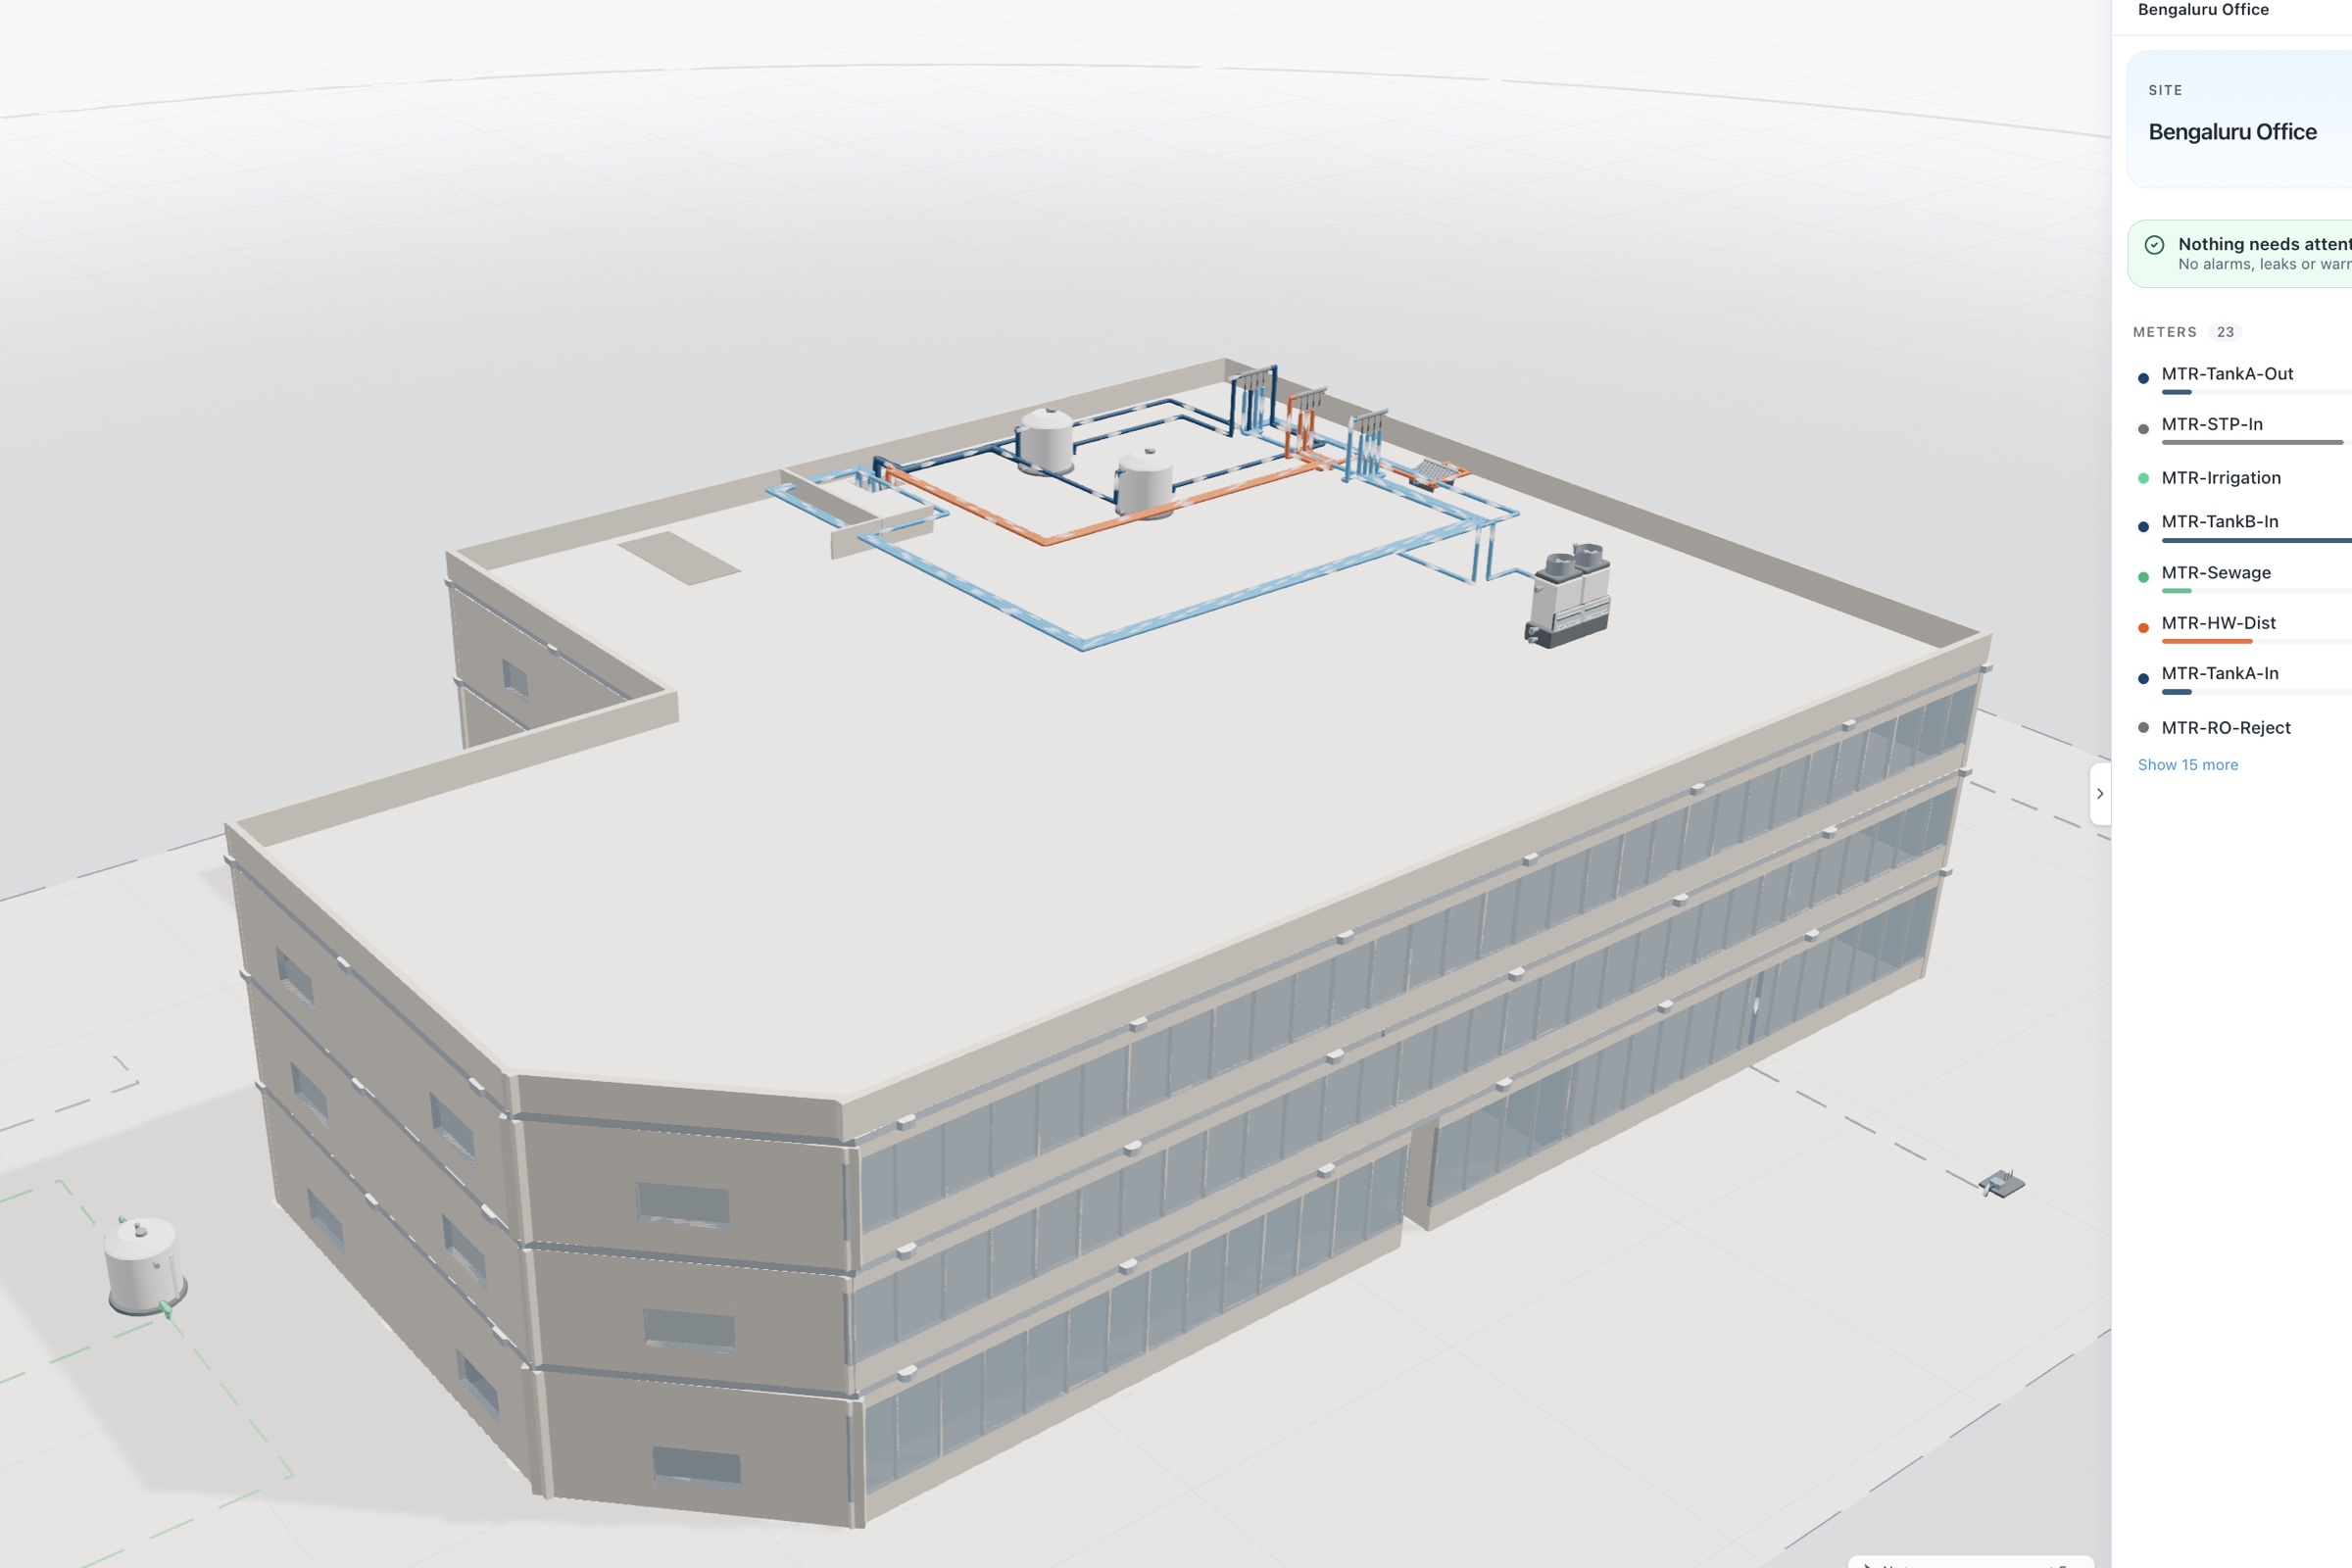
- Facility intelligence platformsContinuous measurement of air, water and energy on one data layer, with baselines, alerts, digital twins of the systems and exportable records. They give the EHS suite better inputs. They do not replace the EHS suite's workflows, and they should say so.
How to evaluate EHS monitoring for a plant, from walk-down to pilot
- Start with your obligationsList every consent, permit condition, internal standard and reporting framework the plant answers to. For each, write down the parameter, the location and how it is evidenced today.
- Walk the plant with the gaps in handVisit the outfalls, the effluent plant, the boiler house, the compressor room and the dusty or fume-heavy areas. Note where a sensor could sit, where power and network are, and where a line break would need a shutdown.
- Pull twelve months of bills and samplesUtility bills, lab reports and incident logs show where the plant has been surprised. They also give a baseline for energy and water on day one.
- Pilot one area that has a known problemChoose an outfall that breaches occasionally, or a production hall with exposure complaints. Agree what success means before the sensors go in.
- Judge the pilot on evidence, not chartsAt the end, ask for the export an auditor would see, the alerts that fired and what happened next. If the record would not survive an audit question, the pilot failed.
EHS monitoring scorecard for manufacturing
| Criterion | Weight | What good looks like |
|---|---|---|
| Coverage of your obligations | 20% | Every permit parameter and internal standard has a measured source or a stated reason it does not |
| Data quality and trust | 15% | Per-sensor health, gaps flagged, nothing silently interpolated |
| Alerting and response | 15% | Thresholds per zone, duration-aware alerts, named owners |
| Water and energy balances | 15% | Intake, process, reuse and discharge reconciled, fuel and power by area |
| Evidence exports | 15% | Timestamped records for any period, with the data quality alongside |
| Integration | 10% | Reads existing meters, BMS and SCADA, routes findings to CMMS and EHS suite |
| Honest scope | 10% | Clear about what stays in the EHS suite |
Integration and data: what to keep, what to add
Most plants already have more data than they use. Electricity and gas meters, a BMS on the offices and warehouse, SCADA or a historian on the process, and lab results in spreadsheets. A good monitoring layer reads what is there before it adds anything. Modbus and BACnet cover most meters and building controllers. Plant SCADA and historians should be read only, so the monitoring layer can never interfere with the process.
New measurement fills the gaps: wireless LoRaWAN sensors for air in production halls, clamp-on flow meters on branches that were never metered, pressure and level on tanks, and current transformers on panels feeding compressors and process loads. Wireless matters in a plant because cable runs are expensive and line breaks wait for shutdowns.
On the output side, keep the roles clean. Maintenance findings such as a passing valve or a failing extract fan go to the CMMS as work orders. Environmental exceedances that meet your incident criteria are raised in the EHS suite by the person accountable for them, with the measured record attached. The monitoring platform should feed both, and own neither.
Compliance and reporting in manufacturing
- Consents and discharge conditionsContinuous flow and quality at the effluent plant and outfall give the context around every lab sample, so a breach has a cause and a time.
- Workplace airContinuous readings in halls and booths show patterns by shift and task. Statutory exposure monitoring by a competent person still applies; continuous data shows where to look.
- ISO 14001 and ISO 50001Both ask for monitoring and measurement of significant aspects and energy uses. A metered, baselined record is the evidence those clauses expect.
- Sustainability disclosuresScope 1 and 2 energy and water intensity built from meters rather than allocations, with the method recorded, are easier to assure.
Where Aqueduct fits
Aqueduct is a facility intelligence platform, not an EHS management suite. It does not run incidents, permits to work, audits, training or chemical registers. It supplies the continuous environmental, air, water and energy evidence those workflows depend on.
aQ Core holds the hierarchy of site, floor, zone and device, so every reading belongs to a place, and each sensor reports its own connection and battery health. aQ AirSafe tracks CO2, VOCs, particulates, temperature and humidity per zone, with exposure measured in zone-hours because duration matters as much as level. aQ WaterGuard reconciles intake against process, cooling, reuse and discharge in a live water balance, and tracks treatment plant performance. aQ EnergySmart meters fuel and power by area against a weather-normalized baseline. aQ Assurance organizes the record into exports for any period; your team or consultant files and certifies.
You can keep the existing BMS and SCADA and read from them, replace an end-of-life system, or build measurement into a new line. Where control is enabled, with owner approval, Smart Controls can act on simple loads such as extract fans when air quality drifts, with every command logged. Aqueduct already runs on a 300-acre FMCG manufacturing campus.