The best EHS monitoring software for dairy and food processing plants
 Milvian AI teamFacilities and infrastructure intelligence

The best EHS monitoring software for dairy and food processing measures water per line and per cleaning cycle, effluent load and treatment performance, refrigeration and plant room air, and fuel and power continuously. It keeps a timestamped record with data quality, alerts before a discharge or room limit is breached, and exports evidence into the EHS and food safety systems that already exist.
Why dairy and food processing is a hard case for EHS monitoring
A dairy or food plant runs on water, heat and cold. Milk reception, pasteurization, evaporation, cleaning in place, refrigeration and the boiler house all draw water and energy, and almost all of it leaves the site as effluent with a heavy organic load. The effluent treatment plant has to cope with whatever production sends it, and production does not send it evenly. A product changeover, a dumped batch or a long cleaning cycle reaches the ETP as a shock.
The environmental obligations follow those flows. Discharge conditions on volume and quality, groundwater abstraction limits, boiler stack conditions, ammonia safety in refrigeration plant rooms and sustainability reporting on water and energy intensity. Most plants evidence these with lab samples, logbooks and monthly bills, which tell you what happened on the sample day and nothing about why the effluent turned on a Tuesday night.
Food safety systems add their own discipline. They already hold the hygiene records, the cleaning verification and the allergen controls. An EHS monitoring layer should respect that and not create a parallel record. Its job is to measure the physical environment continuously, attribute events to the line and the cycle that caused them, and hand clean evidence to the people who own each obligation.
What the best EHS monitoring software for dairy and food must do
| Requirement | Why it matters in dairy and food | Question to ask a vendor |
|---|---|---|
| Meter water per line and per cycle | Cleaning in place and process water are the largest draws and the largest effluent sources | Can you show water per CIP circuit and per cycle, against the last comparable cycle? |
| Close the site water balance | Abstraction limits and reuse claims need every entry and exit measured | How do you reconcile intake, process, cooling, reuse and discharge? |
| Track ETP performance continuously | Shock loads and poor treatment are seen first in flow and quality trends | Which ETP parameters do you read, and can you tie a spike to its source? |
| Watch plant room air | Refrigeration rooms carry a safety risk that needs continuous detection | How do you integrate with existing gas detection without replacing it? |
| Baseline refrigeration and steam | Compressors and boilers drive energy and Scope 1 and 2 | Do you baseline against production and weather, not just time? |
| Show data quality | A record with silent gaps fails an audit | Is per-sensor health visible and exported? |
| Export evidence by period | Boards and auditors ask for defined periods | What does a quarterly export contain? |
| Respect food safety records | Duplicate hygiene records create conflict | What stays in our food safety and EHS systems? |
The tools dairy and food buyers compare, and where each one stops
- EHS management suitesStrong at incidents, near misses, permits to work, audits and inspections, training records, chemical inventories and corrective actions. They hold the workflow and the sign-offs. Most rely on people typing in readings, so environmental data arrives late, sampled or not at all.
- Environmental monitoring and lab servicesAccredited sampling and lab analysis remain the reference for regulated parameters. They are precise on the day, but a quarterly or monthly sample says nothing about the other days.
- BMS, SCADA and historiansGood at running equipment and storing tags. They were built for control engineers, so the data rarely reaches EHS in a form that answers an evidence question, and points outside the controls scope are not covered.
- Standalone sensor dashboardsQuick to deploy for one parameter, often air. They tend to stop at the chart: no water or energy balance, no baseline, no link to a work order, and a new login for every vendor.
- Spreadsheets plus consultantsFlexible and familiar, and consultants bring judgment. The data is assembled at report time, which is when gaps are discovered and cannot be filled.
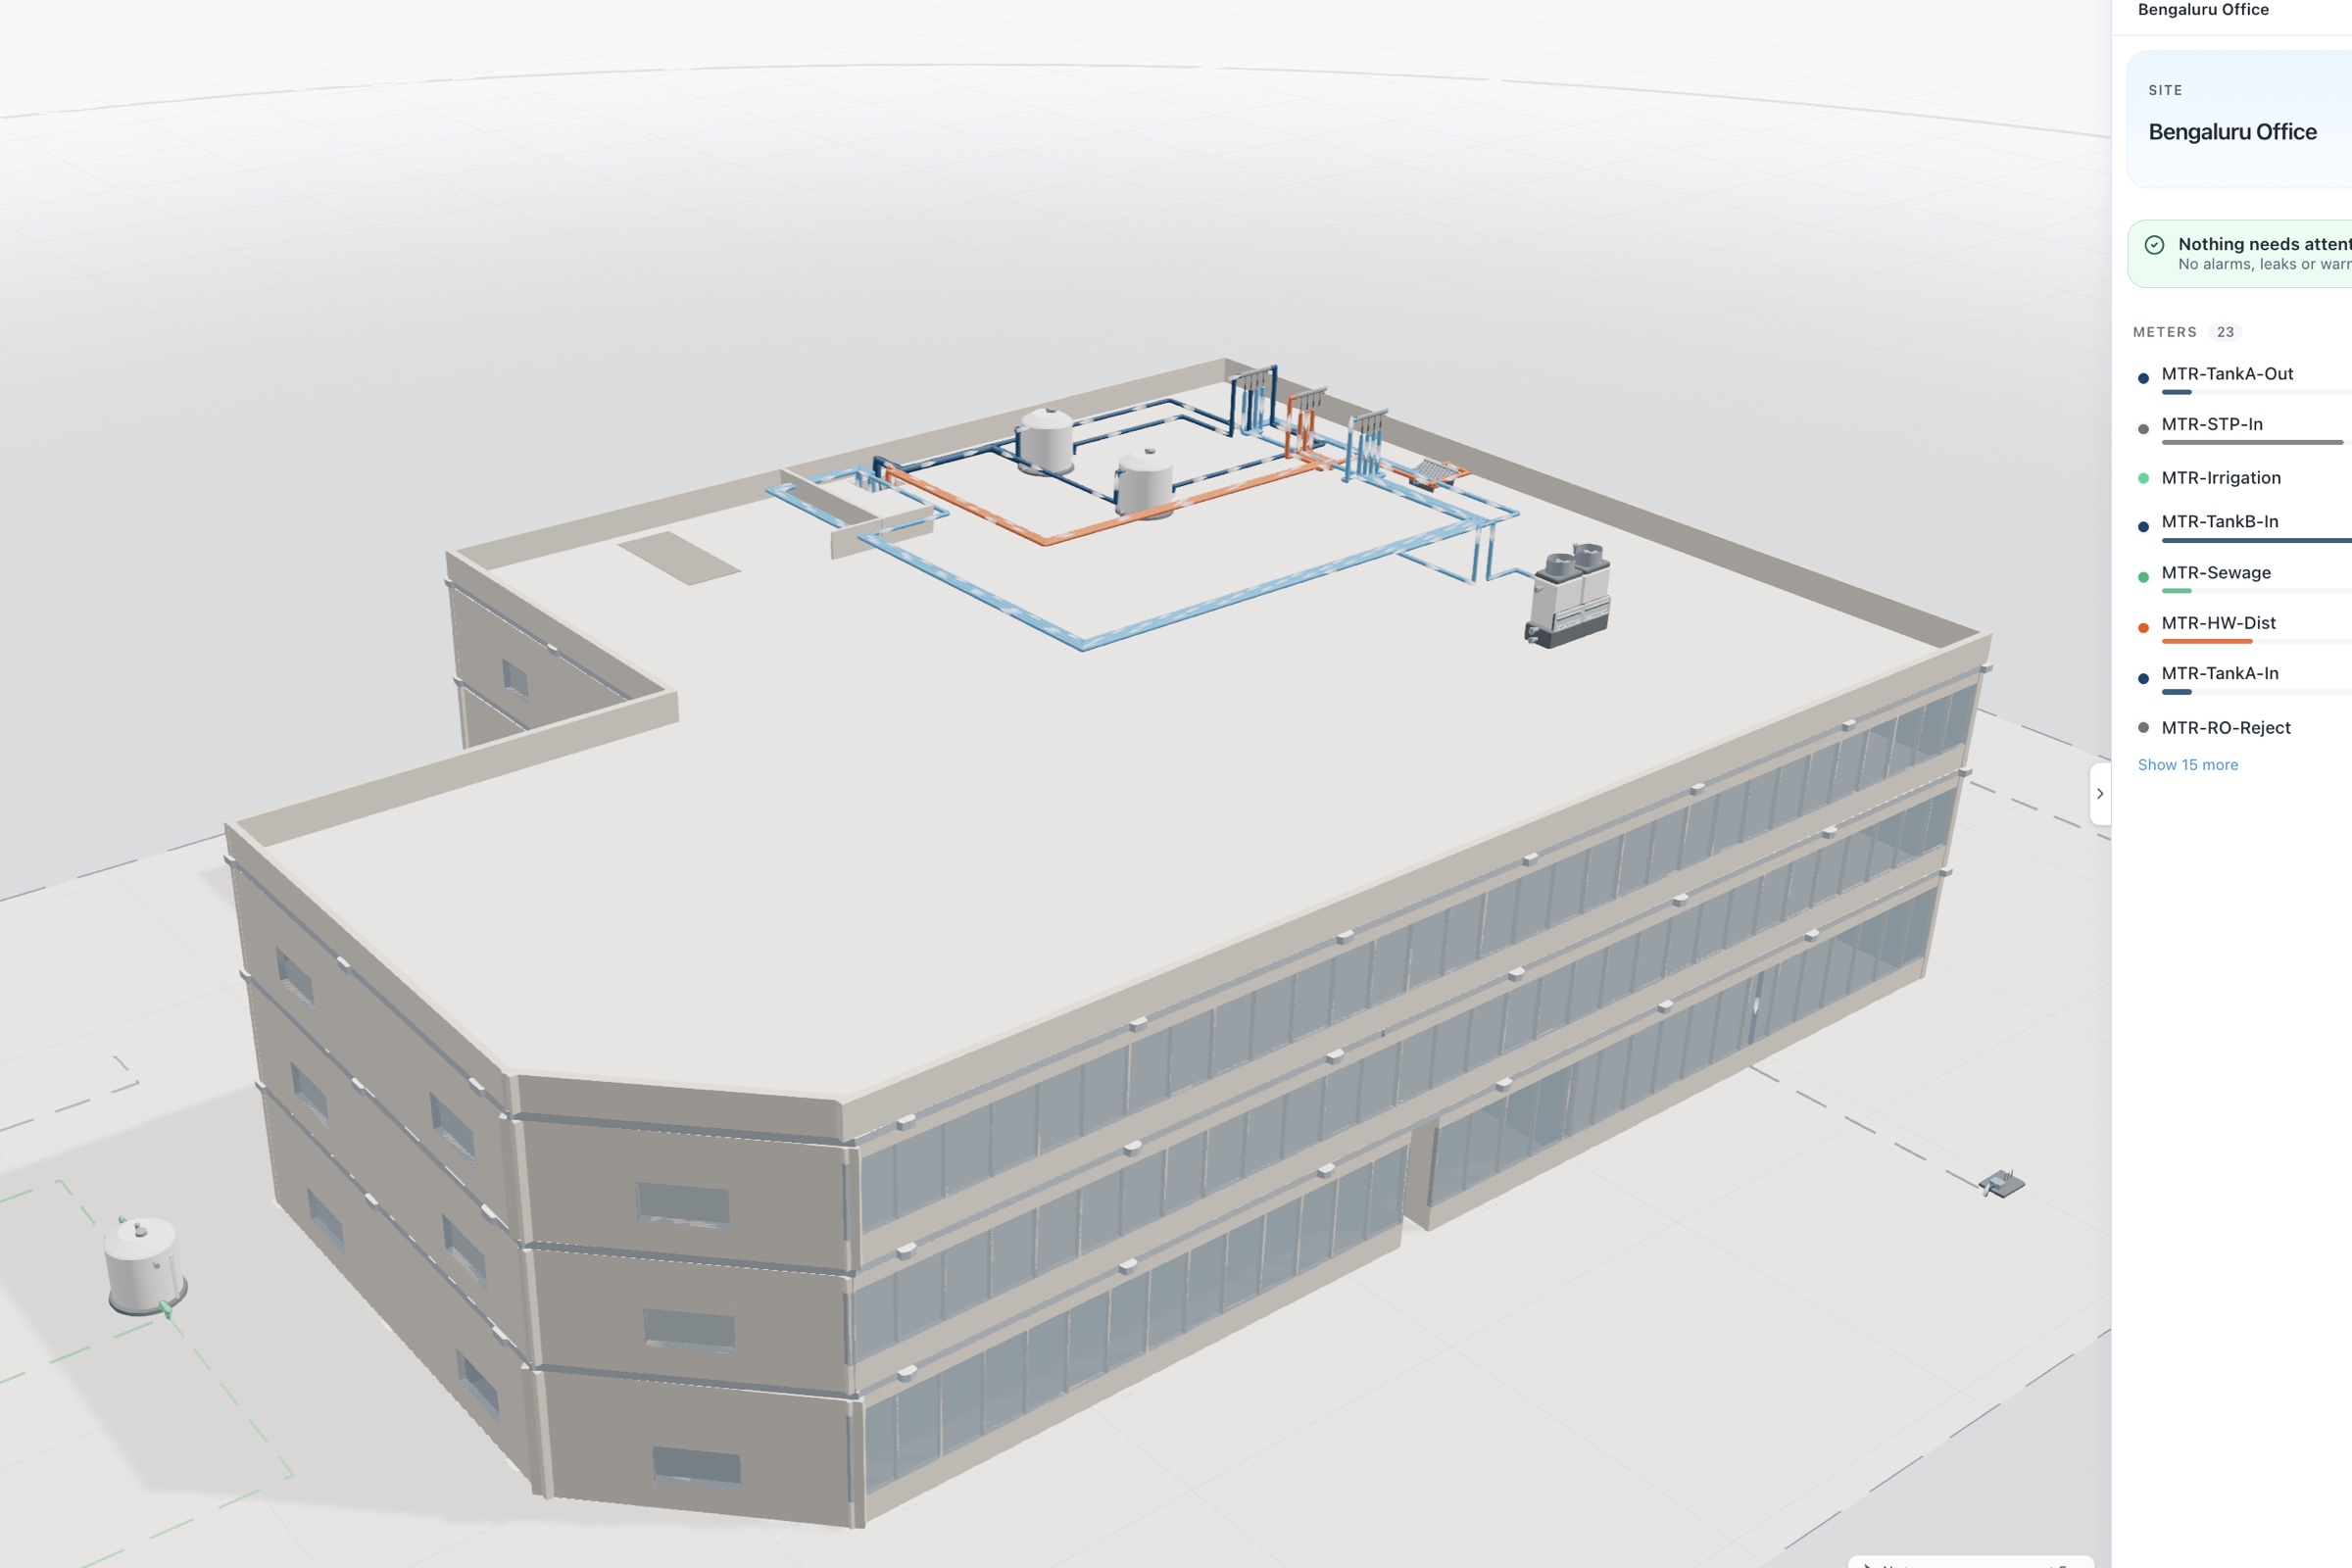
- Facility intelligence platformsContinuous measurement of air, water and energy on one data layer, with baselines, alerts, digital twins of the systems and exportable records. They make water, effluent and energy measurable by line and cycle. They do not replace the EHS suite's workflows, and they should say so.
How to evaluate EHS monitoring for a dairy or food plant
- List the obligations and who owns themDischarge conditions, abstraction permits, stack conditions, refrigeration safety, and the water and energy metrics in your sustainability reporting. Name the owner for each.
- Walk the water from intake to outfallBorewell or municipal intake, raw water treatment, reception, process lines, CIP sets, cooling, boiler feed, ETP and reuse. Mark what is metered and what is estimated.
- Gather bills, lab results and logbooksTwelve months of utility bills set a baseline. ETP lab results and logbooks show the events that went unexplained.
- Pilot on the ETP and one CIP circuitThese two together show whether the platform can tie an effluent event to the cleaning cycle that caused it.
- Test the export with your auditor in mindAsk for the period record a board or assurer would request, with gaps and sensor health shown. Judge the pilot on that.
EHS monitoring scorecard for dairy and food processing
| Criterion | Weight | What good looks like |
|---|---|---|
| Water attribution | 20% | Water per line and CIP cycle, with a balance that closes |
| Effluent and ETP visibility | 20% | Inflow, quality and treatment performance trended, spikes attributed |
| Refrigeration and plant room coverage | 15% | Room air and compressor energy watched, existing gas detection respected |
| Energy baseline | 15% | Refrigeration and steam baselined against production and weather |
| Evidence exports | 15% | Period records with data quality, ready for boards and assurers |
| Integration and scope | 15% | Reads SCADA read only, routes to CMMS, leaves EHS and food safety workflows alone |
Integration and data in a food plant
Dairy and food plants usually have plant SCADA or a historian on the process, a separate controller on refrigeration, a boiler control panel and a set of utility meters. The monitoring layer should read these through Modbus, BACnet or the historian, read only, so it can never touch a process interlock. Gas detection in refrigeration rooms stays as installed; its alarms are safety systems and should be read, not replaced.
New measurement goes where the gaps are. Clamp-on flow meters on CIP supply and return, conductivity where cycles need to be separated, flow and level at the ETP, and LoRaWAN air sensors in packing halls and plant rooms. Wireless sensors avoid line breaks in hygienic areas and can be fitted during normal running.
Outputs go to their owners. Passing valves, failing traps and compressor drift go to the CMMS as work orders. Effluent events that meet your reporting criteria are raised in the EHS system by the accountable person with the measured record attached. Production and quality teams see water and energy per line in the terms they already use.
Compliance and reporting in dairy and food
- Discharge and reuse conditionsContinuous ETP inflow, treated outflow and reuse volumes give context to every sample and support reuse claims.
- Groundwater and abstractionMetered intake by source, kept as a continuous record, answers abstraction conditions such as a CGWA NOC in India.
- ISO 14001, ISO 46001 and ISO 50001Monitoring and measurement clauses for environmental aspects, water efficiency and energy are answered by metered, baselined data.
- Sustainability reportingWater and energy intensity per unit of product, from meters, supports BRSR and GHG Protocol Scope 1 and 2 reporting.
Where Aqueduct fits
Aqueduct is not an EHS suite or a food safety system. It does not hold incidents, permits, hygiene records or audit workflows. It supplies continuous water, effluent, air and energy evidence to the teams and systems that do.
aQ WaterGuard builds the site water balance block by block, including RO and treatment plant performance, and compares each cleaning cycle with the last comparable one on the same circuit. aQ AirSafe watches packing halls and plant rooms. aQ EnergySmart baselines refrigeration, steam and power against production and weather. aQ PredictIQ watches compressors for vibration and energy drift. aQ Assurance keeps the record and exports it for any period; your team or consultant files and certifies. aQ Core ties every reading to a site, line, zone and device, with sensor health visible.
Aqueduct works with major dairy operations, . Plants can keep their SCADA and BMS and read from them, replace an end-of-life metering system, or build measurement into a new line. Where control is enabled, with owner approval, Smart Controls can act on simple loads, with every command logged.