The best dairy intelligence platform for process water, refrigeration and steam
 Milvian AI teamFacilities and infrastructure intelligence
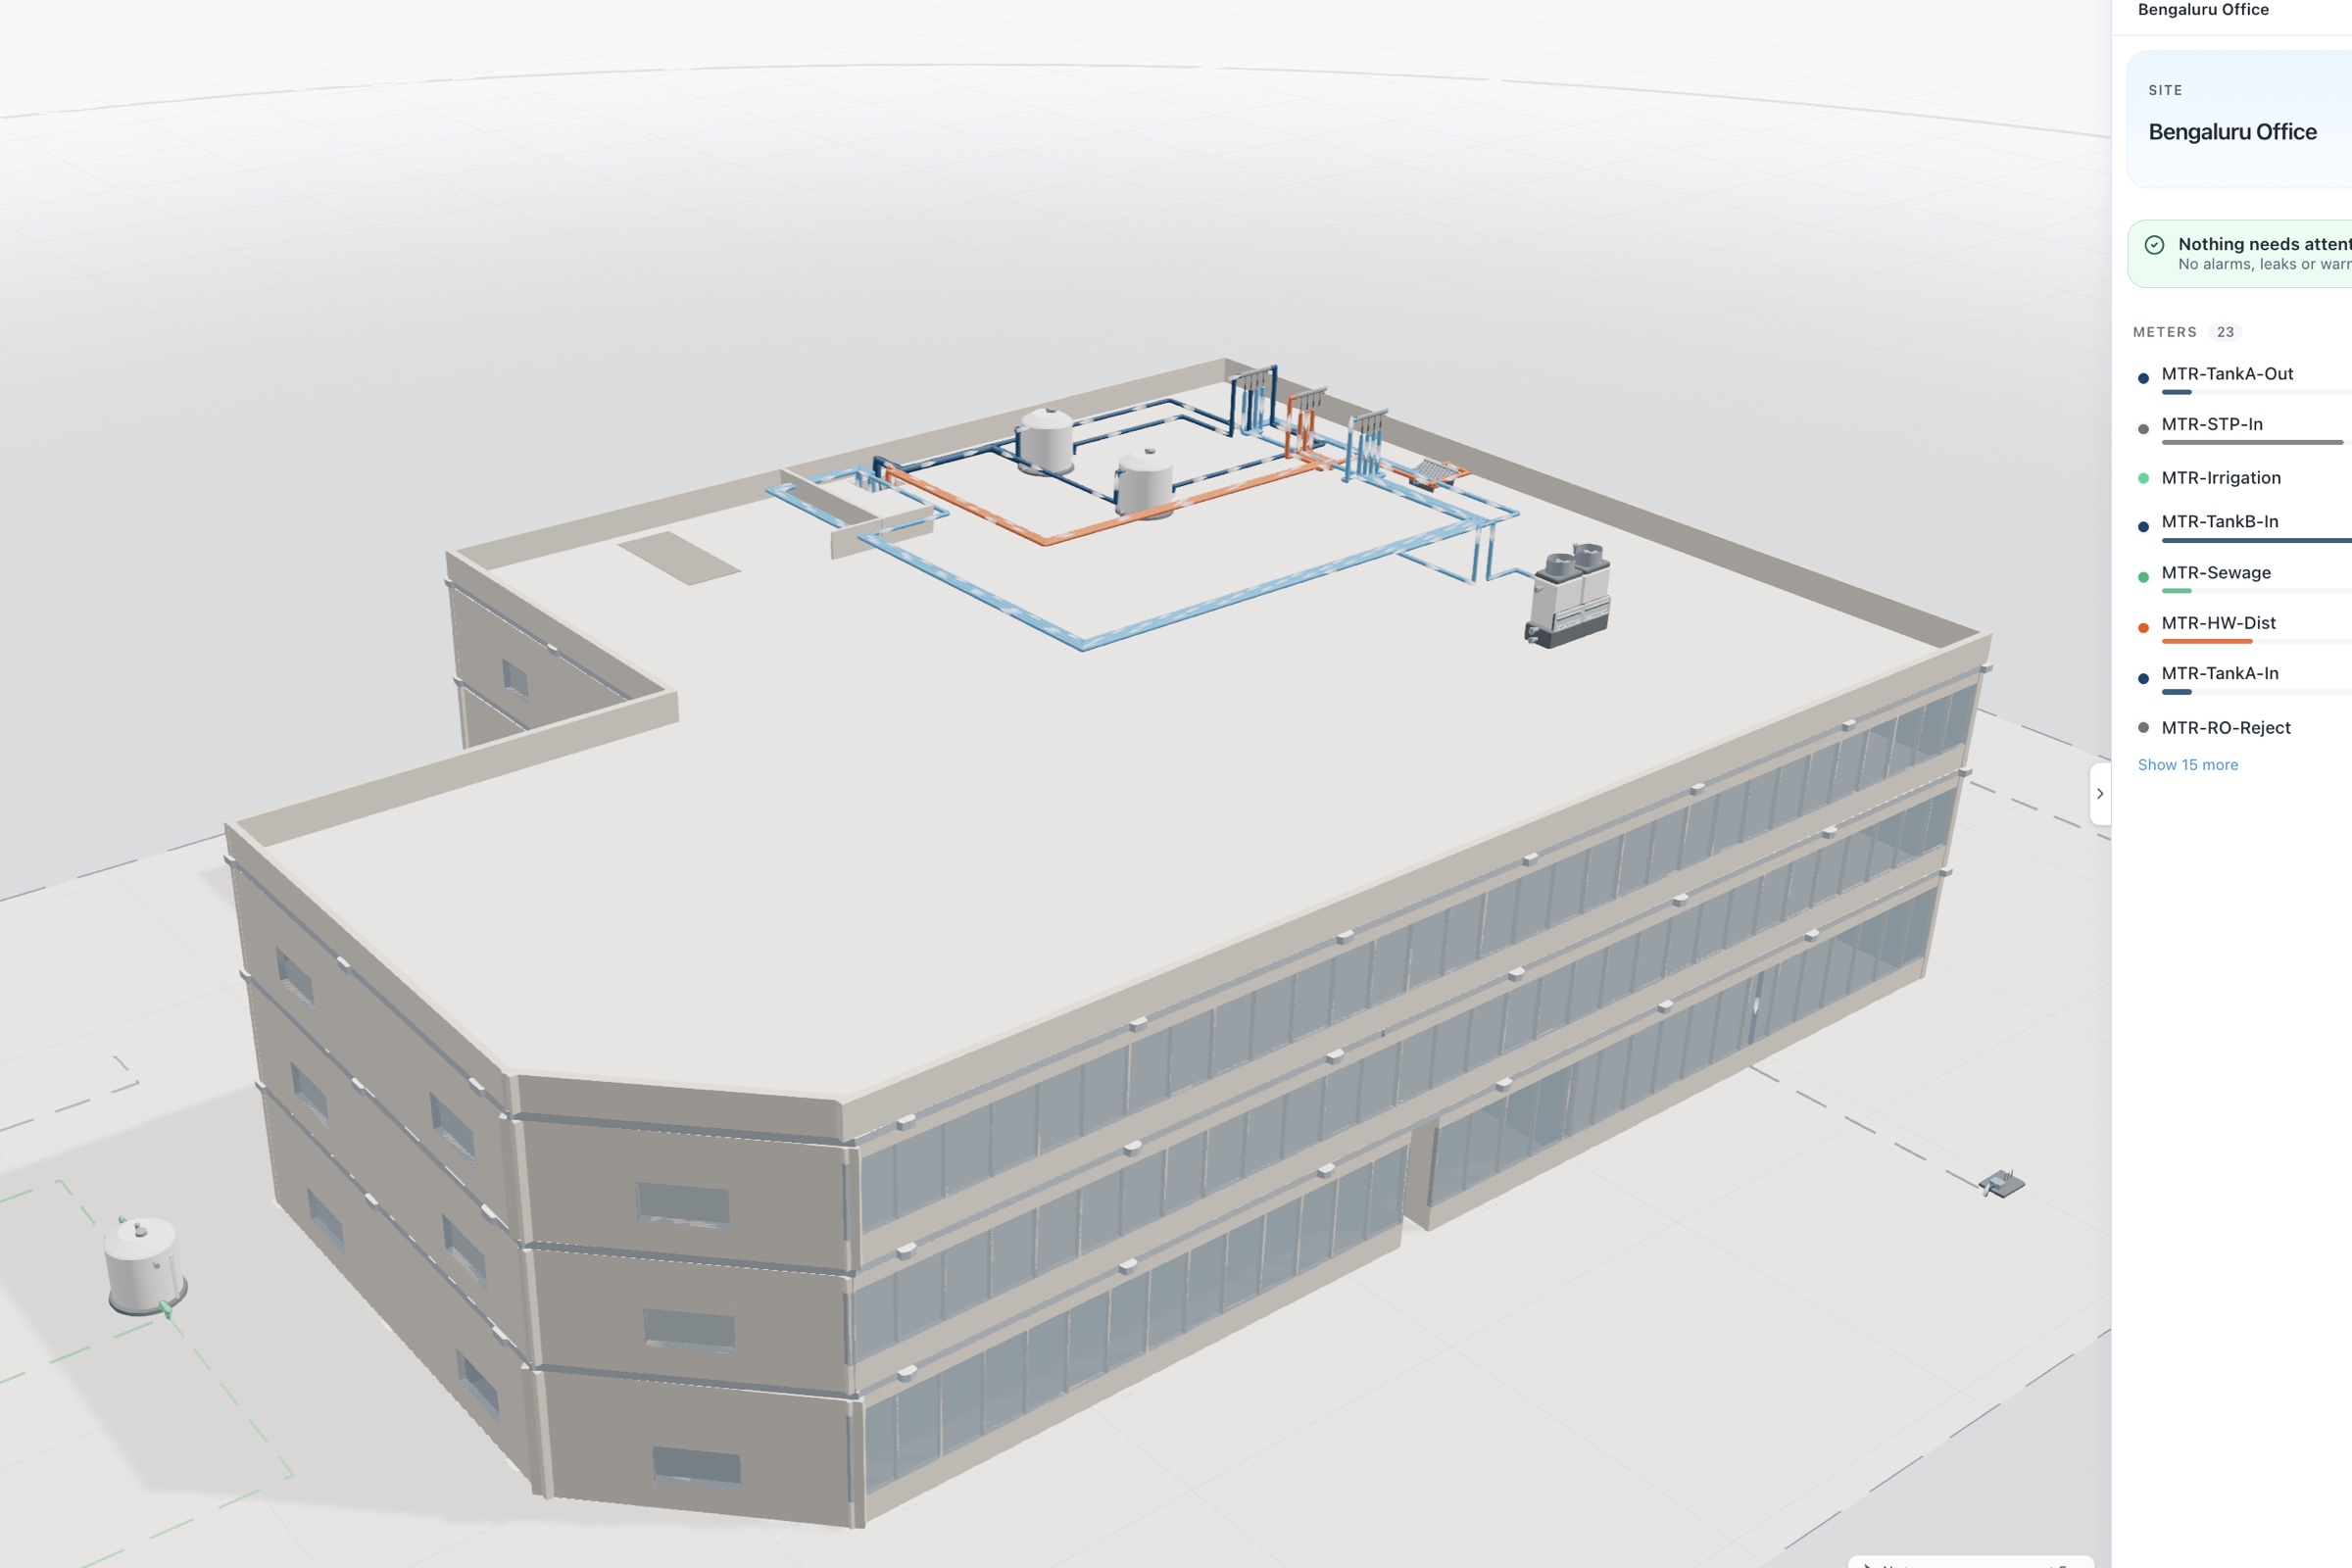
The best dairy intelligence platform puts process water, cleaning in place, refrigeration, steam, effluent and plant air onto one live data layer. It meters water per line and per cleaning cycle, baselines refrigeration and boilers against production and weather, tracks the ETP, catches compressor drift before failure, routes faults to the CMMS, and acts on equipment only where control is enabled, with owner approval.
Why a dairy is a hard case for facility systems
A dairy plant is a utilities business wrapped around a food business. Milk arrives cold and must stay cold. It is pasteurized with heat, sometimes evaporated or dried with more heat, then cooled again. Every line, tank and silo is cleaned in place, often several times a day, with water, chemicals and heat. Refrigeration compressors run around the clock. The boiler house supplies steam to most of the process. And almost everything that does not leave as product leaves as effluent with a heavy organic load.
The cost of each of these is real, but most plants see them only as totals. One water meter at the intake, one electricity bill, a fuel invoice and an ETP logbook. A cleaning cycle that runs longer than it needs, a compressor losing efficiency, a steam trap failing open or a passing valve on a CIP return all hide inside those totals until the month closes.
Plant SCADA runs the process well, and it should be left alone to do that. What dairies lack is a layer that measures utilities by line, cycle and asset, compares each against what it should be, and gives production, maintenance and sustainability teams the same numbers.
Dairy groups face the same problem at scale. Processing plants, chilling centers and sometimes farms all draw water and power, but each reports differently, and the group cannot tell whether one plant uses more water per liter of milk because of its product mix or because of losses. A platform that holds every site in one portfolio, normalized by production, lets the group compare like with like and send attention where it pays.
What the best dairy intelligence platform must do
| Requirement | Why it matters in a dairy | Question to ask a vendor |
|---|---|---|
| Meter water per line and cycle | CIP and process water are the largest draws | Can you show water per CIP circuit and compare each cycle with the last comparable one? |
| Close the site water balance | Unaccounted water hides leaks and passing valves | How do you reconcile intake, process, cooling, reuse and discharge? |
| Baseline refrigeration | Compressors run continuously and drift quietly | Do you baseline against production and weather, per compressor? |
| Close the thermal loop | Steam losses raise fuel and water together | Do you meter steam, condensate return and blowdown? |
| Track the ETP | Shock loads from cleaning and dumps upset treatment | Can you tie an effluent spike to its source? |
| Catch drift before failure | A refrigeration failure risks product | Do you read vibration and energy signatures on rotating equipment? |
| Read SCADA safely | Process control must not be touched | Is integration read only, and how is that enforced? |
| Cover several plants and farms | Groups compare sites and chilling centers | Can every plant sit in one portfolio? |
The categories of tools dairy teams compare
- Plant SCADA and historiansExcellent process control and tag history. They rarely reconcile water, baseline utilities against production or route findings in a form maintenance and sustainability teams use.
- Traditional BMSGood for offices and warehouses on site. Usually outside the process and the utilities that drive cost.
- Standalone EMS dashboardsInterval energy charts, often electricity only. Little on water, steam or effluent.
- Refrigeration controllers and vendor monitoringDeep on one system and often good. They do not see the rest of the plant.
- CMMS and EAMThe right home for assets and work orders. They wait to be told what is wrong.
- Facility intelligence platformsWater, energy, steam, refrigeration and air on one data layer, with live digital twins, baselines and predictive maintenance, feeding the CMMS and leaving the process to SCADA.
How to evaluate a dairy intelligence platform
- Walk from reception to effluentMilk reception, silos, pasteurizers, evaporators or dryers, CIP sets, refrigeration, boiler house, ETP and reuse. Mark meters and gaps.
- Gather bills, production and logsTwelve months of bills and production data set baselines per unit of product. ETP and maintenance logs show recurring events.
- Pilot on CIP and refrigerationThese show water and energy value fastest, and refrigeration adds the reliability case.
- Fit clamp-on and wireless firstMost measurement goes in during normal running. Line breaks wait for a planned shutdown.
- Judge on verified resultsWater per cycle, compressor efficiency against baseline, ETP events attributed, faults caught early.
Dairy intelligence platform scorecard
| Criterion | Weight | What good looks like |
|---|---|---|
| Water attribution | 20% | Water per line and CIP cycle, balance closes |
| Refrigeration and steam | 20% | Compressors and boilers baselined against production and weather |
| Effluent visibility | 10% | ETP trended, spikes attributed |
| Predictive maintenance | 15% | Vibration and energy drift caught on rotating equipment |
| Integration safety | 15% | SCADA read only, CMMS routing |
| Portfolio | 10% | Plants and chilling centers compared |
| Control and audit | 10% | Where control is enabled, with owner approval, every command logged |
Integration and data in a dairy
Most dairies have plant SCADA or a historian, refrigeration controllers, boiler controls and utility meters. The platform reads them over Modbus or from the historian, read only. Clamp-on flow meters, conductivity on CIP circuits, current transformers on compressors and pumps, vibration and acoustic sensors on rotating equipment and wireless air sensors in plant rooms fill the gaps.
ERP data on production volumes lets the platform express water and energy per unit of product. Findings route to the CMMS. Sustainability and finance get exports with water and energy intensity per product line.
Keep, replace or build applies here too: keep sound systems and read them, replace end-of-life metering, and design measurement into new lines and expansions.
Compliance and reporting for dairies
- ISO 50001 and ISO 46001Energy and water efficiency programs built on metered, baselined data.
- ISO 14001Monitoring and measurement of environmental aspects such as effluent.
- Abstraction and dischargeMetered intake by source and ETP records support conditions such as a CGWA NOC in India.
- BRSR and GHG ProtocolWater and energy intensity and Scope 1 and 2 data traced to meters.
Where Aqueduct fits
Aqueduct is a facility intelligence platform. aQ WaterGuard builds the plant's water balance block by block, including RO and treatment performance, and compares each cleaning cycle with the last comparable one. aQ EnergySmart baselines refrigeration, steam and power against production and weather, with the electrical single line live. aQ PredictIQ reads compressor vibration, a changing sound signature and energy drift, and flags maintenance before failure. aQ AirSafe watches plant rooms and work areas. aQ Core holds every plant, line, zone and device.
Aqueduct works with major dairy operations, . Dairies keep SCADA and read from it, replace end-of-life metering, or build measurement into new lines. Where control is enabled, with owner approval, Smart Controls acts on utility equipment such as fans and pumps, never process interlocks, with every command logged.