The best campus intelligence platform for universities and school estates
 Milvian AI teamFacilities and infrastructure intelligence
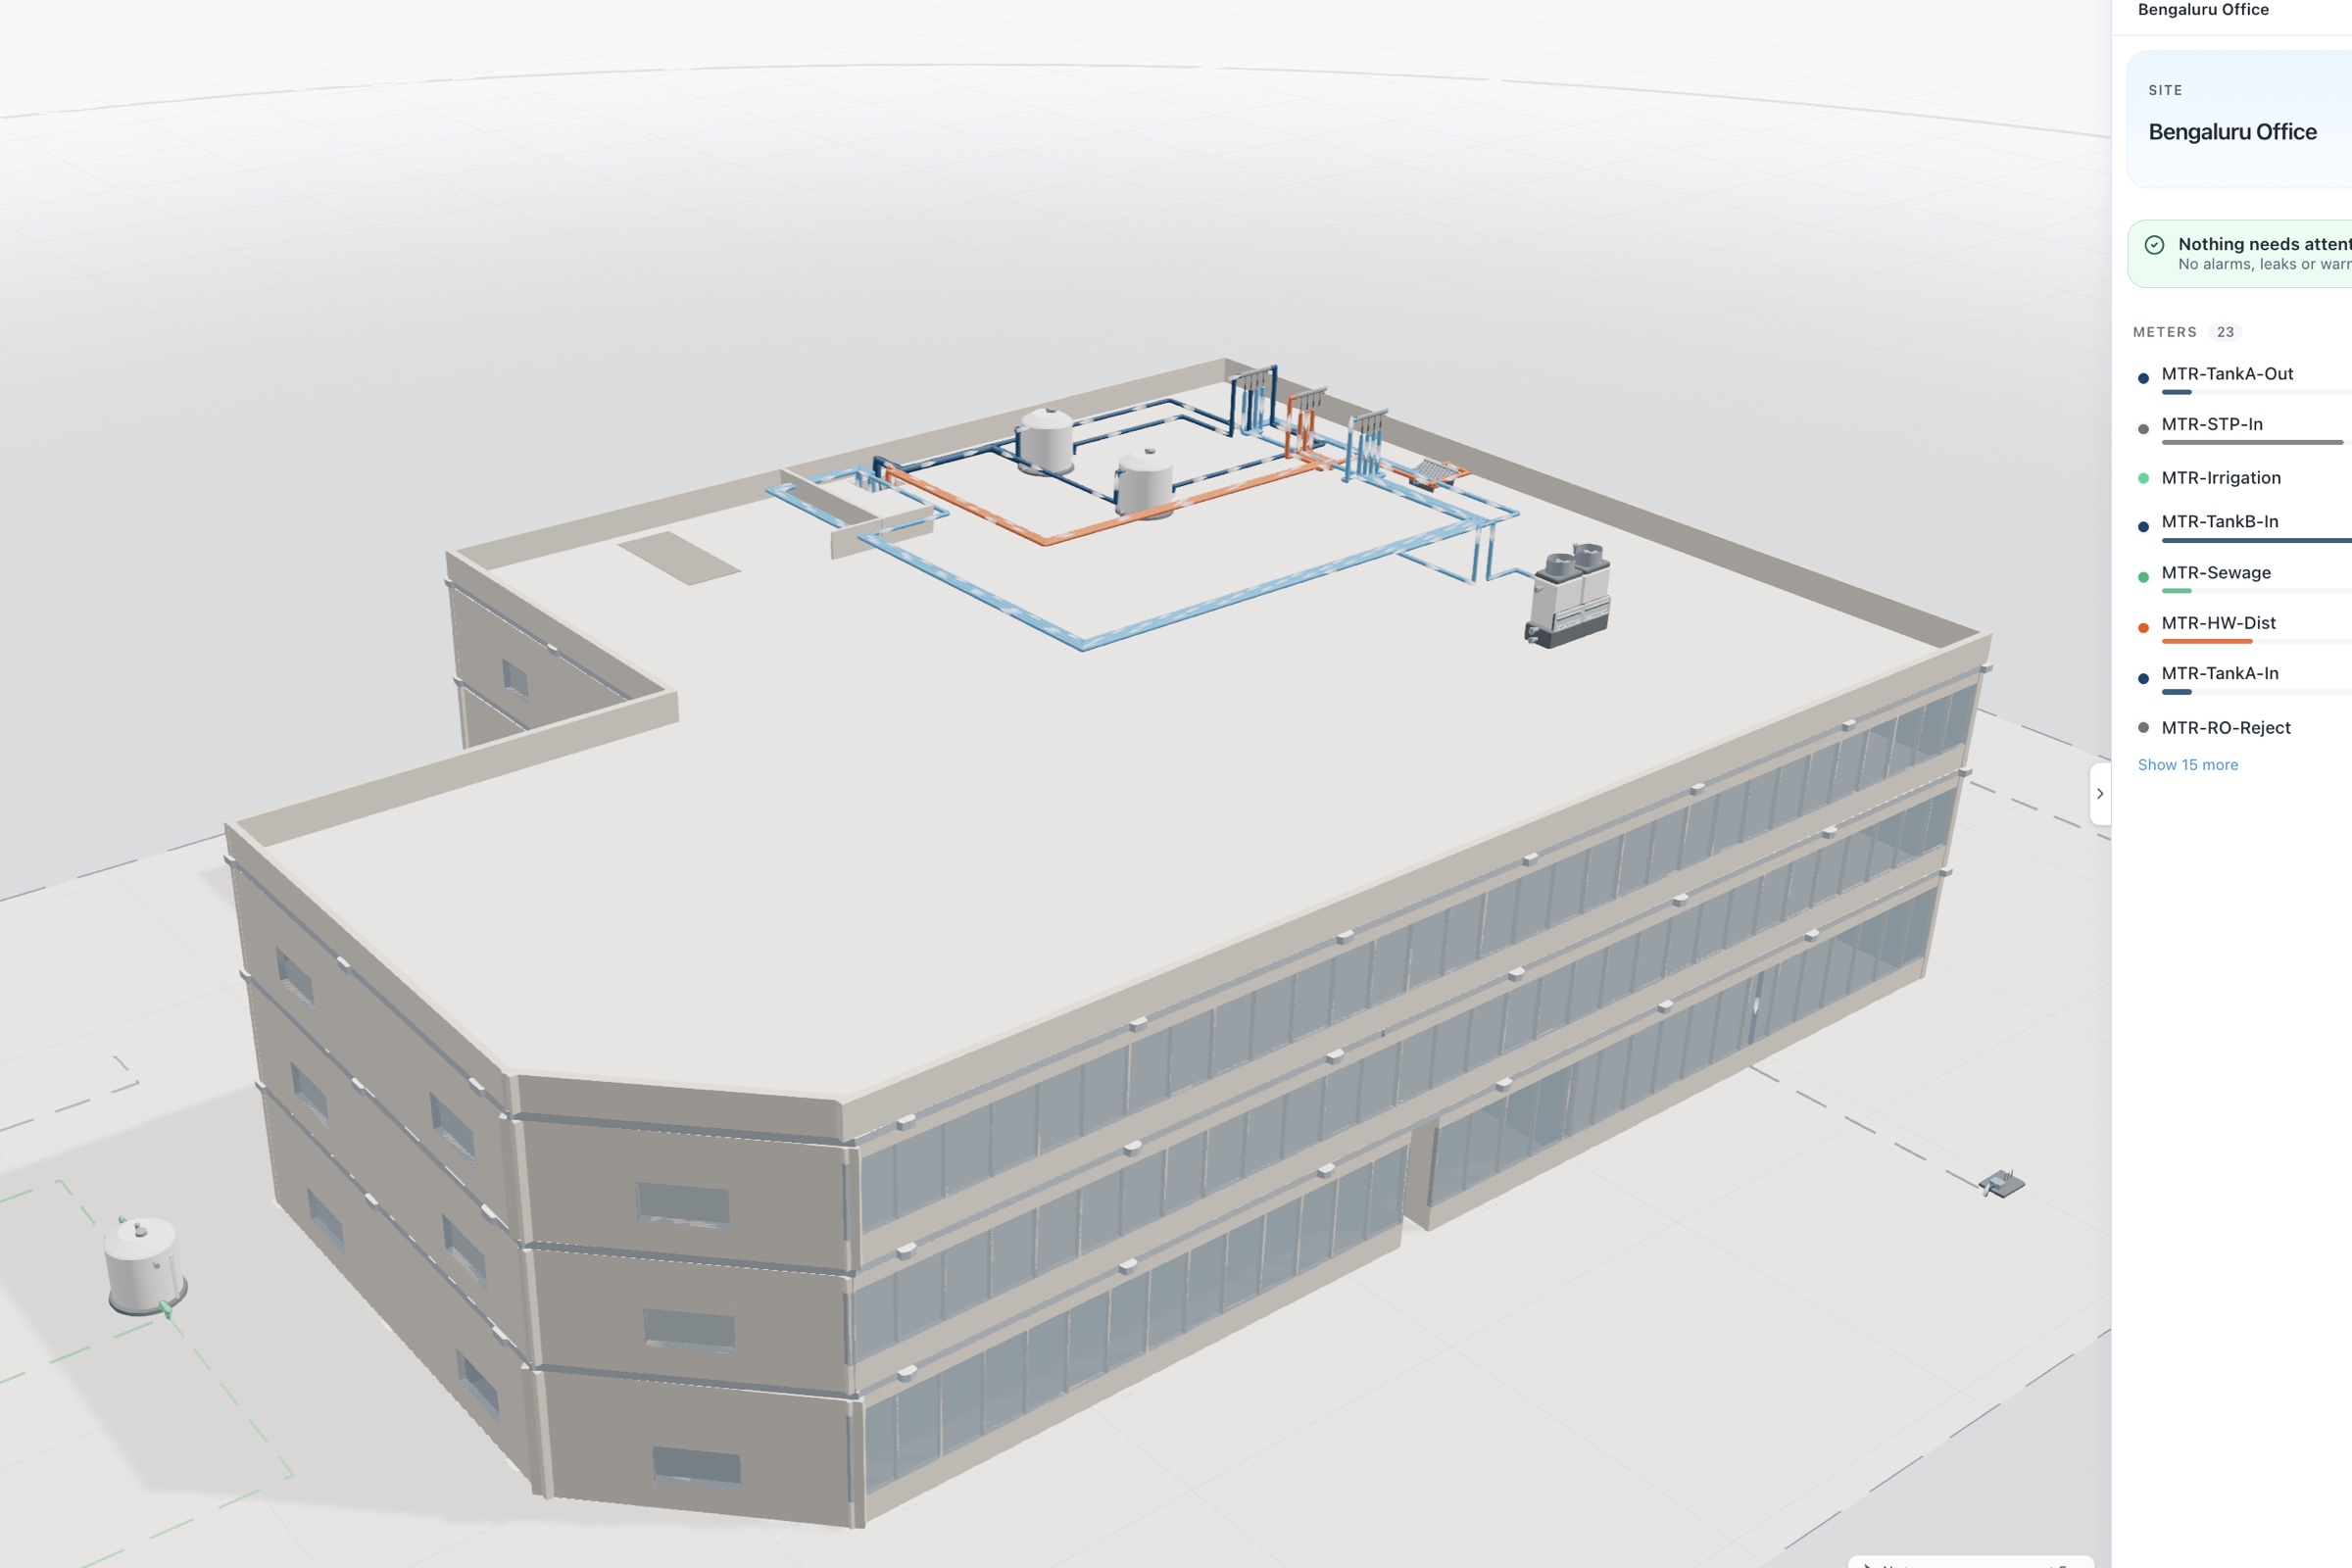
The best campus intelligence platform brings every building, the central plant, the water network and classroom air onto one live data layer. It follows the academic calendar and real occupancy, baselines each building against weather, balances campus water, finds faults and routes them to the CMMS, ranks buildings for capital planning, and acts on equipment only where control is enabled, with owner approval.
Why a campus is a hard case for facility systems
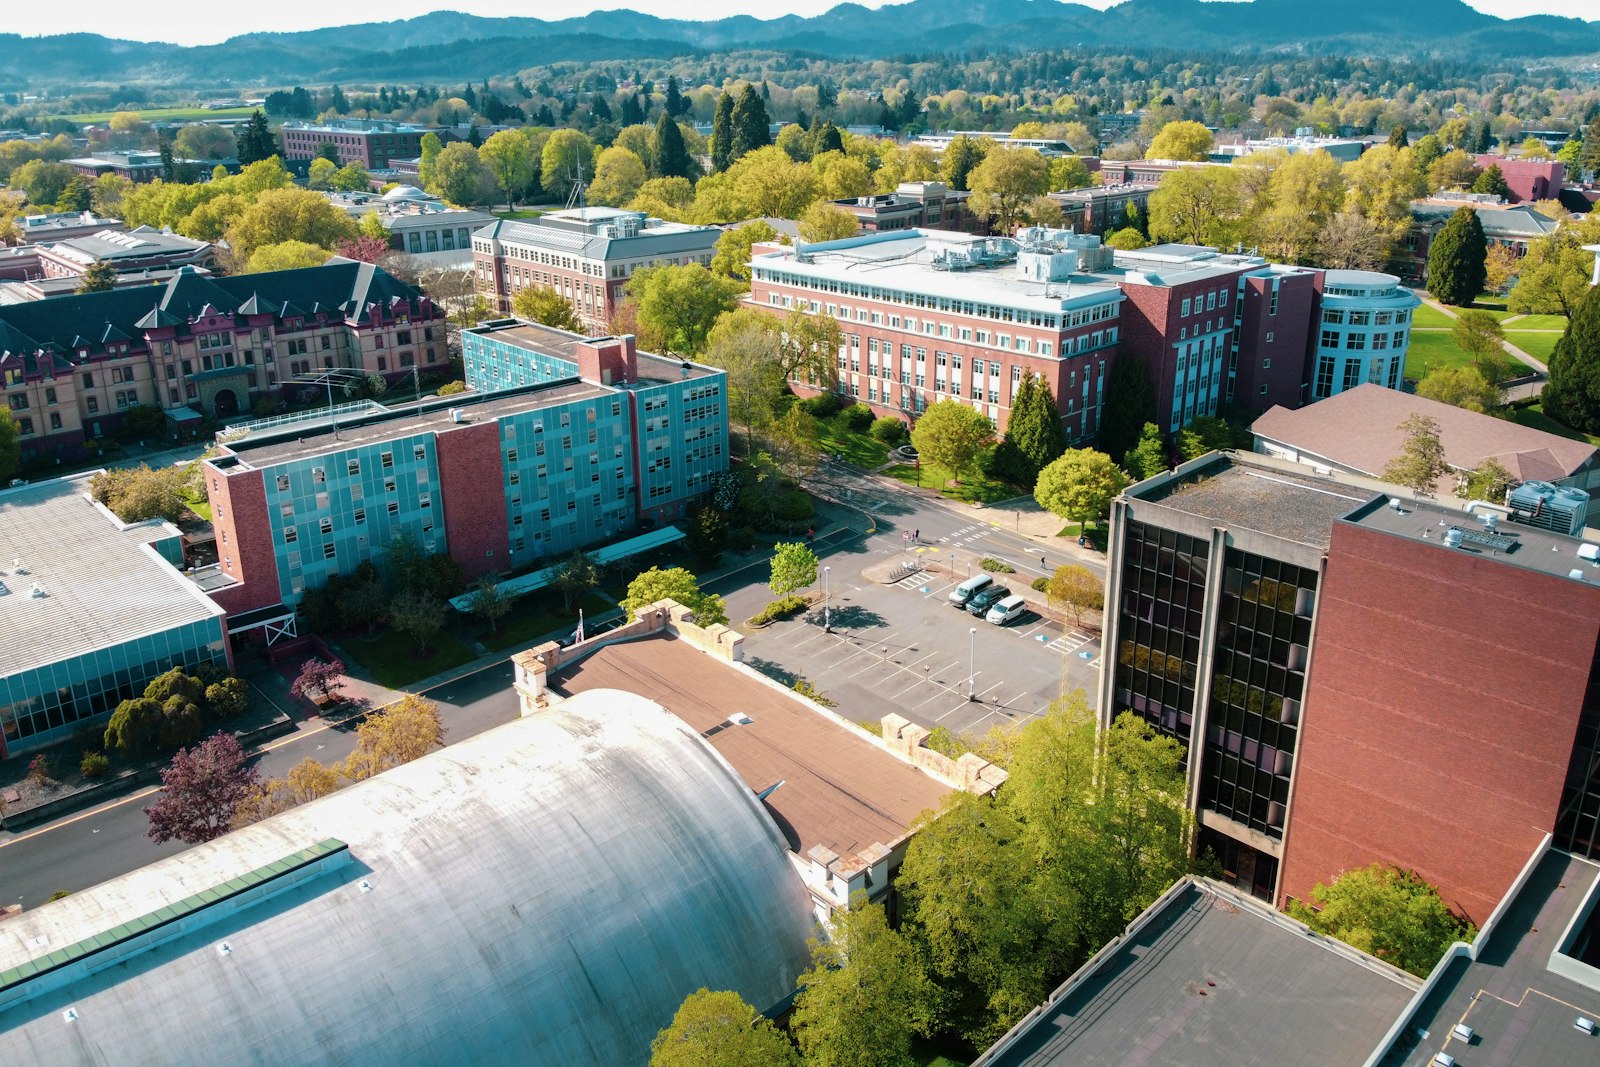
A campus is dozens of buildings of different ages, uses and systems, often fed by a shared central plant and a private water and power network. Lecture halls fill and empty by the hour. Labs run fume hoods and freezers around the clock. Residences behave like apartments. Libraries, sports centers and dining halls each have their own pattern. And the whole estate follows an academic calendar with terms, exams, holidays and summer schools.
Most campuses have grown one building at a time, so there are several BMS generations, meters that report to different places and some buildings with no sub-metering at all. The estates team is asked to cut carbon, keep classrooms comfortable, explain the utility bill and plan capital, often with less data than a single office building would have.
Students, faculty and boards also want to see progress. Sustainability commitments are public, and a campus that cannot show measured results loses credibility. The platform has to serve the estates team, finance, sustainability and leadership from the same data.
What the best campus intelligence platform must do
| Requirement | Why it matters on a campus | Question to ask a vendor |
|---|---|---|
| Hold the whole estate | Buildings, plant and networks share services | Can every building, plant and network sit in one hierarchy? |
| Follow the academic calendar | Terms, exams and holidays change every load | Can calendars and timetables drive baselines and automations? |
| Use real occupancy | Timetabled rooms are often empty | Do you read occupancy from sensors as well as schedules? |
| Baseline each building | Comparing labs with dorms is meaningless without normalization | Are baselines per building, normalized for weather and area? |
| Balance campus water | Buried mains and irrigation hide losses | Do you reconcile supply against buildings and uses? |
| Watch classroom air | Crowded rooms affect learning | Do you read CO2 per room against occupancy? |
| Rank buildings for capital | Money goes where the gap is largest | Can you rank buildings against their own expected use? |
| Read every BMS generation | Replacing them all is not affordable | Which protocols and vendors can you read? |
The categories of tools campus estates teams compare
- Traditional BMS and BAS from controls manufacturersReliable, proven control of air handlers, chillers and lighting, with trusted local sequences. Built for control engineers, they rarely cover water, sub-metering or portfolio analytics, and they keep data inside one vendor's world.
- Standalone EMS dashboardsGood at interval energy charts and alarms for one utility. They usually stop at display, without water, air quality, digital twins or a path to control.
- IoT monitoring platformsFast to deploy wireless sensors with tidy charts. Strong for one problem, weaker on balances, baselines, control and the integration that turns a chart into a work order.
- CMMS and EAMThe right home for work orders, assets and maintenance history. They rely on people or other systems to tell them something is wrong.
- Utility bill services and consultantsUseful for audits, bill collection and expert judgment. Monthly and periodic, so they explain what happened long after it happened.
- Facility intelligence platformsOne data layer across water, energy and air, with live digital twins of the systems, weather-normalized baselines, alerts that route to the CMMS and control where control is enabled, with owner approval. On a campus the value is one view across every building generation, tied to the calendar.
How to evaluate a campus intelligence platform
- Inventory buildings, systems and metersFor each building, record the BMS, the meters and whether it is fed by central plant.
- Load bills and the calendarTwelve months of bills give day-one baselines, and the calendar explains seasonal swings.
- Choose a mixed pilotA lecture building, a lab, a residence and the central plant show the range.
- Add occupancy and air in teaching spacesCompare timetabled with actual use and see how air quality follows.
- Judge on decisions madeDid the pilot change a schedule, find a fault, close a water loss or reorder a capital plan? Measure each result.
Campus intelligence platform scorecard
| Criterion | Weight | What good looks like |
|---|---|---|
| Estate coverage | 15% | Every building, plant and network in one hierarchy |
| Integration | 20% | Every BMS generation read without replacement |
| Calendar and occupancy | 15% | Calendar and sensors drive baselines and automations |
| Energy and water baselines | 20% | Per building, weather-normalized, water balanced |
| Air in teaching spaces | 10% | Room CO2 read against occupancy |
| Capital planning support | 10% | Buildings ranked by gap and fault history |
| Control and audit | 10% | Where control is enabled, with owner approval, every command logged |
Integration and data on a campus
The platform should read every BMS on campus over BACnet and Modbus, take central plant data from its controls, and read utility meters wherever they report. Wireless LoRaWAN sensors and gateways cover a campus well and add sub-metering, room air and occupancy without cabling through occupied buildings.
Timetabling and calendar data are inputs, so the platform knows when rooms should be full and when the campus is on break. Findings route to the estates CMMS. Finance and sustainability teams get exports in the units they report in. Over time, buildings with recurring faults or large gaps rise to the top of the capital plan with data behind them.
Keep, replace or build applies building by building: keep sound systems, replace those at end of life with open protocol controllers, and design the layer into every new building.
Compliance and reporting for campuses
- Sustainability commitmentsScope 1 and 2 figures from meters, per building and campus wide.
- ENERGY STAR and benchmarkingPer building benchmarking where cities or states require it.
- ASHRAE 62.1 and school guidanceRoom air data shows ventilation in use, against the guidance the institution follows.
- LEED and building performance standardsMeasured operational data for certified buildings and local performance laws.
Where Aqueduct fits
Aqueduct is a facility intelligence platform. aQ Core holds the campus as buildings, floors, zones and devices, with occupancy from sensors or schedules. aQ EnergySmart baselines every building against weather, on day one from bills. aQ WaterGuard reconciles campus water with unaccounted loss as a live number. aQ AirSafe reads classroom and lecture hall air against occupancy. aQ Assistant answers questions about any building in plain language.
Campuses keep their BMS and read from them, replace end-of-life systems, or build the layer into new buildings. Where control is enabled, with owner approval, Smart Controls sets back empty rooms and runs ventilation to real occupancy, with every command logged.
Breaks are where a campus often finds its easiest wins. Over a holiday, base load should fall to labs, residences still in use and essential services. The portfolio view shows which buildings did not follow, and the electrical digital twin shows which feeders kept running. Those findings go to the estates team as specific, located actions rather than a general request to switch things off.