ISO 50001 energy management, measured from the meter up
ISO 50001 is the international standard for energy management systems. It asks an organization to set an energy baseline, track energy performance indicators and show continual improvement. Aqueduct supplies the measured side: metered energy by site and significant energy use, weather-normalized baselines, EnPIs and savings verified at the meter. Your team runs the management system and the certification audit.

Baselines, indicators and improvement, measured at the meter instead of estimated.
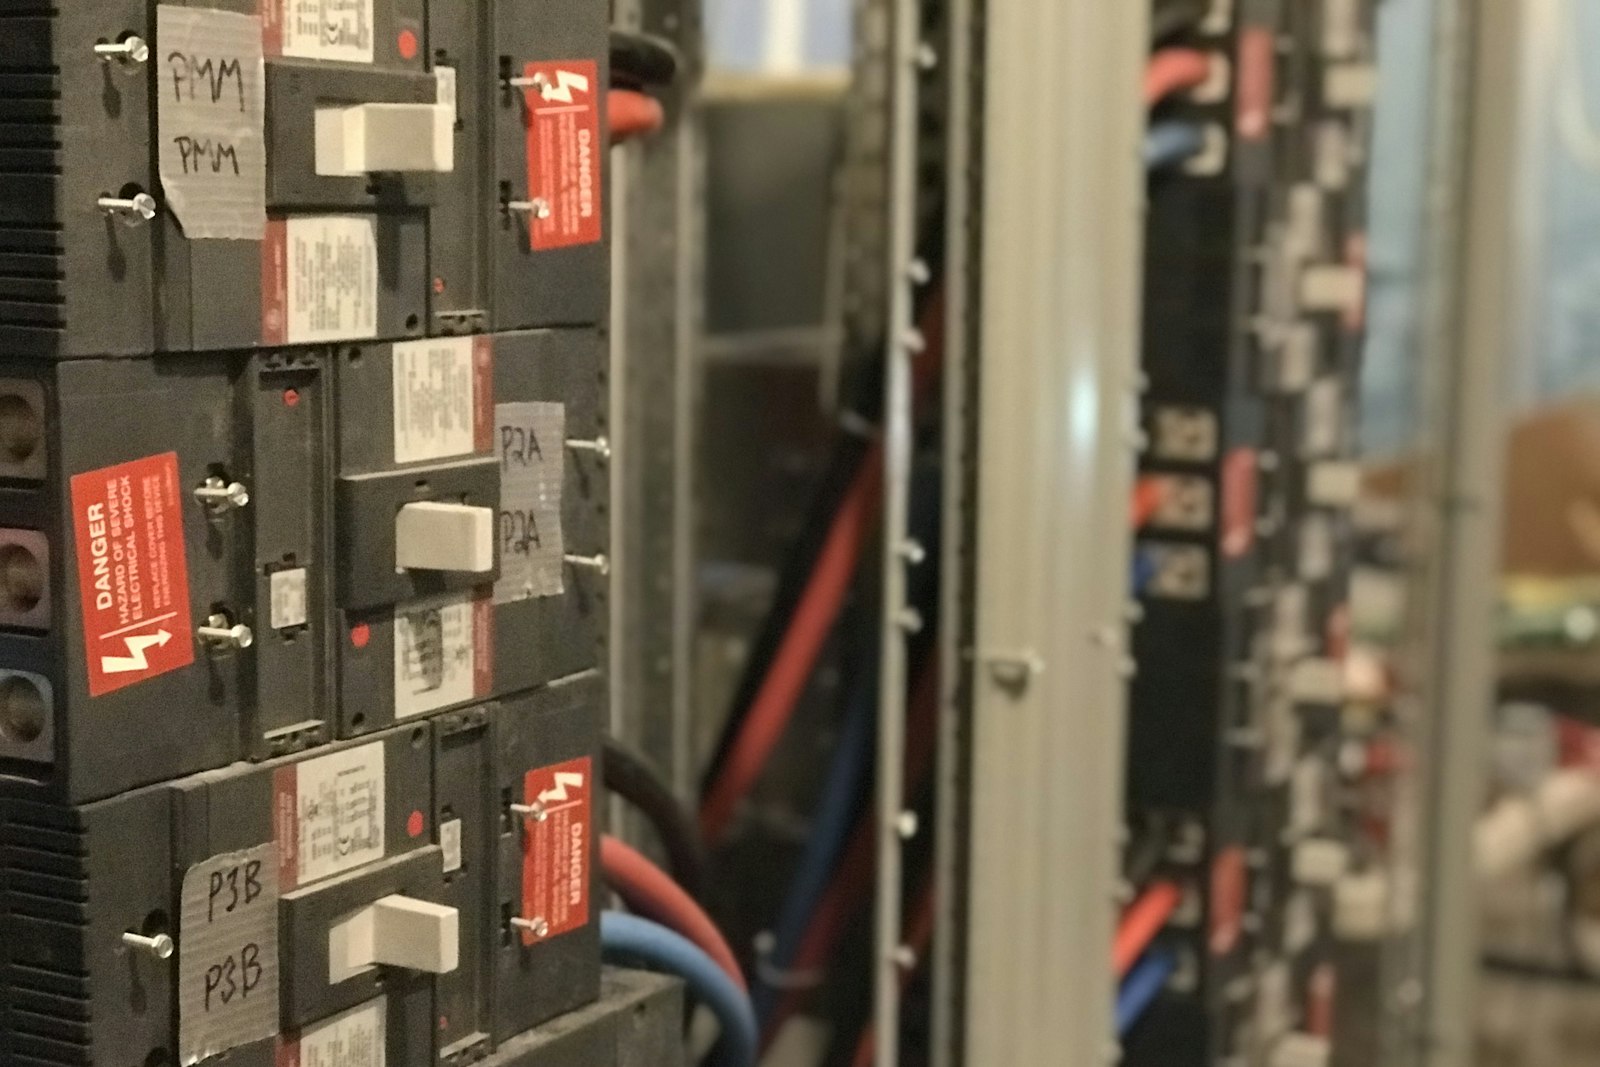
Know which loads are your significant energy uses
- Sub-metered loads
Feeders, plant and major equipment are metered so each significant energy use has its own number.
- Ranked by share
Loads are ranked by consumption and by change, so the energy review starts from evidence.
- Single line view
The electrical digital twin shows sources, switchboard and feeders as one live energy balance.
A baseline adjusted for weather, not for opinion
- Degree day model
Expected energy is regressed on cooling and heating degree days for each site's own location.
- Indicators you choose
Energy use intensity, energy per visitor or per unit of output, tracked every period.
- Day-one baseline
Six to 12 months of utility bills give a baseline before live data has a full year.
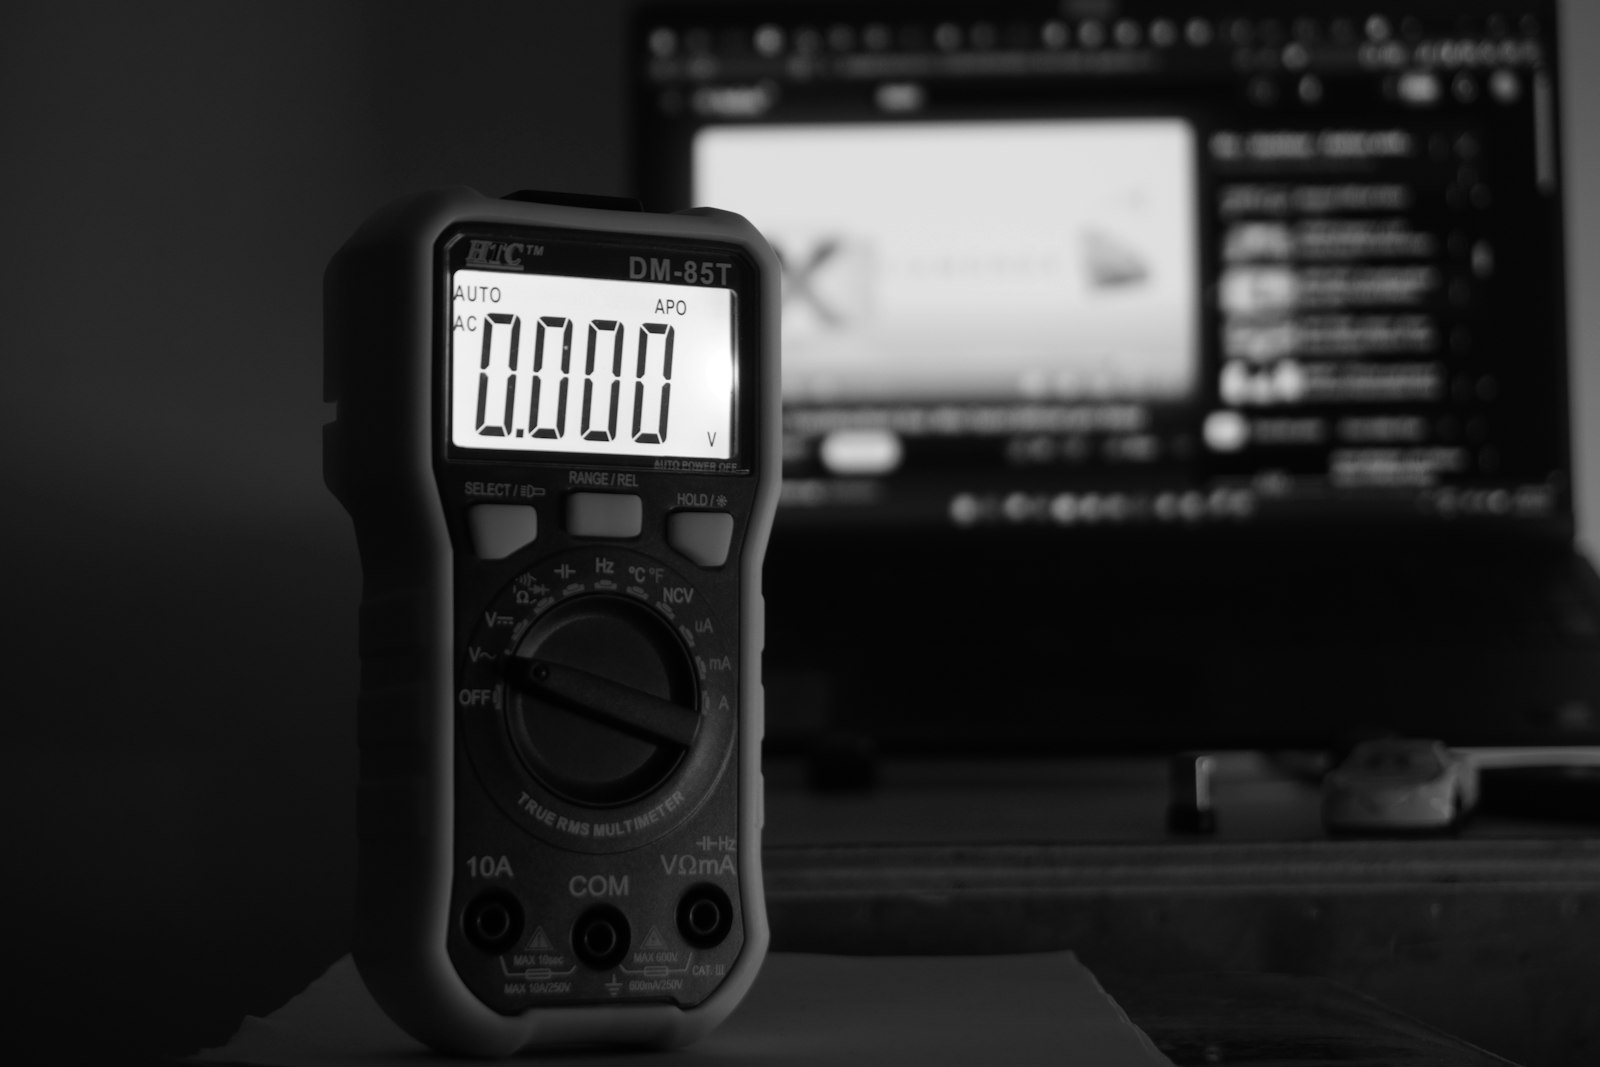
Improvement verified before it goes into the review
- Drift flagged
An indicator above baseline raises a finding with the asset, the time and the likely cause.
- Work routed
Tickets go into your CMMS with a recommended fix, and closures are read back.
- Savings confirmed
The meter verifies each saving, and the verified result becomes the next baseline.

ISO 50001 evidence, before and after Aqueduct
- The energy review starts from twelve monthly bills.
- Significant energy uses are estimated from nameplates.
- The baseline ignores a hotter summer or a colder winter.
- Improvement is claimed from projects, not measured afterward.
- Audit week means pulling data from five different systems.
 The Aqueduct way
- The energy review starts from live, sub-metered consumption.
- Significant energy uses are metered and ranked by actual use.
- The baseline is normalized with cooling and heating degree days.
- Improvement counts only once the meter verifies it.
- Audit records export by site and period from one place.
What ISO 50001 is and who it applies to
ISO 50001 is published by the International Organization for Standardization and sets out the requirements for an energy management system (EnMS). It follows a plan, do, check, act cycle: review how energy is used, set objectives, act, measure and improve. Any organization can adopt it, from a single plant to a global portfolio, and certification is voluntary, granted by an accredited certification body after an audit.
The standard does not set a target number. It asks you to prove that energy performance improves over time against a baseline you defined. That makes measurement the center of the system: an energy review, significant energy uses (SEUs), an energy baseline (EnB), energy performance indicators (EnPIs) and a plan for monitoring and measuring them. Companion standards such as ISO 50006 and ISO 50015 cover baselines, indicators and measurement and verification in more detail.
ISO 50001 requirement areas and the evidence Aqueduct supplies
Aqueduct supplies measured inputs. Your energy team owns the management system and its documents.
| Requirement area | Evidence Aqueduct supplies |
|---|---|
| Energy review | Metered consumption by site, fuel, feeder and sub-meter, with load disaggregation to show where energy goes |
| Significant energy uses | Sub-metered HVAC, lighting, plug, process and plant loads ranked by share and by change over time |
| Energy baseline (EnB) | Regression baselines on cooling and heating degree days, or a day-one baseline from 6 to 12 months of bills |
| Energy performance indicators | EnPIs such as EUI, energy per visitor or per unit of production, normalized for weather |
| Relevant variables and static factors | Live weather per site, occupancy and other drivers recorded alongside consumption |
| Monitoring, measurement and analysis | Telemetry on a 60-second refresh, device health per meter and anomaly alerts |
| Action plans and improvement | Faults routed to your CMMS, controls adjusted where enabled with owner approval, savings verified at the meter |
| Records for the audit | Exports by period and site, command history and verified closures |
How Aqueduct supplies ISO 50001 evidence
The plan, do, check, act cycle runs on the same flywheel: Monitor, Measure, Identify, Act, Verify.
Monitor the energy uses
Main meters and sub-meters on feeders and significant equipment connect over LoRaWAN, Modbus, BACnet, M-Bus or pulse outputs. Installation is through partners.
Measure the baseline
Aqueduct models expected energy against cooling and heating degree days, per site and per significant energy use.
Identify the gap
EnPIs that drift above baseline are flagged with the asset, the time and the likely cause in plain language.
Act on it
A ticket goes into your CMMS with a recommended fix, or setpoints and schedules change where control is enabled and the owner approves.
Verify improvement
The meter confirms the result, and the verified result becomes the new baseline for the next cycle.
What stays with your team and your consultant
ISO 50001 is a management system. Software supplies data, people run the system.
Policy, scope and boundaries
Top management sets the energy policy, the EnMS scope and the objectives. Aqueduct reports within whatever boundary you set.
Documented procedures
Your team writes and maintains the procedures, competence records and internal audits the standard requires.
The certification audit
An accredited certification body audits the system and grants certification. Aqueduct does not certify anyone.
Related standards
Often run alongside ISO 50001.
Where teams put it to work

Energy per unit, tracked by line
Plants pursuing ISO 50001 meter process lines and utilities separately, so energy per unit of output becomes an indicator rather than an annual estimate.
Learn more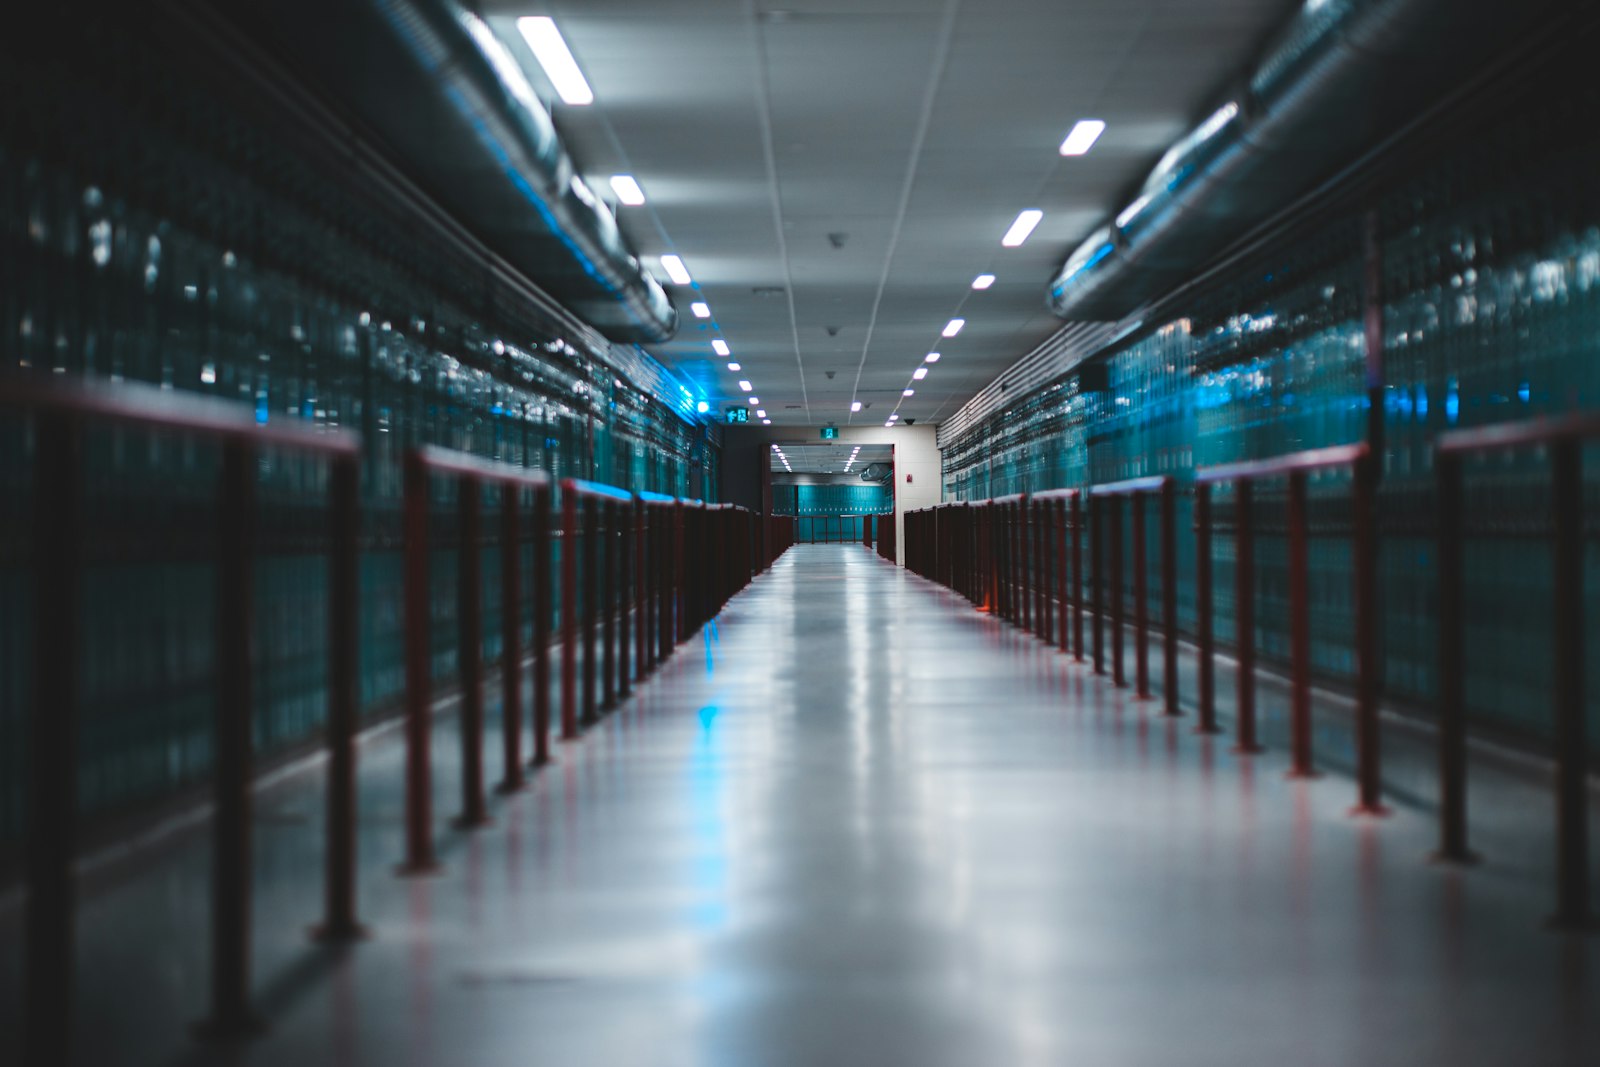
Cooling as a significant energy use
Cooling and power distribution are metered hall by hall, so the energy review and the EnPIs reflect what the site actually uses.
Learn more
Many buildings, one management system
Universities and corporate campuses run one EnMS across many buildings, with each baseline normalized for weather and occupancy.
Learn moreThe ISO 50001 clauses an auditor will test with numbers
ISO 50001:2018 is a management system standard, but six of its clauses cannot be met without measured energy data. This is what each asks for and where the data comes from.
6.3 Energy review
The energy review analyzes past and present energy use, identifies significant energy uses (SEUs) and the people and variables that affect them, and lists improvement opportunities. Auditors expect it to be based on measurement, not estimates.
- Energy by fuel and site for the review period
- SEUs identified from sub-metered or disaggregated loads
- Relevant variables such as weather, occupancy and output named for each SEU
- Data needed
- energy by use and by variable
- Source
- main and sub-meters, weather, occupancy
- Aqueduct
- loads ranked by share with drivers alongside
6.4 Energy performance indicators
EnPIs must be appropriate for measuring and demonstrating energy performance improvement. Where relevant variables affect consumption, the EnPI must be normalized, which is where simple kWh totals fail.
- EUI, energy per unit of output, per visitor or per bed
- Normalized for weather and activity where they matter
- Reviewed when operations change
- Data needed
- energy and activity on the same timeline
- Source
- meters plus production or occupancy data
- Aqueduct
- EnPIs calculated and normalized per site
6.5 Energy baseline
The energy baseline is the reference used to compare performance. It must be revised when static factors change or when it no longer reflects the organization's energy use, and the revision has to be recorded.
- Regression on cooling and heating degree days
- Day-one baseline from 6 to 12 months of bills
- Revision history kept when sites or uses change
- Data needed
- a reference period plus its variables
- Source
- bills, interval data, weather
- Aqueduct
- weather-normalized baselines per site and SEU
6.6 Planning for collection of energy data
The organization must define what is measured, how and how often, covering SEUs, relevant variables, EnPIs and action plan effectiveness. Measurement equipment must give accurate, repeatable data.
- A meter register mapped to SEUs
- Collection frequency per data point
- Device health so failed meters are found quickly
- Data needed
- a documented data collection plan
- Source
- the meter and sensor register
- Aqueduct
- register, device health and coverage per site
8.1 Operational planning and control
SEUs must be operated to set criteria, and deviations from those criteria must be detected. That is a monitoring task as much as a procedure.
- Operating criteria per SEU, such as schedules and setpoints
- Deviation alerts when equipment runs outside criteria
- Work orders routed to your CMMS
- Data needed
- equipment state against criteria
- Source
- BMS points, sub-meters, controllers
- Aqueduct
- deviation alerts and control where enabled, with owner approval
9.1 Monitoring, measurement, analysis and evaluation
The organization must evaluate energy performance improvement by comparing EnPIs with the baseline, investigate significant deviations and keep the results as documented information.
- EnPI against EnB every period
- Significant deviations investigated and recorded
- Results retained for internal and certification audits
- Data needed
- EnPI versus EnB, deviations and responses
- Source
- the same measured dataset
- Aqueduct
- period reports and verified savings at the meter
From first meter to a certification audit
A typical path for a site or portfolio adopting ISO 50001 or tightening its evidence before a surveillance audit.
Energy review on bills
Upload 6 to 12 months of bills per site for a day-one baseline, rank sites by consumption and agree the EnMS scope and boundaries.
Meter the SEUs
Connect main meters and fit sub-meters on the significant energy uses: chillers, air handlers, compressors, process lines and lighting feeders.
Set EnPIs and baselines
Build weather-normalized baselines per SEU, agree EnPIs and record the data collection plan and the operating criteria.
Run, act and verify
Deviations are flagged and closed, actions are verified at the meter and each period's results are exported for internal audit and management review.
ISO 50001 clauses mapped to meters and sensors
A practical starting point. Your energy review decides the final meter list.
| Clause | What it needs measured | Meters and sensors | Aqueduct output |
|---|---|---|---|
| 6.3 Energy review | Energy by fuel, site and use | Utility meters, CT sub-meters, gas pulse outputs | Consumption by use, ranked |
| 6.3 SEUs | Loads of the largest systems | Sub-meters on chillers, AHUs, compressors, process lines | SEU trends and share |
| 6.4 EnPIs | Activity alongside energy | Occupancy sensors, production counts, visitor or bed data | Normalized EnPIs |
| 6.5 Energy baseline | Weather and the reference period | Weather per site, bills, interval meters | Regression baseline per site and SEU |
| 6.6 Data collection plan | Meter accuracy and availability | All connected devices | Meter register and device health |
| 8.1 Operational control | Equipment state against criteria | BMS points over BACnet, Modbus controllers, relays | Deviation alerts and command history |
| 9.1 Evaluation | EnPI against baseline | The same meters | Period reports and verified savings |
| 10.2 Continual improvement | Results of actions | Meters on the affected SEU | Verified result becomes the new reference |
Sources1 references cited on this page
sites in 21 countries run on Aqueduct.
and 9 clinics in one of India’s top hospital chains.
US airport running water intelligence on Aqueduct.
of commercial real estate under Aqueduct.
FMCG manufacturing campus.
operations run on Aqueduct.



Related
Common questions
ISO 50001 is the international standard for energy management systems. It requires an organization to understand its energy use, set a baseline and indicators, act on opportunities and show continual improvement. Aqueduct supplies the metered data and verified savings that sit behind those requirements.
An energy baseline is the reference period of energy use that later performance is compared with, adjusted for relevant variables such as weather. Aqueduct builds it by regression on cooling and heating degree days, or from 6 to 12 months of utility bills for a day-one start.
Energy performance indicators are the measures an organization chooses to track energy performance, such as energy use intensity or energy per unit of output. Aqueduct calculates them from live meters and normalizes them for weather so improvement is real, not seasonal.
The standard does not prescribe a meter count, but it requires you to identify significant energy uses and monitor them. In practice that usually means sub-metering the largest loads, which Aqueduct reads over LoRaWAN, Modbus, BACnet, M-Bus or pulse outputs.
No. Certification is granted by an accredited certification body after auditing your management system. Aqueduct supplies the measured evidence, baselines and verified improvement your team presents in that audit.
Aqueduct compares actual energy against the weather-normalized baseline every period and verifies each saving at the meter. Each verified result becomes the new baseline.
No. ISO 14001 covers environmental management broadly, while ISO 50001 focuses on energy performance. Many organizations run both, and Aqueduct supplies measured energy and water data to each.
The 2018 edition adopted the common high-level structure used by other ISO management system standards, strengthened top management's role and clarified the concepts of energy performance improvement, EnPIs and baselines. Check whether a newer edition or amendment applies to your audit cycle.
They look for a plan that names what is measured for each significant energy use, relevant variable and EnPI, how often and with which equipment. Aqueduct keeps that register with device health, so a failed meter is visible before the audit.
ISO 50001 requires revision when EnPIs no longer reflect performance, when static factors change significantly or as your methodology defines. Aqueduct keeps the baseline history so each revision is recorded.
Yes. Many organizations certify several sites under one EnMS. Aqueduct holds every site in one hierarchy so EnPIs roll up consistently and site comparisons are fair.
See Aqueduct on your own facility.
Bring a site, a utility bill or a question. We will show you where the loss is.