Data center water and energy: measuring PUE and WUE from the meters up
 Milvian AI teamFacilities and infrastructure intelligence
Data center water and energy management is measuring and reducing the power and water a facility uses beyond its IT load, mainly in cooling and electrical distribution. Aqueduct supports it by metering the switchboard, UPS, cooling plant and towers, calculating PUE and WUE from real meters, flagging power quality and cooling faults, and verifying each improvement at the meter.
Water and energy are one problem in a data center
A data center turns electricity into computing and heat. Almost everything the facility does beyond running the IT equipment is about getting that heat out and keeping power clean and available. Cooling uses energy, and in many designs it also uses water. Electrical distribution loses energy in transformers, UPS systems and power distribution. Those overheads are where efficiency lives.
Water and energy trade against each other. Evaporative cooling and cooling towers can reduce chiller energy, but they consume water. Air-cooled and closed-loop designs save water but may use more power on hot days. A facility team that optimizes one without measuring the other can make the total worse while improving the number it reports.
That is why data center operators need both resources in one measured system. Aqueduct reads electricity, cooling plant and water meters into one data layer, so a change in cooling strategy shows up in power and water at the same time, verified at the meter.
PUE and WUE, measured rather than estimated
Power usage effectiveness, or PUE, is total facility energy divided by IT equipment energy. Water usage effectiveness, or WUE, is site water use divided by IT equipment energy. Both were defined by The Green Grid and are standardized in the ISO/IEC 30134 series. A PUE close to one means little energy goes to overhead. A lower WUE means less water per unit of IT energy.
The metrics are simple. Measuring them well is not. PUE needs a clean split between IT load and everything else, which usually means metering at the UPS output or the power distribution units as well as at the utility service. WUE needs the water that actually serves the data center, separated from offices, kitchens and landscaping on the same site. Both need the same time base, or the ratio means nothing.
Many sites still estimate one or both from design figures or monthly bills. Aqueduct calculates them from interval meter data, hall by hall where the metering allows, so the number on the report is the number the meters recorded. When a cooling change is made, the effect on both ratios is visible within days rather than at the next quarterly review.
Data center metrics and the meters behind them
Each metric is only as good as the meters that feed it.
| Metric | Definition | Meters needed |
|---|---|---|
| PUE | Total facility energy divided by IT equipment energy | Utility service or switchboard, plus UPS output or PDU metering |
| WUE | Site water use divided by IT equipment energy | Cooling tower make-up and other data center water, plus IT energy |
| Cooling plant efficiency | Cooling delivered against plant power | Chiller, pump and tower fan power, chilled water flow and temperatures |
| Power factor | Real power against apparent power | Power monitoring at the switchboard and major feeders |
| Peak demand | Highest interval demand in a billing period | Interval metering at the utility service |
| Cycles of concentration | Dissolved solids in tower water against make-up water | Make-up and blowdown flow, with conductivity where available |
Cooling water: towers, make-up and blowdown
Where a data center uses cooling towers, they are usually the largest water use on site. Water evaporates to reject heat, more leaves as blowdown to control the build-up of dissolved solids, and some is lost as drift and overflow. Make-up water replaces all of it.
The ratio between make-up and blowdown, expressed as cycles of concentration, is the main lever. Running more cycles uses less water, within the limits water treatment allows. A blowdown valve stuck open, a float valve that overfills the basin or a conductivity controller out of calibration all waste water every hour, and none of them shows on a monthly bill until long after it started.
Metering make-up and blowdown on each tower, and reading them against cooling load and outdoor conditions, shows when a tower is using water out of step with the heat it is rejecting. Aqueduct baselines that relationship and flags departures from it, routes the fix to the facility CMMS, and confirms at the meter that the tower returned to its expected profile.
Power quality and the electrical path
Energy lost between the utility service and the IT equipment is still energy paid for. Transformers, UPS systems and distribution all have losses, and they vary with load. Power quality issues add to the cost. A low power factor means more current is needed to do the same work, which raises losses and can bring utility penalties. Voltage and current imbalance can stress equipment and shorten its life.
Aqueduct's electric digital twin renders the site as a single line: sources such as grid, solar and backup generation feeding the main switchboard, then the distribution to cooling, IT and other loads. Each node shows active, reactive and apparent power, power factor and loading against rated capacity, and the energy balance shows where losses sit. Power monitoring devices supply voltage, current, frequency, phase angle, imbalance and peak demand.
Peak demand matters on tariffs that charge for it. Generator tests, chiller restarts and cooling transients can set a monthly peak in a single interval. Seeing those peaks as they happen lets the team sequence loads and schedule tests so they do not stack.
Faults and early warning in the cooling plant
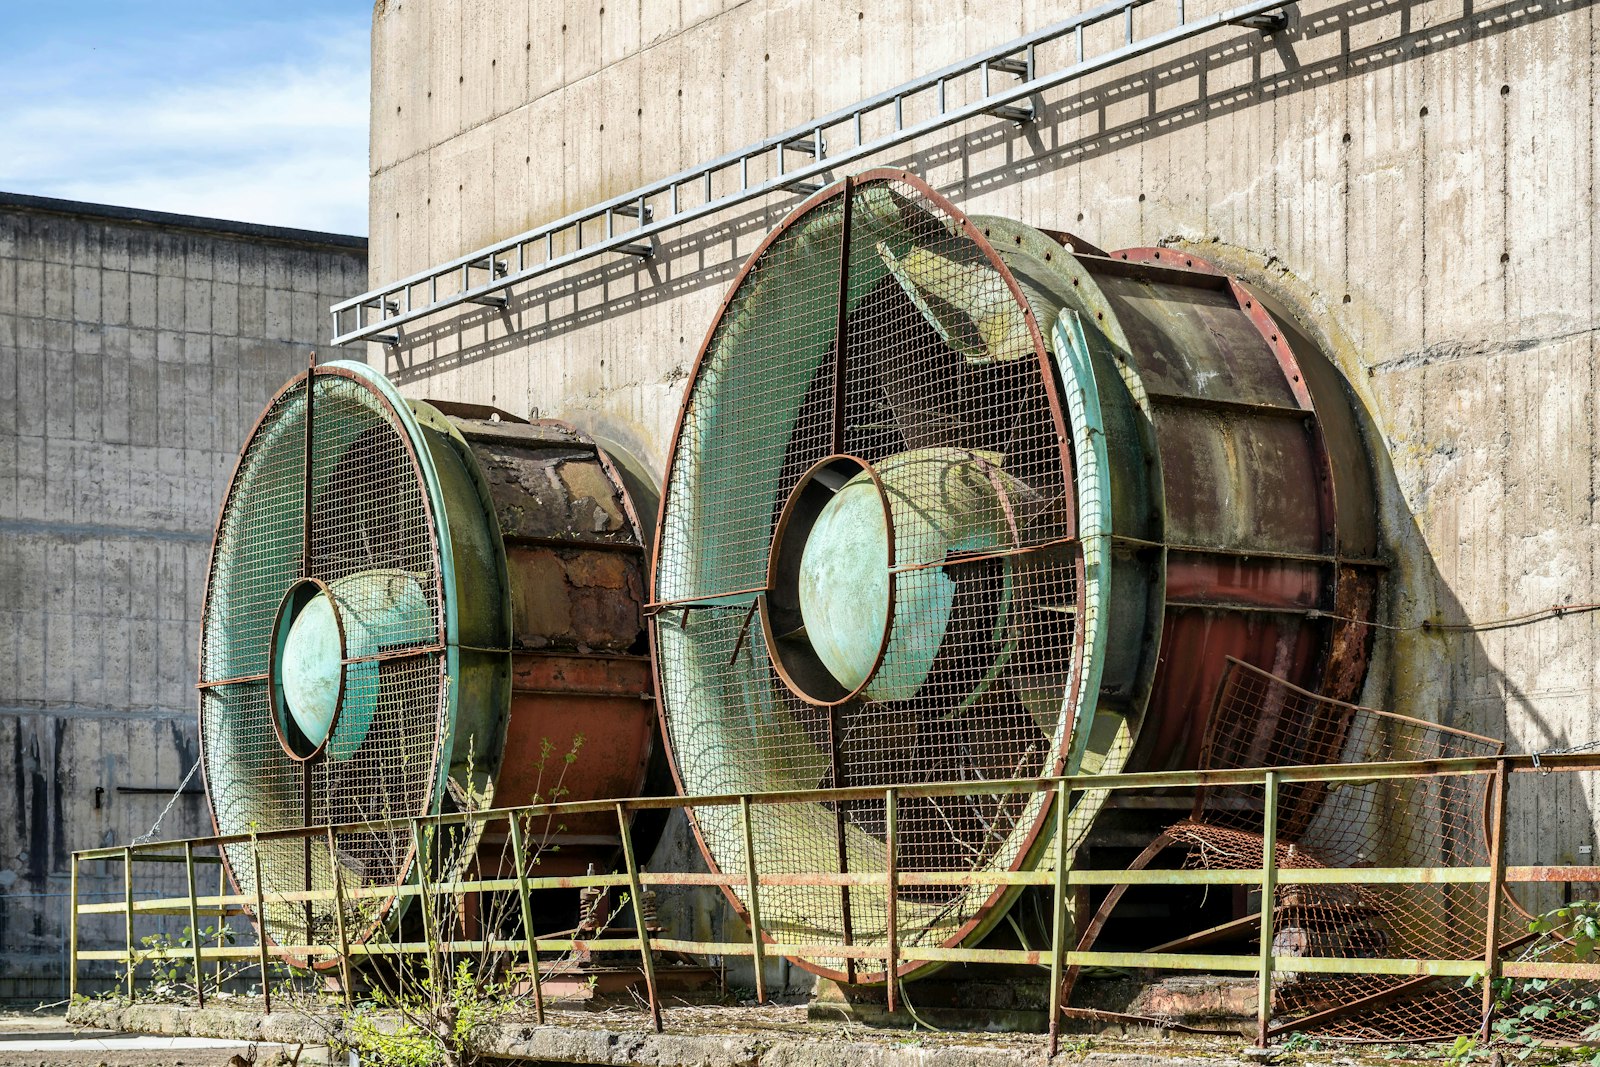
Cooling plants drift. Chillers lose efficiency as tubes foul, pumps run at fixed speed when they could modulate, economizers fail to engage when outdoor conditions allow free cooling, and computer room air handlers fight each other with one heating while the next cools. Each fault adds power, and some add water.
Fault detection and diagnostics finds those patterns in the data, explains the likely cause in plain language and routes a ticket into the CMMS with the evidence. Aqueduct does not replace the CMMS or the data center's own monitoring of the IT floor. It adds the facility layer: plant, power and water, measured and acted on.
As vibration and acoustic sensing is added to rotating equipment, early signs of failure such as a rising vibration level, a new sound signature or a slow drift in energy use can schedule maintenance before a pump or compressor fails. In a facility where cooling is critical, that matters more than the energy it saves.
Reporting without rework
Data center operators face growing pressure to report energy and water. Customers ask for PUE and WUE in contracts, investors ask for them in sustainability reports, and in some jurisdictions regulation now requires data centers above a size threshold to report energy and water performance. Each request tends to arrive with its own spreadsheet.
Measured data from one platform removes the rework. Aqueduct exports verified monthly metrics by site and hall, with the meters behind each figure, so the same numbers serve contracts, sustainability reports and regulatory submissions. Aqueduct supplies the metrics. The operator or its consultant files the reports.
Where data must stay on site, Aqueduct also runs on-prem AI on NVIDIA infrastructure, and Milvian AI holds ISO/IEC 27001 and SOC 2 Type 2, which helps with the security reviews data center operators run on every connected system.
Where to start
Start with the meters that decide the two headline ratios: the utility service, the UPS output or PDU metering, and cooling tower make-up and blowdown. Check that each is reporting at a useful interval and that the device health view shows connection rate and battery or capacitor voltage, so the data can be trusted.
Then baseline. Upload 6 to 12 months of utility bills to model expected use against weather from day one, and let interval data refine it. Every change your team makes is then verified at the meter against that weather-normalized baseline rather than against last year.